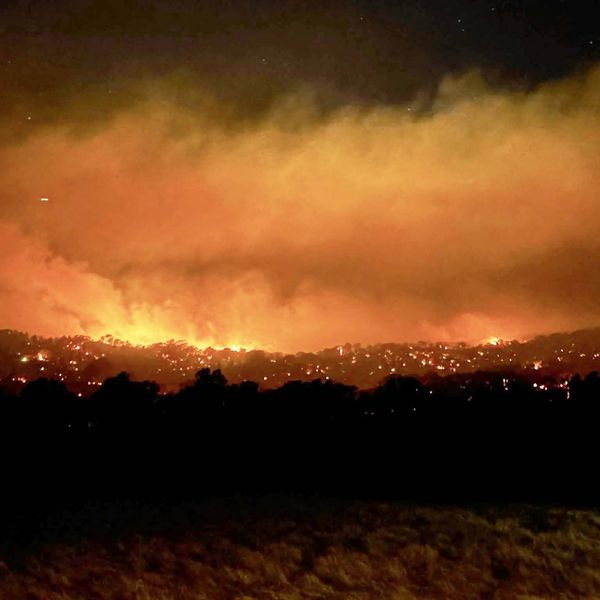
This photo shows the site of a forest fire in Penco, Biobío region, Chile on January 18, 2026. (Photo by Xinhua via Getty Images)
“The first priority, as you know, in these emergencies is always to fight and extinguish the fire. But we cannot forget, at any time, that there are human tragedies here,” said the country’s president.
On the heels of another historically hot year for Earth, disasters tied to the fossil fuel-driven climate emergency have yet again turned deadly, with wildfires in Chile’s Ñuble and Biobío regions killing at least 18 people—a figure that Chilean President Gabriel Boric said he expects to rise.
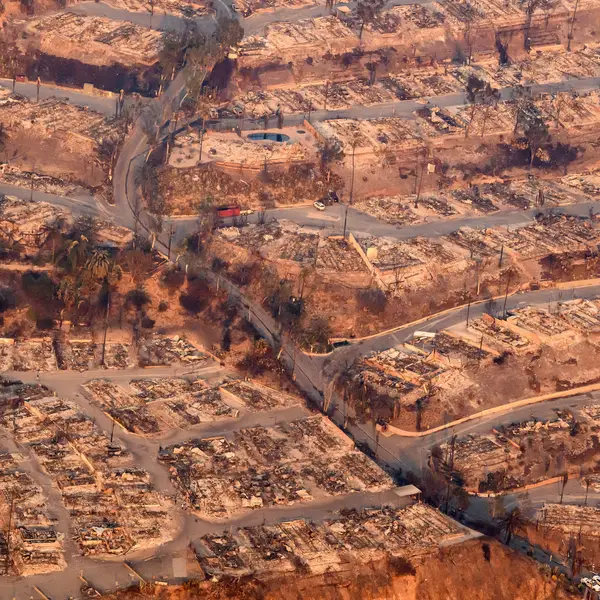
The South American leader on Sunday declared a “state of catastrophe” in the two regions, where ongoing wildfires have also forced more than 50,000 people to evacuate. The Associated Pressreported that during a Sunday press conference in Concepción, Boric estimated that “certainly more than a thousand” homes had already been impacted in just Biobío.
“The first priority, as you know, in these emergencies is always to fight and extinguish the fire. But we cannot forget, at any time, that there are human tragedies here, families who are suffering,” the president said. “These are difficult times.”
According to the BBC, “The bulk of the evacuations were carried out in the cities of Penco and Lirquen, just north of Concepción, which have a combined population of 60,000.”
🚨 #Urgente | Región del Biobío: Continuamos desplegados en distintos puntos de la región, facilitando y agilizando el tránsito vehicular de los equipos de emergencia en las zonas más afectadas por los incendios forestales. Asimismo, estamos apoyando a las familias que… pic.twitter.com/ECCV7x3RAA
Some Penco residents told the AP that they were surprised by the fire overnight.
“Many people didn’t evacuate. They stayed in their houses because they thought the fire would stop at the edge of the forest,” 55-year-old John Guzmán told the outlet. “It was completely out of control. No one expected it.”
Chile’s National Forest Corporation (CONAF) said that as of late Monday morning, crews were fighting 26 fires across the regions.
Authorities say adverse conditions like strong winds and high temperatures helped wildfires spread and complicated firefighters’ abilities to control the fires. Much of Chile was under extreme heat alerts, with temperatures expected to reach up to 38ºC (100ºF) from Santiago to Biobío on Sunday and Monday.
Both Chile and Argentina have experienced extreme temperatures and heatwaves since the beginning of the year, with devastating wildfires breaking out in Argentina’s Patagonia earlier this month.
Scientists have warned and research continues to show that, as one Australian expert who led a relevant 2024 study put it to the Guardian, “the fingerprints of climate change are all over” the world’s rise in extreme wildfires.
“We’ve long seen model projections of how fire weather is increasing with climate change,” Calum Cunningham of Australia’s University of Tasmania said when that study was released. “But now we’re at the point where the wildfires themselves, the manifestation of climate change, are occurring in front of our eyes. This is the effect of what we’re doing to the atmosphere, so action is urgent.”
Sharing the Guardian‘s report on the current fires in Chile, British climate scientist Bill McGuire declared: “This is what climate breakdown looks like. But this is just the beginning…”
Chilean President Gabriel Boric declared a state of catastrophe in two regions in the south of the country as raging wildfires forced at least 20,000 people to evacuate and left at least 18 people dead https://t.co/1TJt5oHSZqpic.twitter.com/FReiQo1lha
The most recent United Nations Climate Change Conference, where world leaders aim to coordinate a global response to the planetary crisis, was held in another South American nation that has faced devastating wildfires—and those intentionally set by various industries—in recent years: Brazil. COP30 concluded in November with a deal that doesn’t even include the words “fossil fuels.”
“This is an empty deal,” Nikki Reisch of the Center for International Environmental Law said at the time. “COP30 provides a stark reminder that the answers to the climate crisis do not lie inside the climate talks—they lie with the people and movements leading the way toward a just, equitable, fossil-free future. The science is settled and the law is clear: We must keep fossil fuels in the ground and make polluters pay.”
Elon Musk urges you to be a Fascist like him, says that you can ignore facts and reality then.Donald Trump urges you to be a Climate Science denier like him. He says that he makes millions and millions for destroying the planet, Burn, Baby, Burn and Flood, Baby, Flood.Orcas discuss Donald Trump and the killer apes’ concept of democracy. Front Orca warns that Trump is crashing his country’s economy and that everything he does he does for the fantastically wealthy.
Original article by republished from Common Dreams under Creative Commons (CC BY-NC-ND 3.0).
Environmental Protection Agency Administrator Lee Zeldin listens as President Donald Trump holds a Cabinet meeting in the Cabinet Room of the White House in Washington, DC on August 26, 2025. (Photo by Mandel Ngan/AFP via Getty Images)
“Administrator Zeldin is removing all incentives for big polluters to follow the law and turning a blind eye to those who suffer from the impacts of pollution.”
The Trump administration settled just 15 of the illegal pollution cases referred by the US Environmental Protection Agency in the first year of President Donald Trump’s second term in the White House, according to data compiled by a government watchdog—the latest evidence that Trump officials are placing corporate profits above the EPA’s mission to “protect human health and the environment.”
“Under [EPA Administrator] Lee Zeldin, anti-pollution enforcement is dying a quick death,” said Tim Whitehouse, executive director of PEER and a former enforcement attorney at EPA.
The DOJ lodged just one environmental consent decree in a case regarding a statutory violation of the Clean Air Act from the day Trump was inaugurated just over a year ago until now—signaling that the agency “virtually stopped enforcing” the landmark law that regulates air pollution.
“Enforcing the Clean Air Act means going after violators within the oil, gas, petrochemical, coal, and motor vehicle industries that account for most air pollution,” reads the report. “But these White House favorites will be shielded from any serious enforcement, at least, while Lee Zeldin remains EPA’s administrator.”
“For the sake of our health and the environment, Congress and the American people need to push back against Lee Zeldin’s dismantling of EPA’s environmental enforcement program.”
In the first year of his first term, Trump’s DOJ settled 26 Clean Air Act cases, even more than the 22 the department prosecuted in Biden’s first year.
The report warns that plummeting enforcement actions are likely to contribute to health harms in vulnerable communities located near waterways that are filled with “algae blooms, bacteria, or toxic chemicals” and near energy and chemical industry infrastructure, where people are more likely to suffer asthma attacks and heart disease caused by smog and soot.
“Enforcing environmental laws ensures that polluters are held accountable and prevented from dumping their pollution on others for profit,” said Joanna Citron Day, general counsel for PEER and a former senior counsel at DOJ’s Environmental Enforcement Section. “For the sake of our health and the environment, Congress and the American people need to push back against Lee Zeldin’s dismantling of EPA’s environmental enforcement program.”
EPA’s own enforcement and compliance database identifies 2,374 major air pollution sources that have not had a full compliance evaluation in at least five years, and shows that no enforcement action has been taken at more than 400 sources that are marked as a “high priority.”
Nearly 900 pollution sources reported to the EPA that they exceeded their wastewater discharge limits at least 50 times in the past two years.
The agency has also repealed its rules limiting carbon pollution from gas-powered cars, arguing that the EPA lacks the authority to regulate carbon.
As public health risks mount, PEER noted, Zeldin is moving forward with plans to stop calculating the health benefits of rules aimed at reducing air pollution, and issued a memo last month detailing a “compliance first” policy emphasizing a “cooperative, industry-friendly approach” to environmental regulation.
“Administrator Zeldin is removing all incentives for big polluters to follow the law,” said Whitehouse, “and turning a blind eye to those who suffer from the impacts of pollution.”
Donald Trump urges you to be a Climate Science denier like him. He says that he makes millions and millions for destroying the planet, Burn, Baby, Burn and Flood, Baby, Flood.Elon Musk urges you to be a Fascist like him, says that you can ignore facts and reality then.Orcas discuss Donald Trump and the killer apes’ concept of democracy. Front Orca warns that Trump is crashing his country’s economy and that everything he does he does for the fantastically wealthy.
The year 2025 was in the top-three warmest years on record, with average surface temperatures reaching around 1.44C above pre-industrial levels across eight independent datasets.
The different temperature records confirm that last year was either the second or third warmest since observations began in the mid-1800s, with razor-thin margins between 2025 and 2023.
Last year also set a new record for ocean heat content, with the oceans absorbing more than 90% of the heat trapped by increasing greenhouse gas concentrations in the atmosphere.
Here, Carbon Brief examines the latest data across the Earth’s oceans, atmosphere, cryosphere and surface temperature. (Use the links below to navigate between sections.)
Noteworthy findings from this 2025 review include…
Ocean heat content: It was the warmest year on record for ocean heat content and one of the largest year-over-year increases in ocean heat content. In 2025, the oceans added 39 times more heat than all annual human energy use.
Global surface temperatures:The year 2025 is effectively tied with 2023 as the second-warmest year on record – coming in at between 1.33C and 1.53C above pre-industrial levels across different temperature datasets and 1.44C in the synthesis of all groups.
Second warmest over land: Global temperatures over the world’s land regions – where humans live and primarily experience climate impacts – were 2C above pre-industrial levels, just below the record set in 2024.
Third warmest over oceans: Global sea surface temperatures were 1C above pre-industrial levels, dropping from 2024 record levels due to fading El Niño conditions.
Regional warming: It was the warmest year on record in areas where, collectively, more than 9% of the global population lives.
Unusual warmth: The exceptionally warm, record-setting temperatures over the past three years (2023-25) were driven by continued increases in human emissions of greenhouse gases, reductions in planet-cooling sulphur dioxide aerosols, variability related to a strong El Niño event and a strong peak in the 11-year solar cycle.
Greenhouse gases: Concentrations reached record levels for carbon dioxide (CO2), methane and nitrous oxide.
Sea ice extent: Arctic sea ice saw its lowest winter peak on record as well as its 10th-lowest summer minimum extent, while Antarctic sea ice saw its third-lowest minimum extent.
Looking ahead to 2026: Carbon Brief predicts that global average surface temperatures in 2026 are likely to be between the second and fourth warmest on record, similar to 2023 and 2025, at around 1.4C above pre-industrial levels.
Ocean heat content sets a new record
The year 2025 was the warmest on record for the heat content of the world’s oceans.
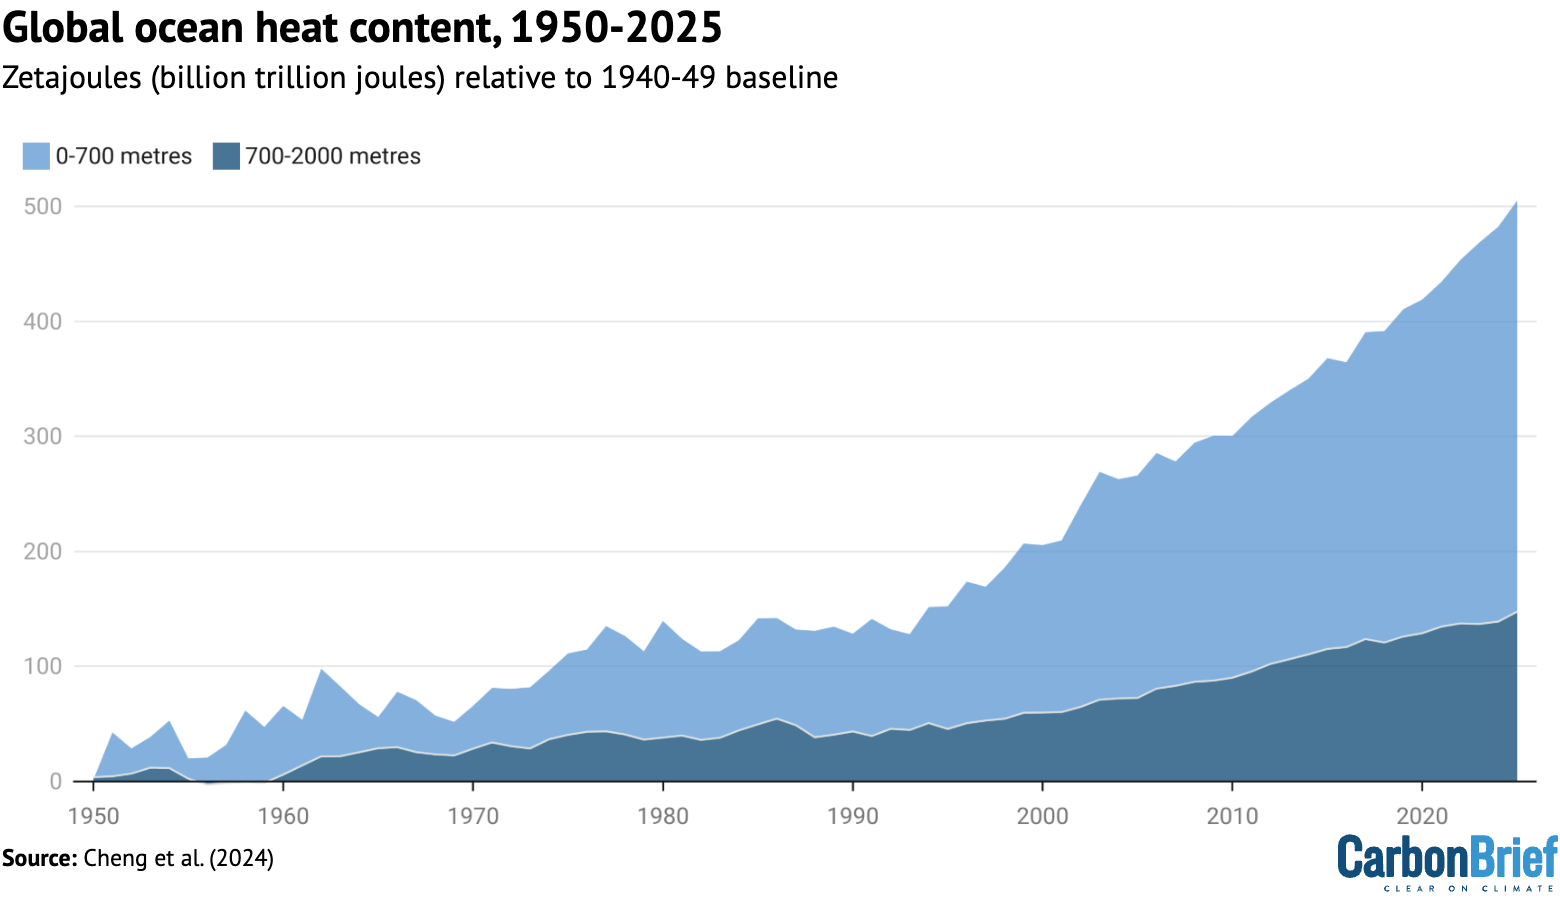
Ocean heat content (OHC) increased by around 500 zettajoules – billion trillion joules – since the 1940s.
The heat increase in 2025 alone compared to 2024 – about 23 zettajoules – is around 39 times as much as the total energy produced by all human activities on Earth in 2023 (the latest year in which global primary energy statistics are available). It was also the largest increase in ocean heat content since 2017 (following the strong El Niño event of 2016).
Human-emitted greenhouse gases trap extra heat in the atmosphere. While some of this warms the Earth’s surface, the vast majority – around of 93% – goes into the oceans. About two-thirds of this accumulates in the top 700 metres, but some also ends up in the deep oceans.
The figure below shows annual OHC estimates from the Chinese Institute for Atmospheric Physics (IAP) between 1950 and present for the upper 700 metres (light blue shading) and 700-2,000 metres (dark blue) of the ocean.
Annual global ocean heat content (in zettajoules – billion trillion joules, or 10^21 joules) for the 0-700 metre and 700-2,000 metre layers. Data updated from Cheng et al. (2024). Chart by Carbon Brief.
In a new paper published last week, researchers found that the rate of OHC increase over the past 15 years is unprecedented over the observational record in the IAP dataset. More broadly, there has been a distinct acceleration in OHC after 1991 – and recent OHC growth rates are generally consistent with satellite measurements of Earth energy imbalance (EEI).
(Energy imbalance is a measure of how much surplus heat there is in the Earth’s climate system. It is the difference between how much energy enters Earth’s atmosphere from the sun and how excess heat is radiated back into space as the world warms.)
In many ways, OHC represents a much better measure of climate change than global average surface temperatures, because it is where most of the extra heat ends up and is much less variable on a year-to-year basis than surface temperatures.
The analysis reveals that global surface temperatures were between the second and third warmest since records began in the mid-1800s. Temperatures effectively tied with 2023 within the margin of uncertainty, below the record set last year in 2024.
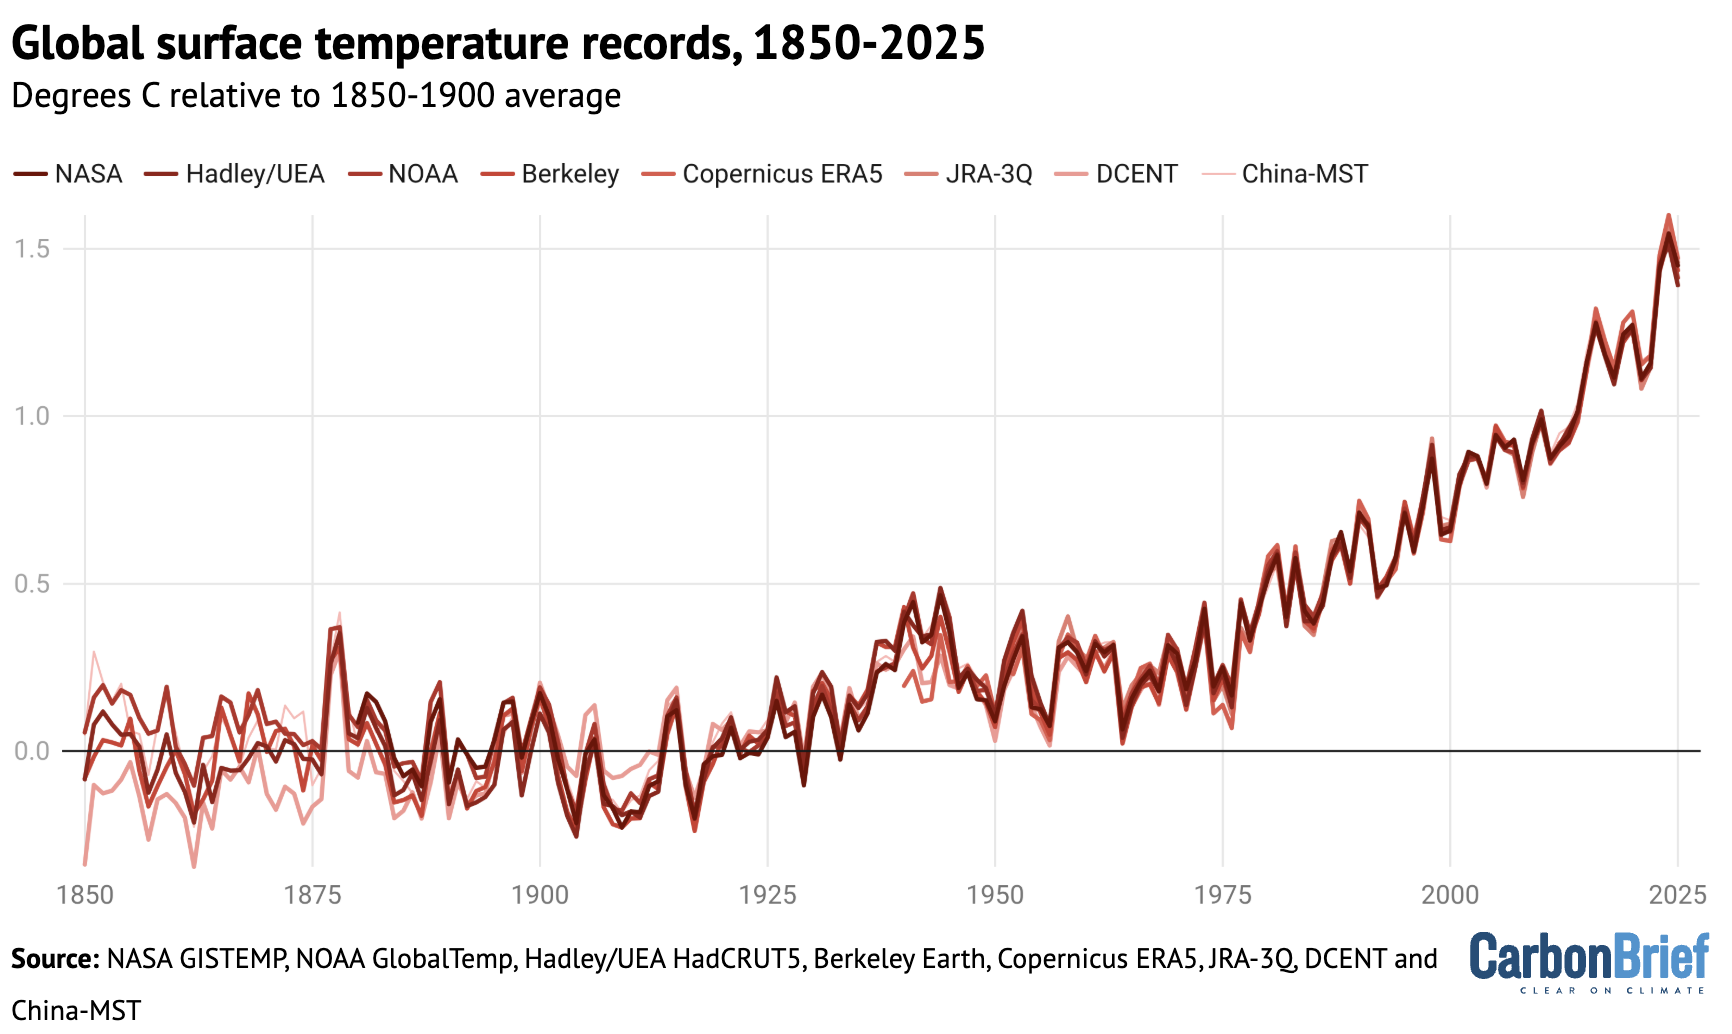
The figure below shows global surface temperature records from the eight datasets.
Global surface temperature records can be calculated back to 1850, though some groups such as NASA GISTEMP choose to start their records in 1880 when more data was available.
Prior to 1850, records exist for some specific regions, but are not sufficiently widespread to calculate global temperatures with high accuracy (though newly published research has attempted to extend this back to 1781).
These longer surface temperature records are created by combining ship- and buoy-based measurements of ocean sea surface temperatures with temperature readings of the surface air temperature from weather stations on land. (Copernicus ERA5 and JRA-3Q are an exception, as they use weather model-based reanalysis to combine lots of different data sources over time.)
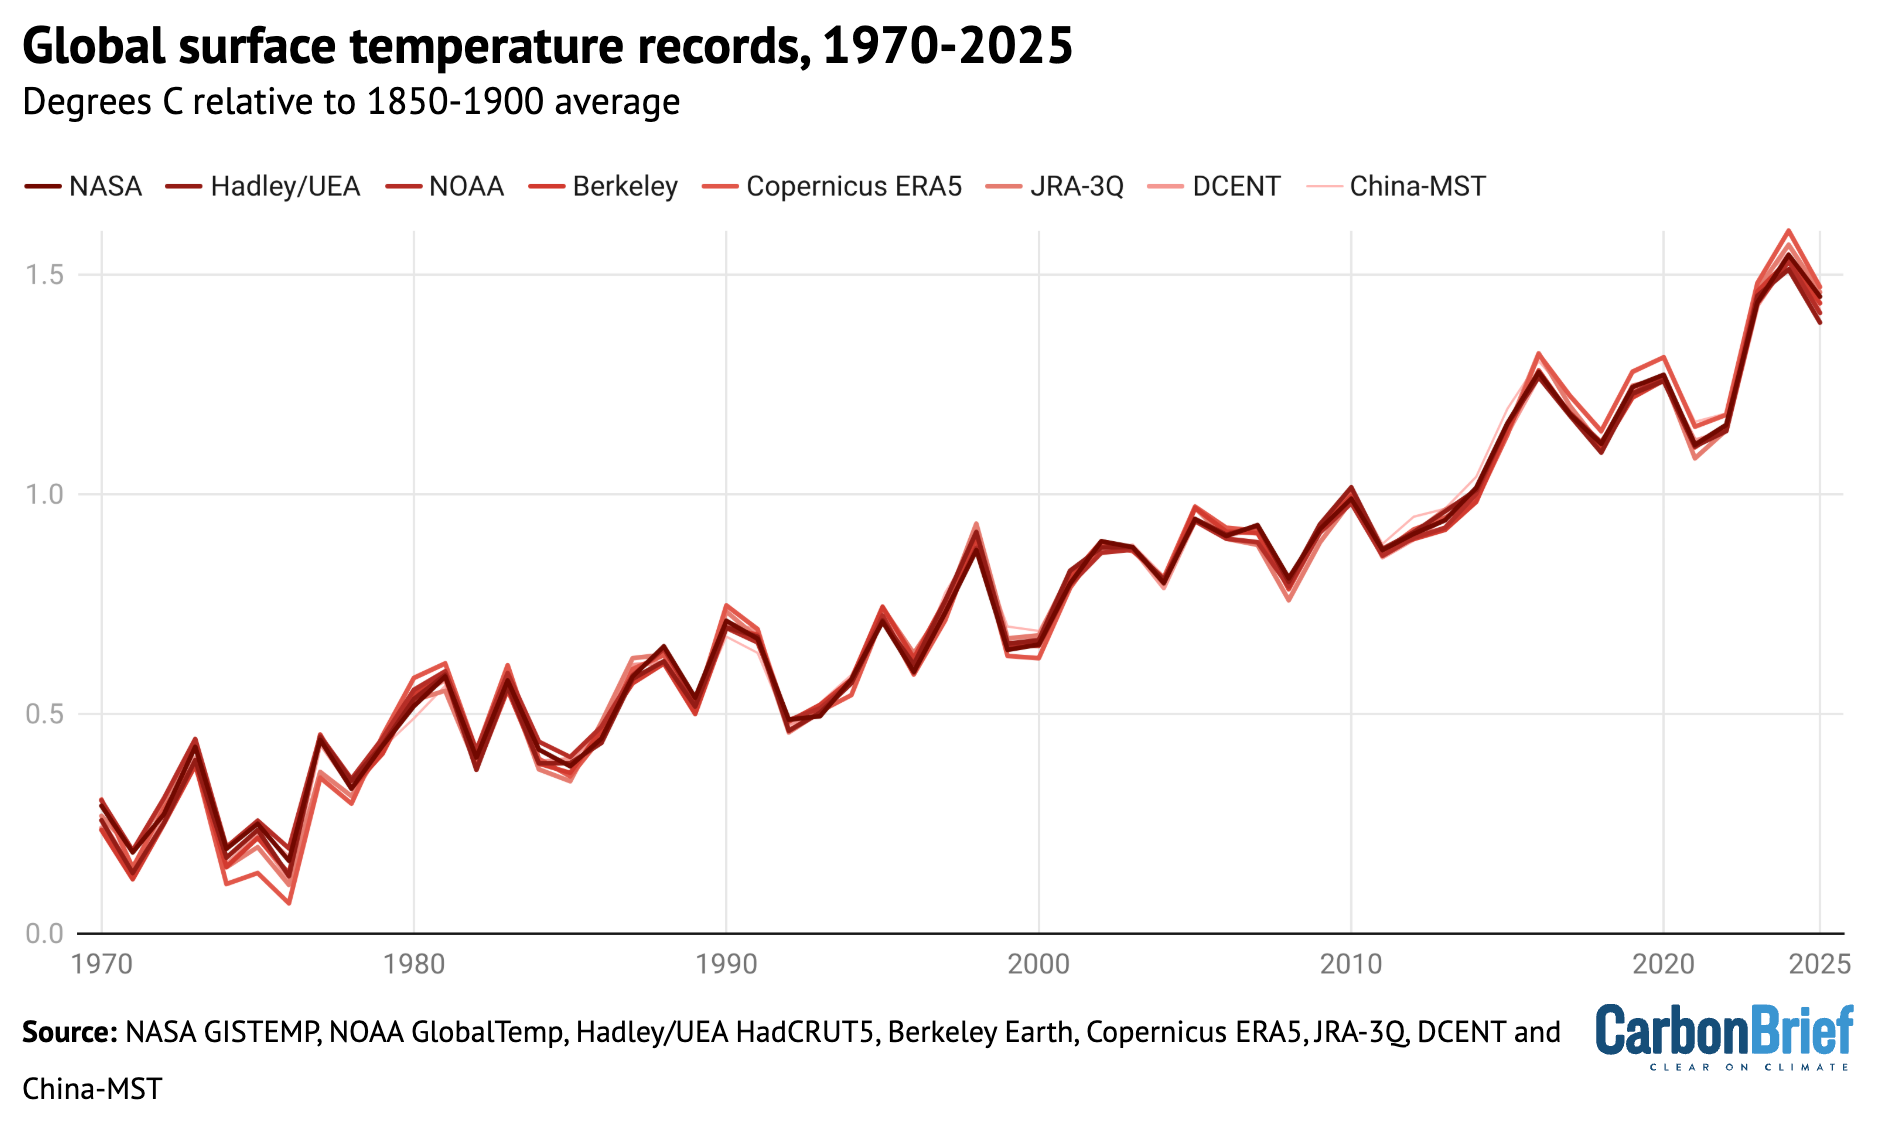
Some differences between temperature records are apparent early in the record, particularly prior to 1900 when observations are more sparse and results are more sensitive to how different groups fill in the gaps between observations. However, there is strong agreement between the different temperature records for the period since 1970, as shown in the figure below.
Annual global average surface temperatures as in the prior chart, but showing the period from 1970-2025. Chart by Carbon Brief.
Global temperatures over the past three years clearly stand out as much warmer than anything that has come before, well above the prior record set in 2016. More broadly, the 11 warmest years on record all happened in the past 11 years.
Two of the eight datasets analysed by Carbon Brief – NASA and DCENT – had 2025 as the second-warmest year behind 2024, while six of the datasets had 2025 as the third-warmest year behind both 2023 and 2024.
However, in nearly all cases the difference between 2023 and 2025 falls within each dataset’s published uncertainty range, making it effectively a tie between the two years.
The table below shows the reported 2025 global temperature anomalies (relative to each group’s 1850-1900 pre-industrial baseline), as well as a 2025 value using a common pre-industrial baseline between the 1850-1900 and 1981-2010 periods across the five groups with data back to 1850 (NOAA, Hadley/UEA, Berkeley Earth, DCENT and China-MST).
Dataset
2025 Reported
2025 With common baseline
Ranking
NASA GISTEMP
1.39
1.45
Second
Hadley/UEA HadCRUT5
1.41
1.39
Third
NOAA GlobalTemp
1.33
1.41
Third
Berkeley Earth
1.44
1.44
Third
Copernicus ERA5
1.47
1.47
Third
JRA-3Q
1.46
1.46
Third
DCENT
1.53
1.44
Second
China-MST
1.39
1.42
Third
Reported temperature anomalies range from as low as 1.33C (NOAA) to as high as 1.53C (DCENT), primarily reflecting differences in the early part of the record. The 2025 values with a common baseline have a much smaller range, from 1.41C (NOAA) to 1.47C (Copernicus).
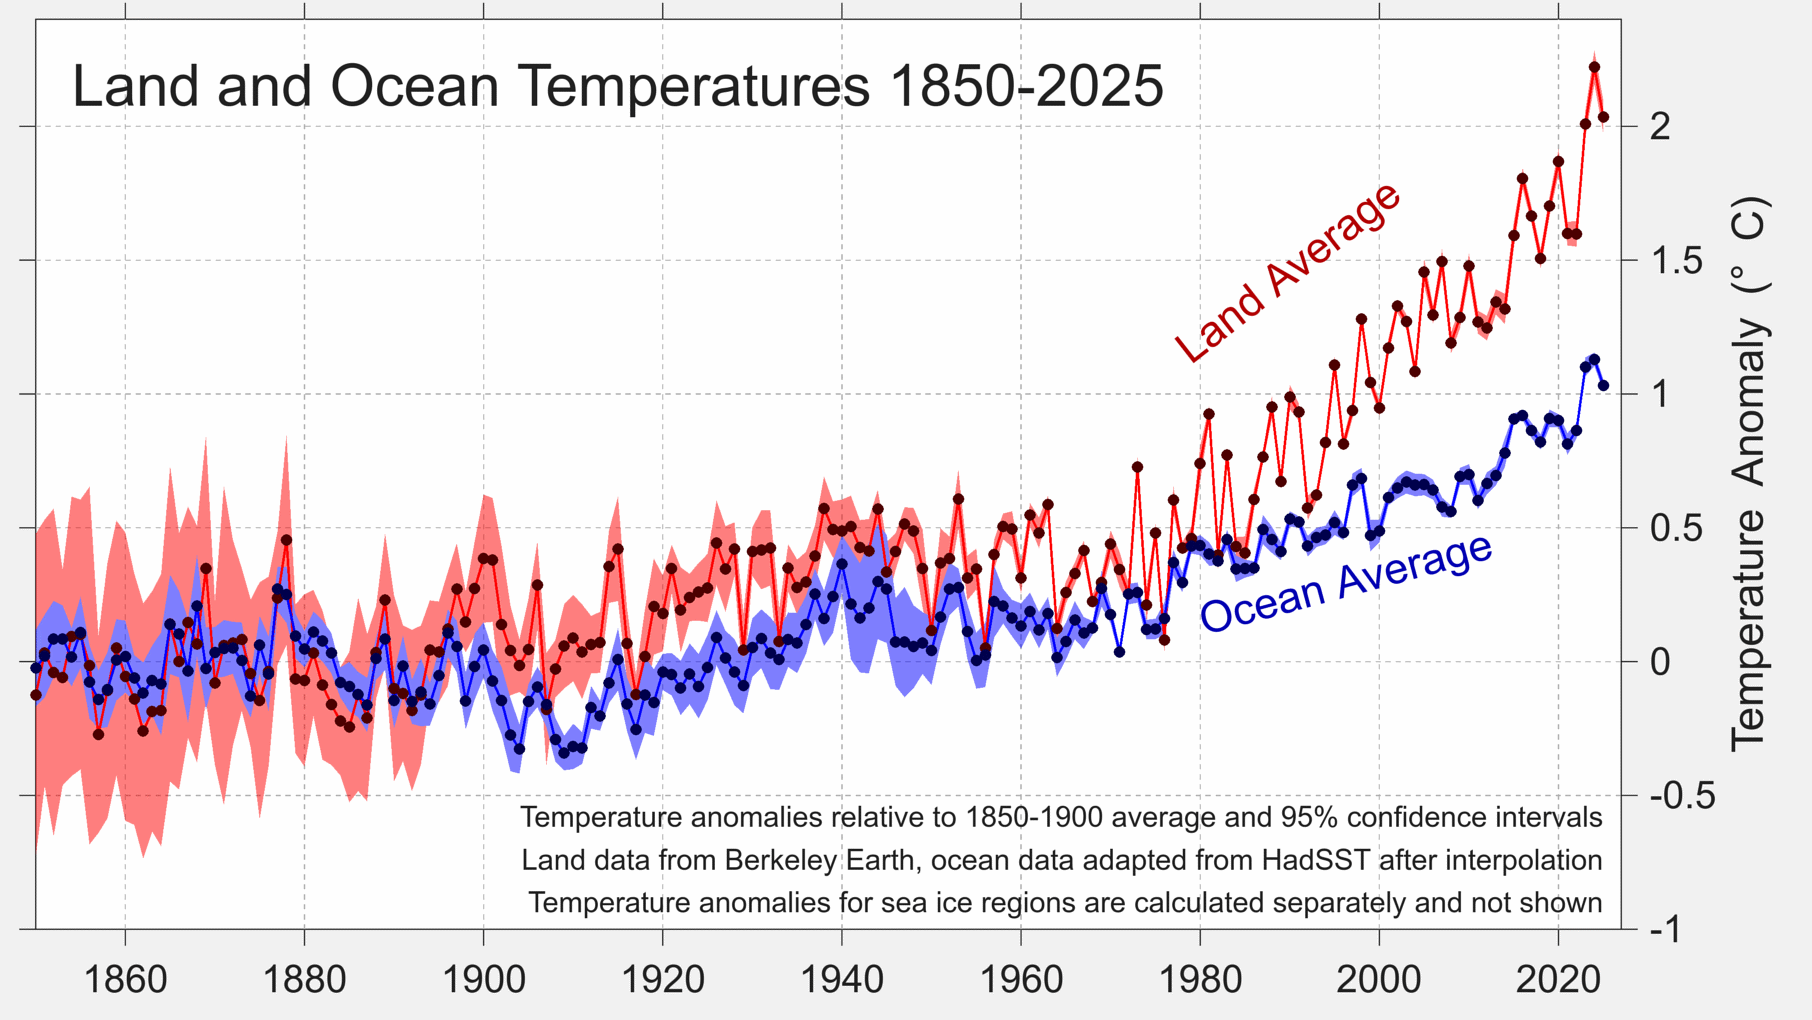
Separate land and ocean temperatures are not available yet from all of these groups. However, Berkeley Earth reports that global land temperatures in 2025 were the second warmest on record, at 2.03C above pre-industrial levels, while ocean temperatures were the third warmest at 1.03C.
Land and ocean temperature rise since the pre-industrial 1850-1900 period. Figure from Berkeley Earth.
Global land regions – where the global human population lives – has generally been warming around 70% faster than the oceans and 40% faster than the global average since 1970.
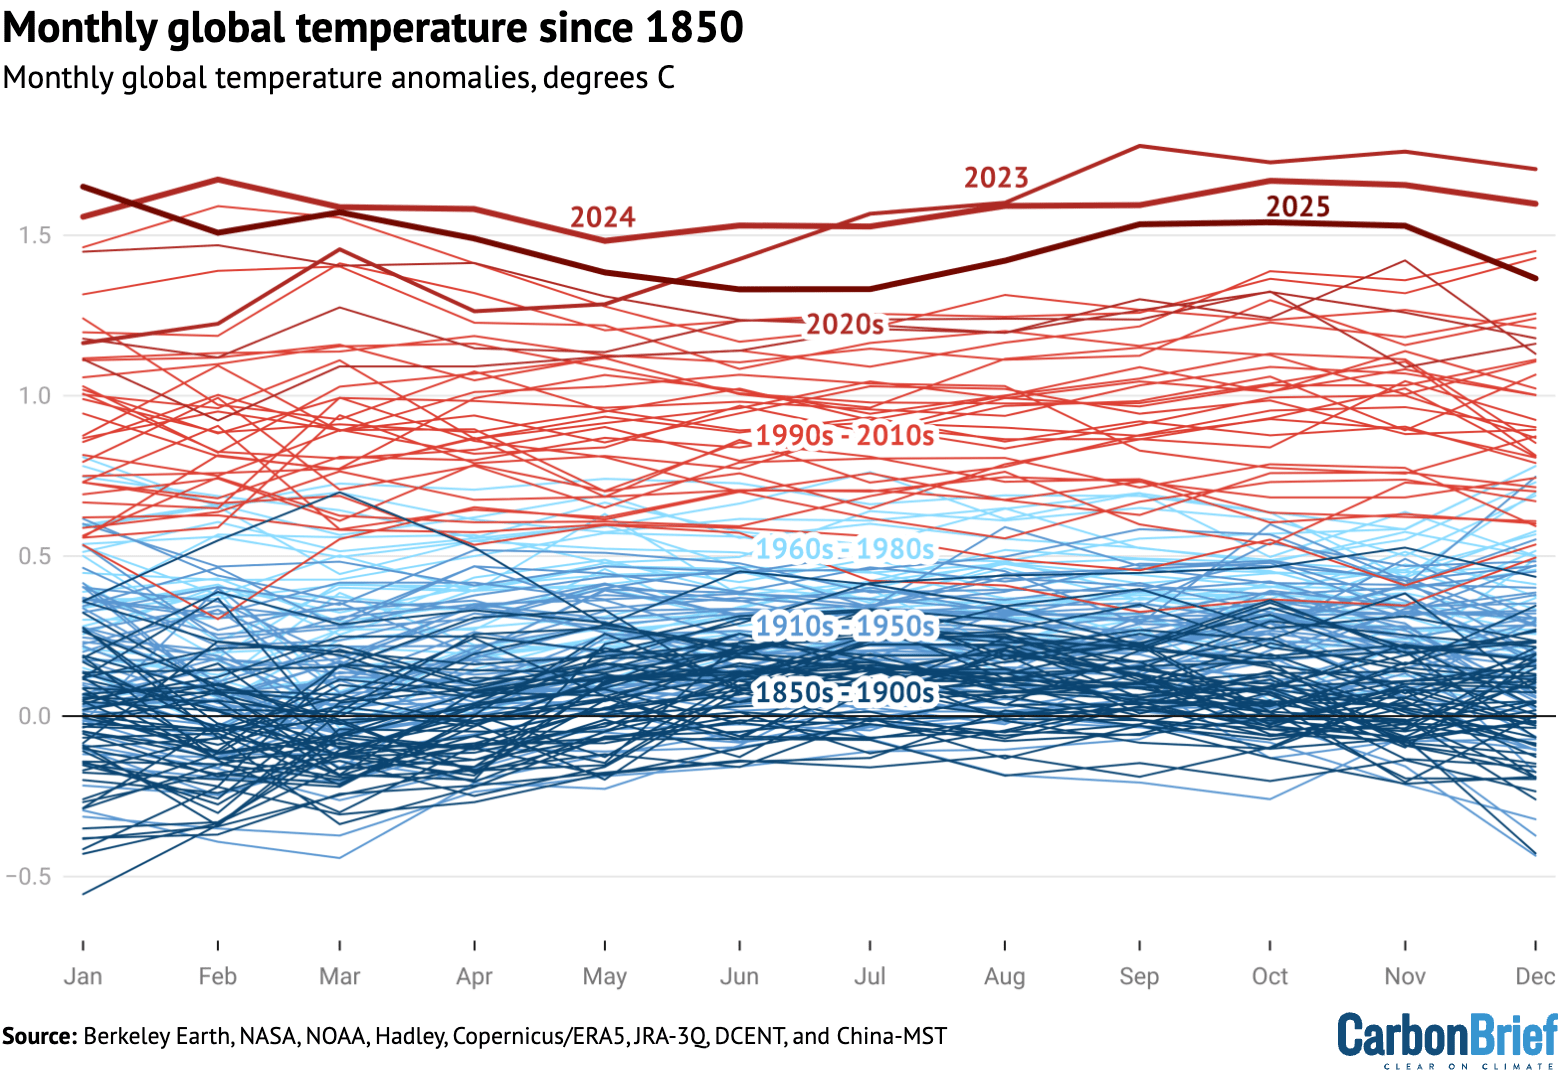
The year started off quite hot, with January 2025 setting a new record as the warmest January. All other months of the year ended up being either the second or third warmest on record after 2024 and 2023.
The figure below shows each month of 2025 in dark red, compared to all prior years since 1850. Each year is coloured based on the decade in which it occurred, with the clear warming over time visible, as well as the margin by which both 2023, 2024 and 2025 exceeded past years.
Monthly global surface temperatures for each year since 1850, using the average of the eight different temperature datasets assessed by Carbon Brief. Anomalies are shown relative to the pre-industrial 1850-1900 period.
Extreme regional temperatures
While the globe as a whole was tied as the second warmest on record, many different regions of the planet set new records in 2025.
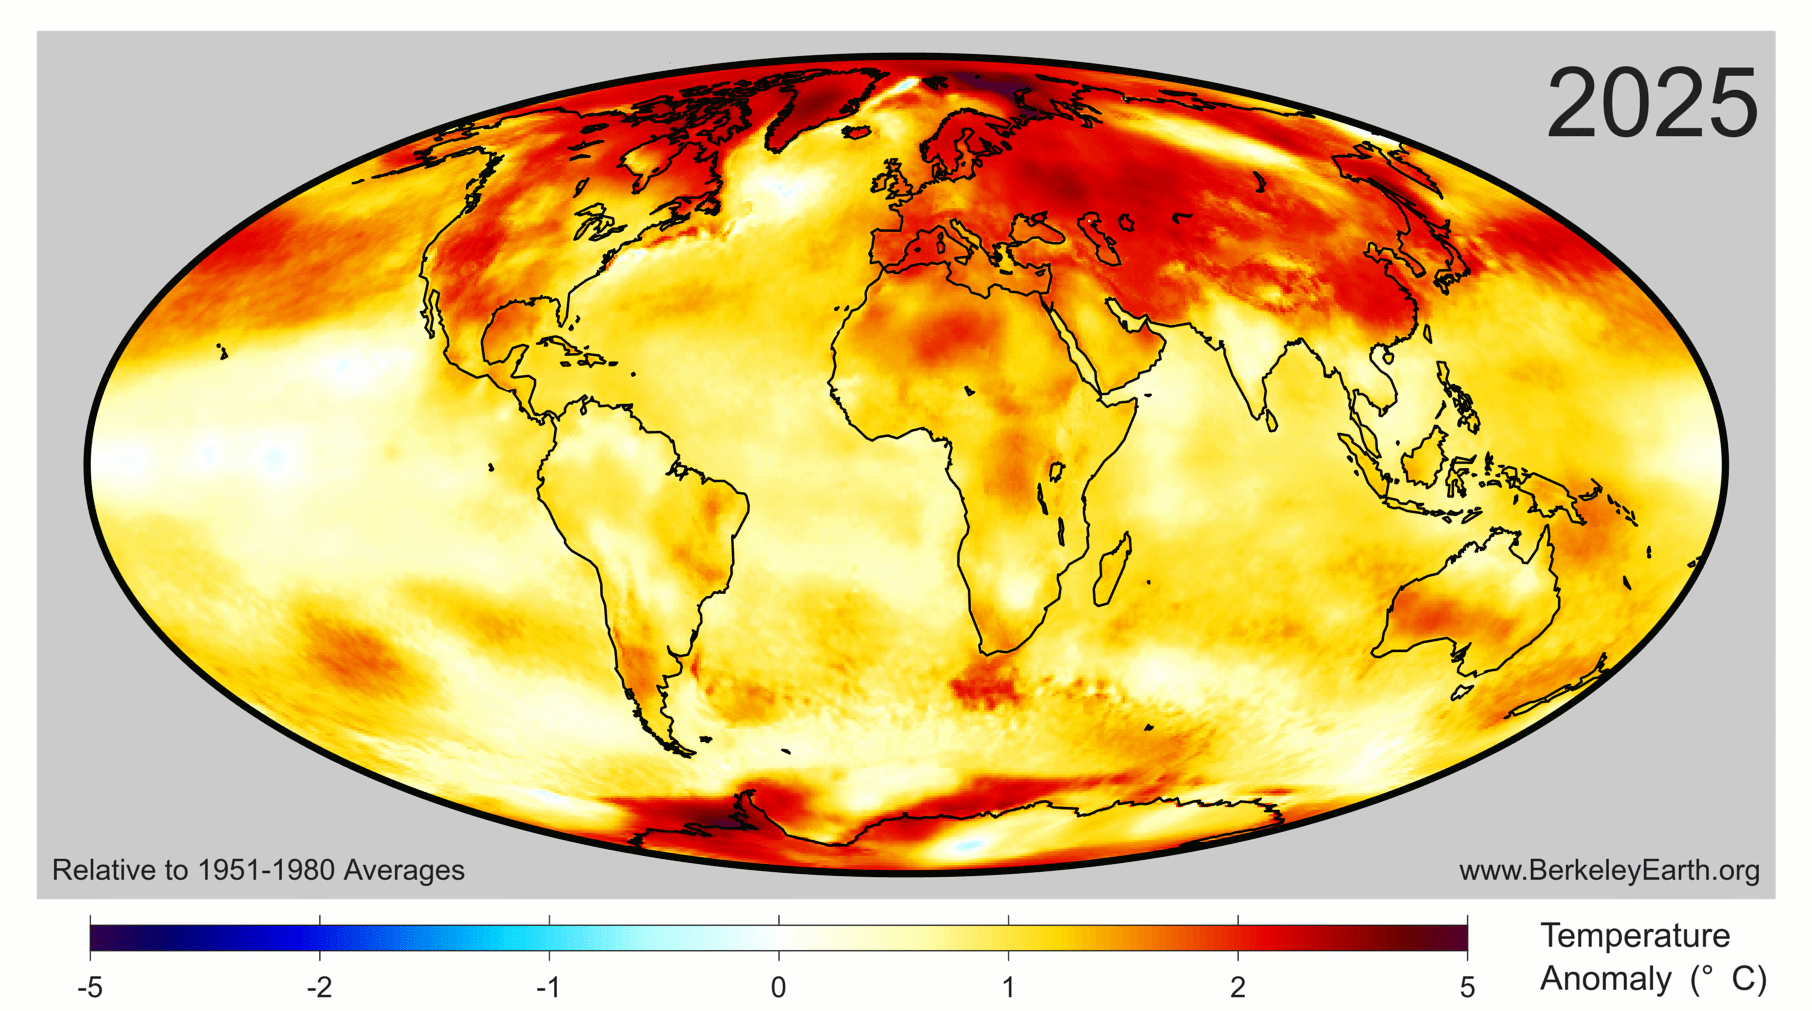
The figure below shows how global temperature deviated from the average in 2025 across the world. Areas shaded in red were warmer than the baseline period (1951-80) used by Berkeley Earth, whereas the few blue areas experienced cooler temperatures.
Collectively, approximately 770 million people – 9.3% of Earth’s population – live in places that experienced their warmest year on record in 2025. This was mostly concentrated in Asia, including around 450 million people in China.
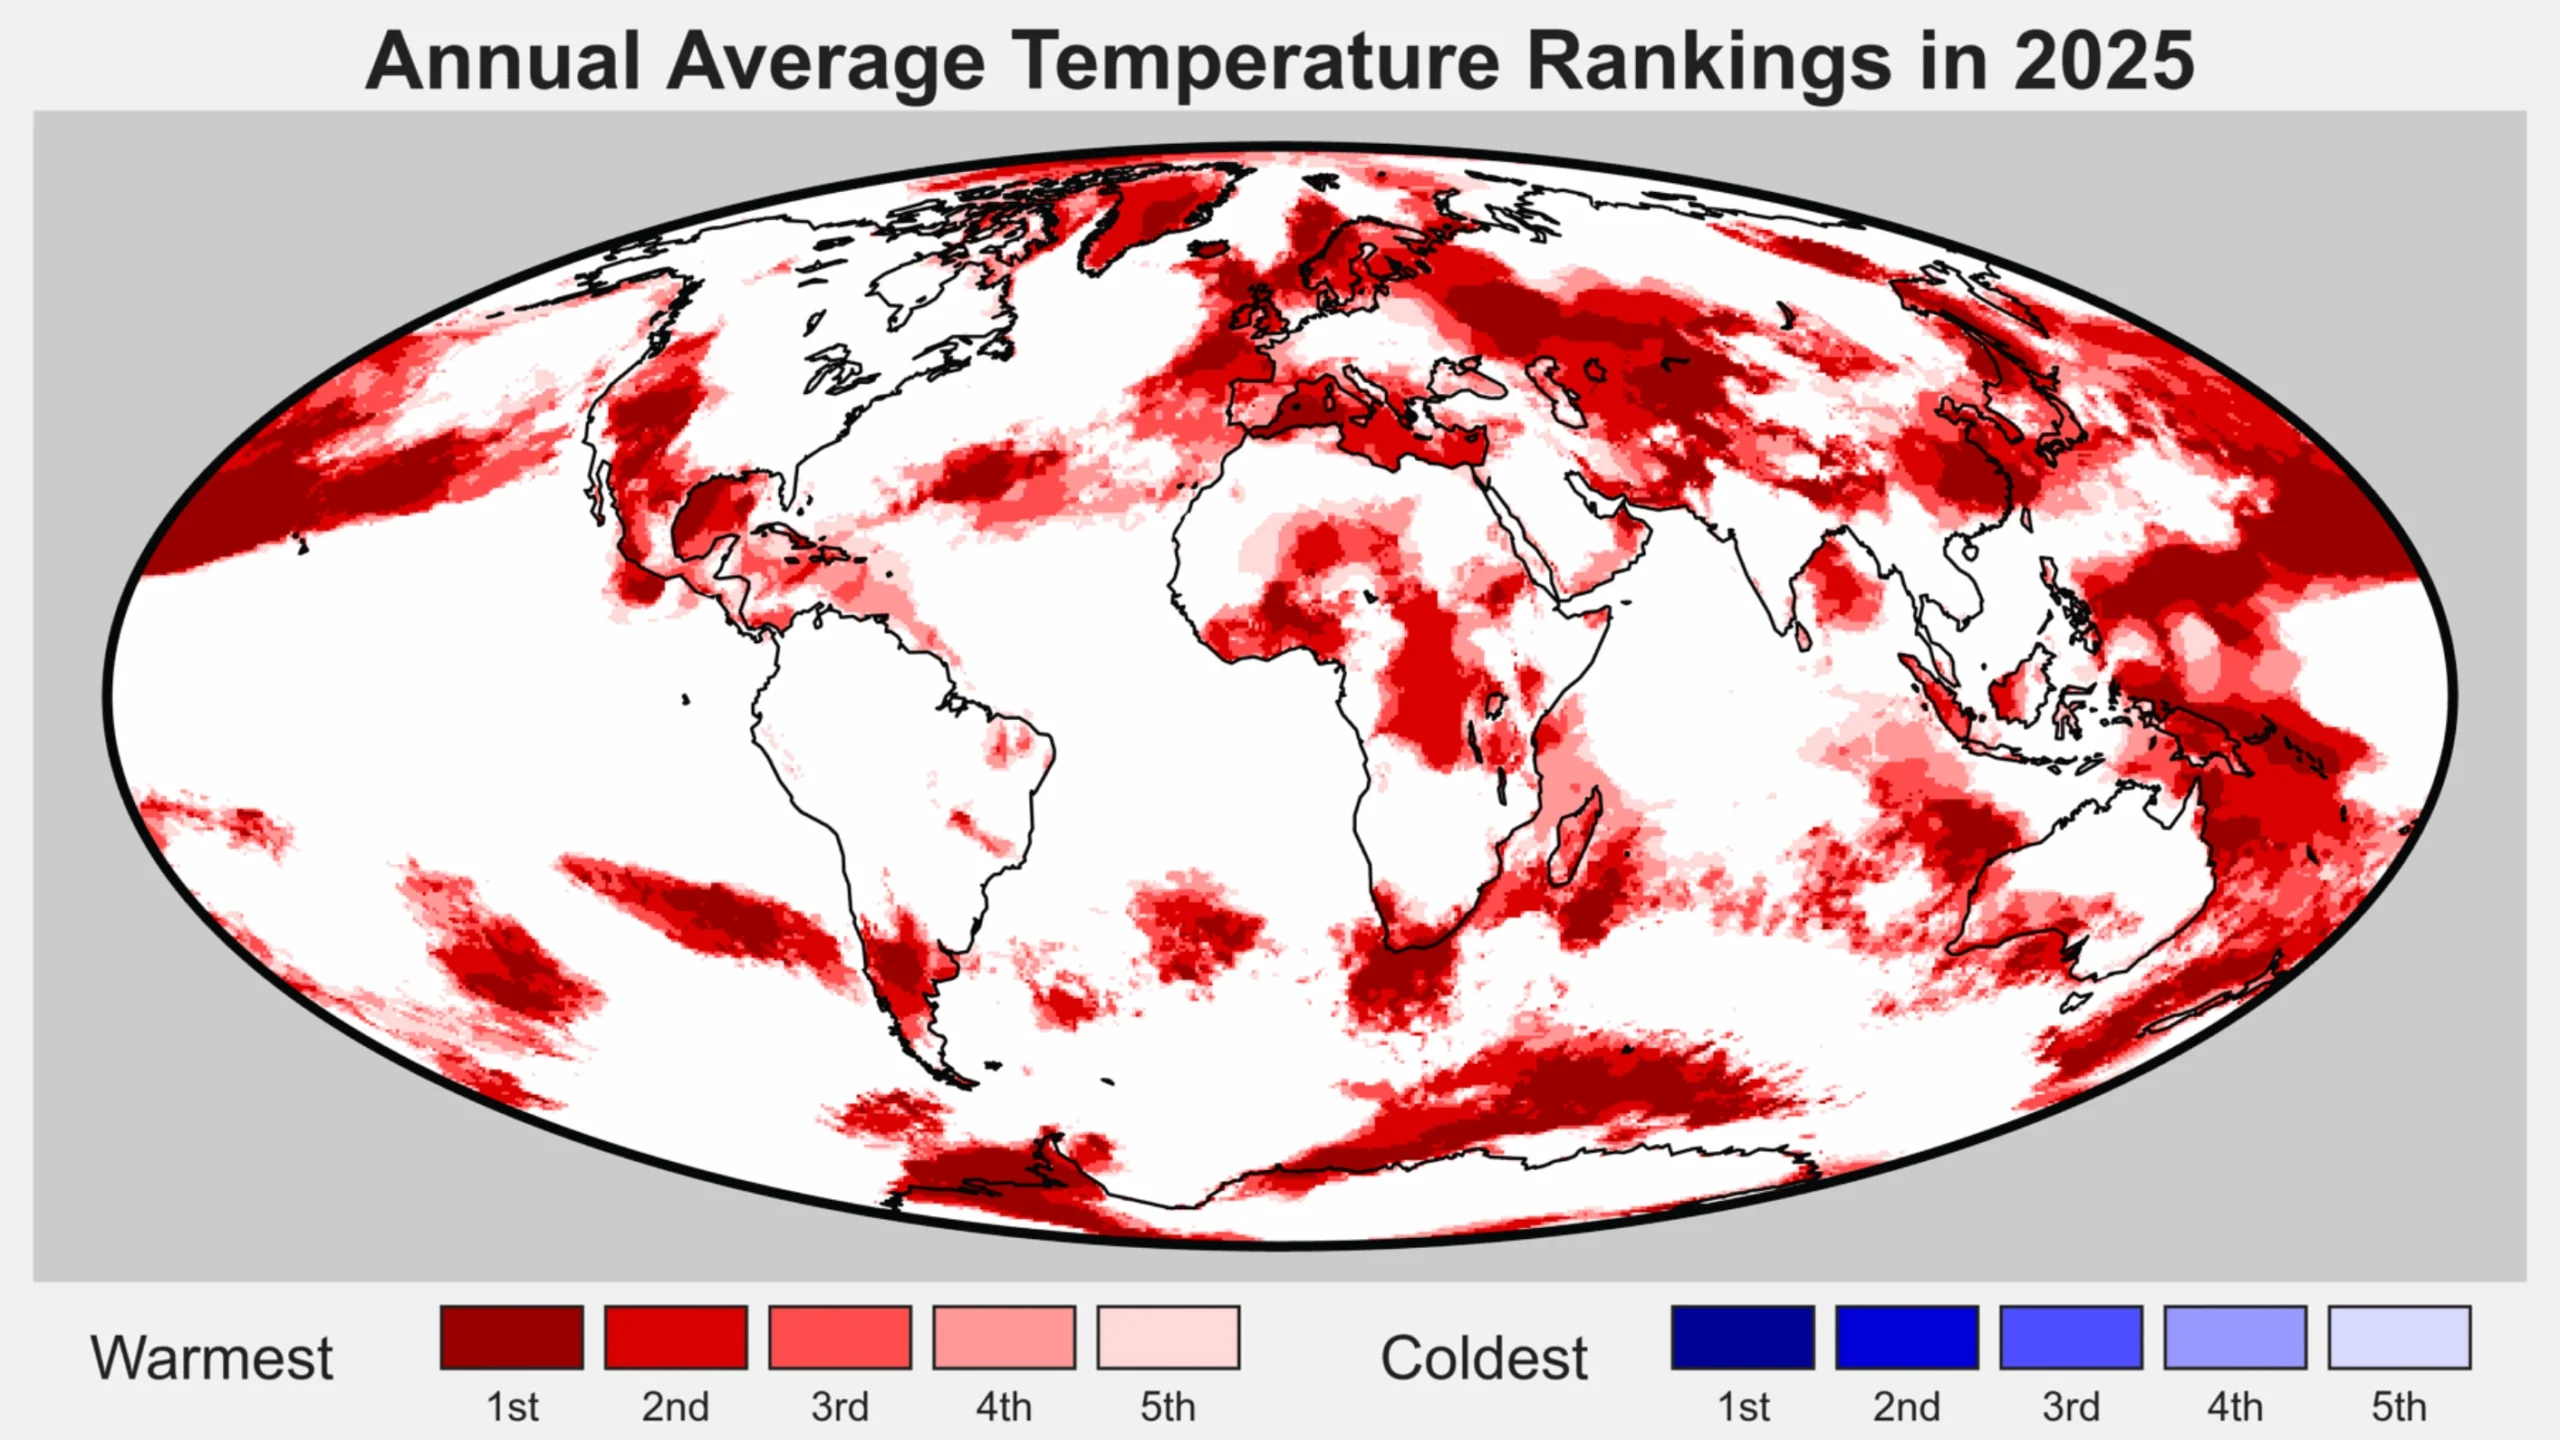
The figure below highlights regions of the planet that experienced their top-five warmest (red shading) or coldest (blue) temperatures on record in 2025. Overall, around 9% of the planet set a new record, including 11% of the land and 8% of the ocean. No location on the planet experienced record cold temperatures – or even top-five record cold temperatures – for the year as a whole.
Regions of the world among the five warmest (reds) of five coolest (blues) on record for average annual temperatures in 2025. Figure from Berkeley Earth.
Drivers of recent record warmth
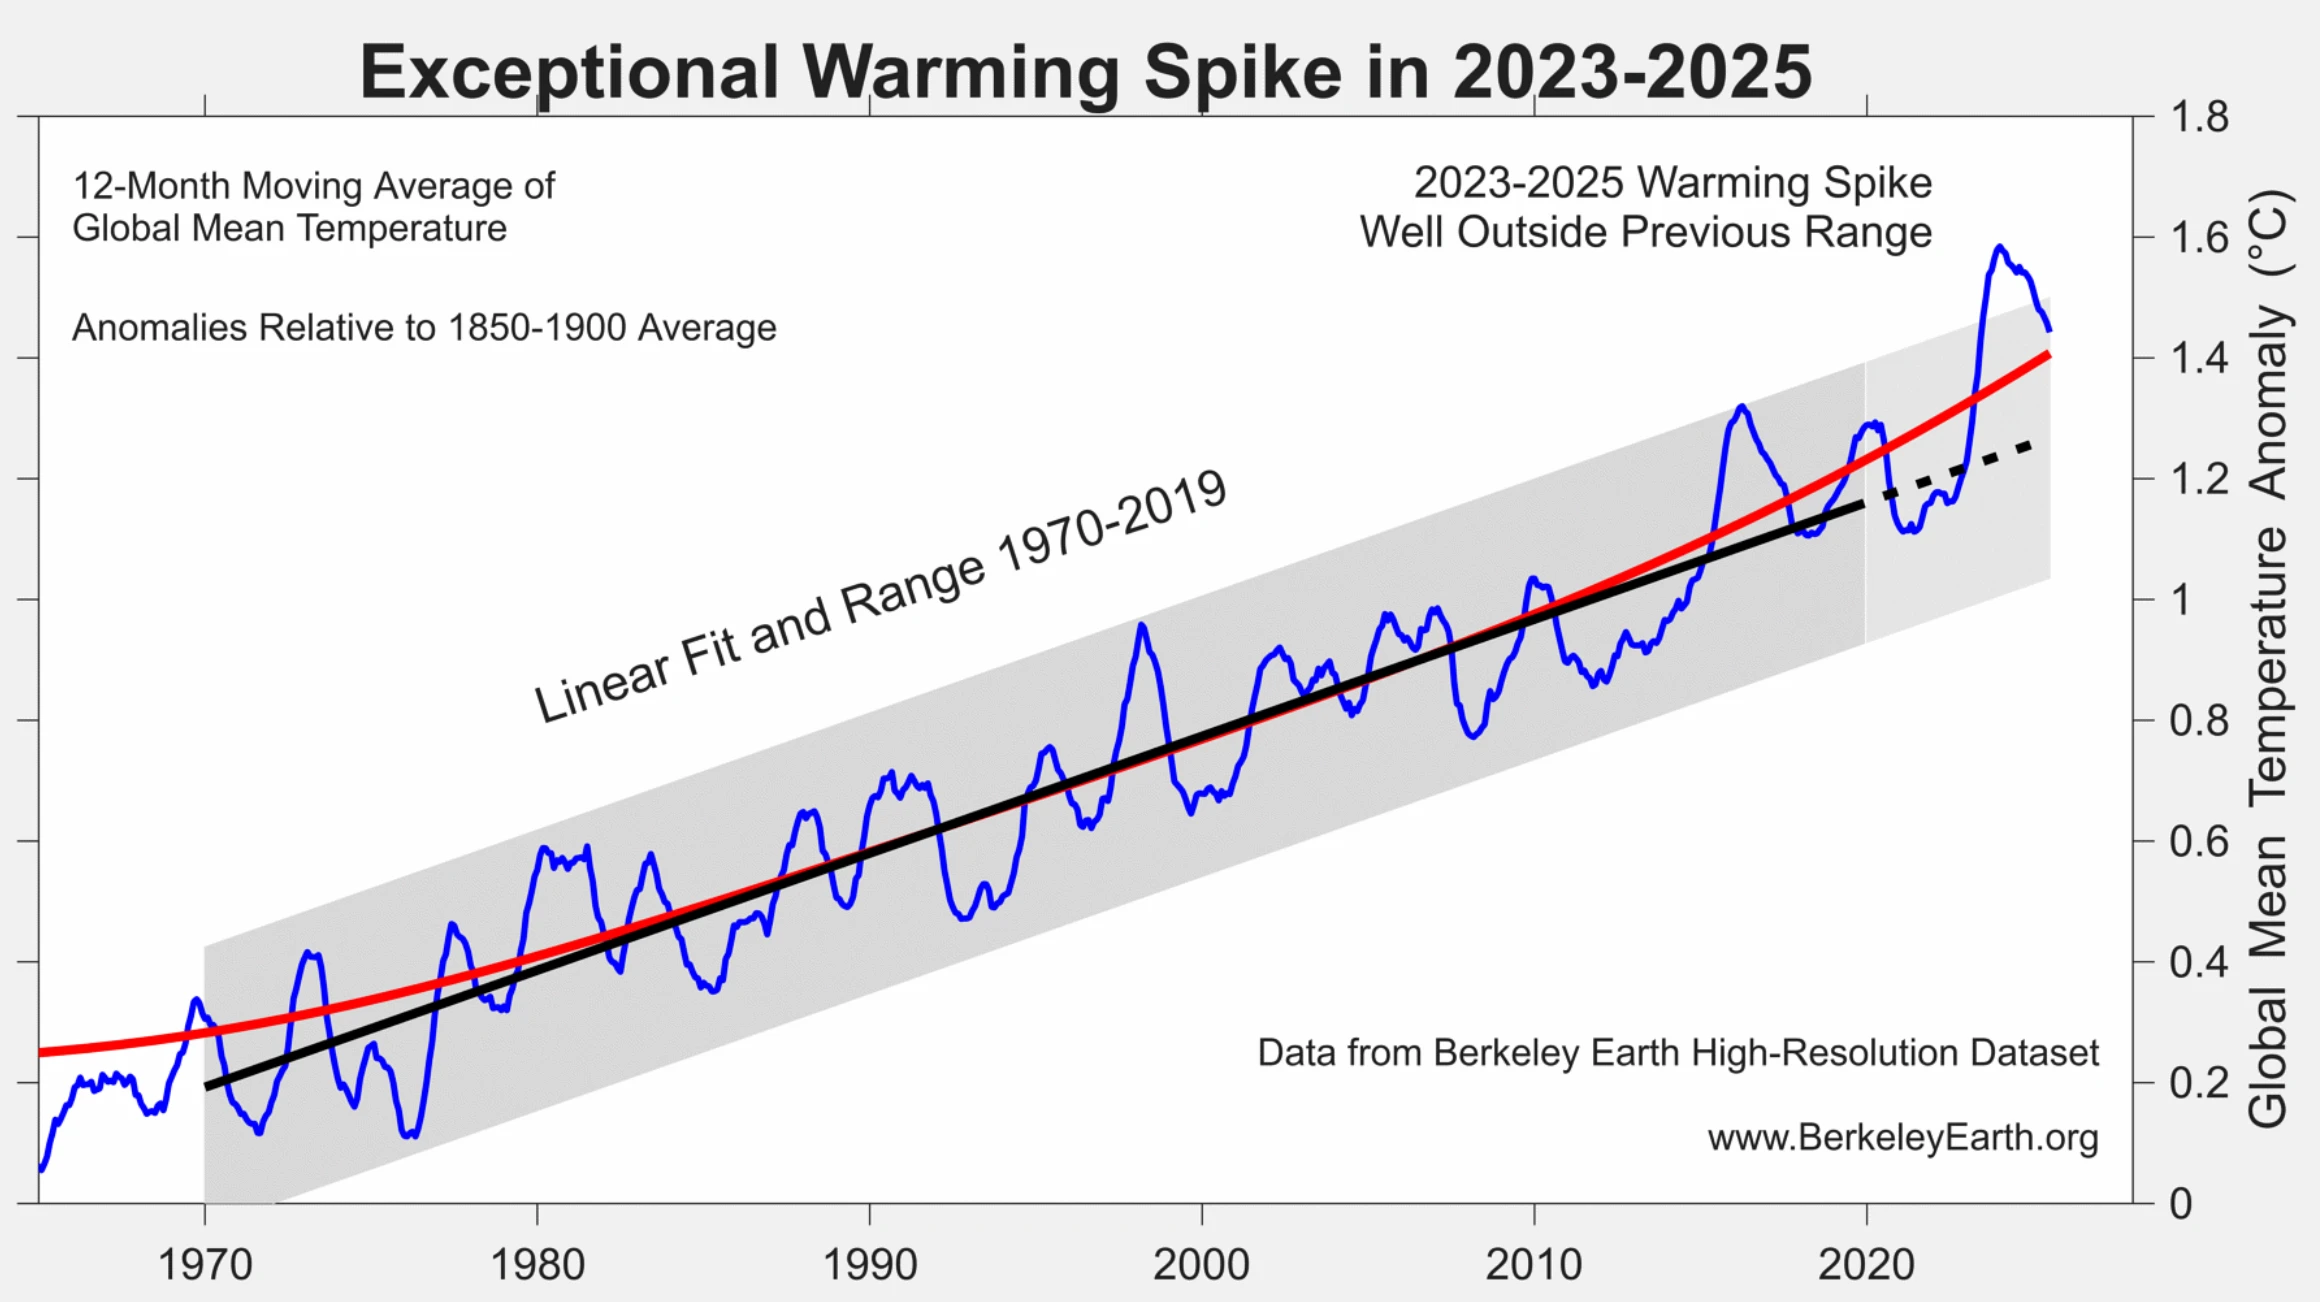
Global temperatures over the past three years have been unusually warm, well above what would be expected given the long-term warming trend of around 0.2C per decade since the 1970s.
Recent research has found that global warming has accelerated in recent years to around 0.27C per decade, though this acceleration is largely in-line with climate model projections under scenarios where greenhouse gas emissions continue to rise while emissions of planet cooling aerosols are reduced.
According to analysis from Berkeley Earth, the odds of global temperatures over 2023-25 occurring as a result of greenhouse gas emissions and natural variations in the Earth’s climate alone “is less than one-in-100” and “likely indicates that recent years have been impacted by additional warming factor(s)”.
The figure below shows how the exceptional warming spike of 2023-25 compares to the longer-term warming trend and historical climate variability.
Global surface temperatures between 1965 and 2025 (blue) along with the linear trend (black) and range (grey) from 1970-2019. The red line shows a locally linear regression that captures recent acceleration. Figure from Berkeley Earth.
Carbon Brief recently explored the drivers of recent warmth in more detail, finding that it is likely to have been driven by a combination of:
A strong El Niño event that developed in the latter part of 2023.
An unusual volcanic eruption in Tonga in 2022 that put a large amount of aerosols and water vapor into the upper atmosphere.
A stronger-than-expected solar cycle.
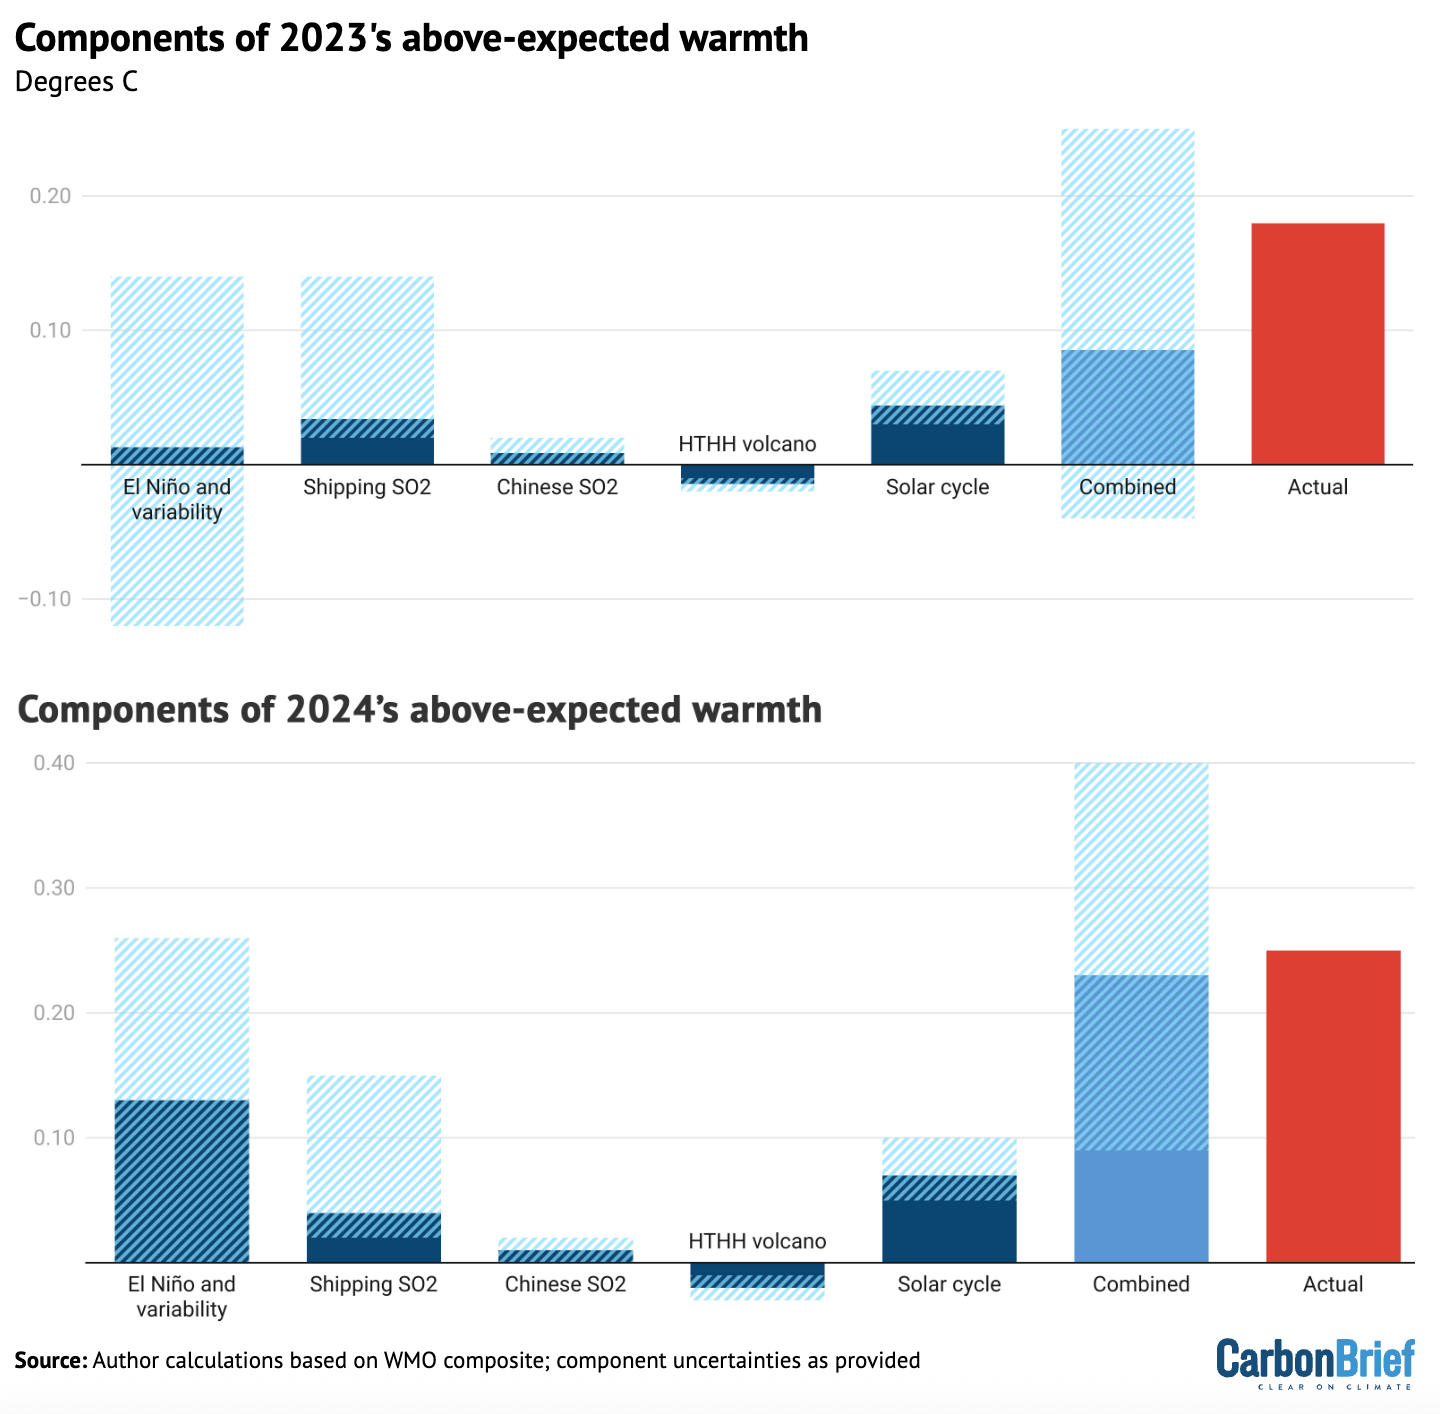
This is illustrated in the figure below, which provides an estimate of the impact of each of these different factors on 2023 and 2024 temperatures, along with their respective uncertainties.
The sum of all the factors is shown in the “combined” bar, while the actual warming compared to expectations is shown in red. The upper chart shows 2023, while the lower one shows 2024.
Attribution of 2023 and 2024 unusual warmth. Light blue bars show individual factors and their uncertainties, the dark blue bar shows the combined effects and combination of uncertainties and the red bar shows the actual warming compared with expectations. HTHH refers to the Hunga Tonga-Hunga Ha’apai volcano. Adapted from Figure 12 in WMO’s state of the global climate 2024 report.
The first bar includes both El Niño and natural year-to-year climate variability; the height of the bar reflects the best estimate of El Niño’s effects, while the uncertainty range encompasses year-to-year variability in global temperatures that may be – at least in part – unrelated to El Niño.
While a similar analysis has yet to be undertaken for 2025, the end of El Nino conditions and the development of a modest La Nina would have driven temperatures down, while the warming impact of shipping, Chinese aerosol declines would have slightly increased. The warming effect of the solar cycle would likely have remained flat or slightly declined as solar cycle 25 passed its peak.
Finally, a World Meteorological Organization (WMO) assessment of the Hunga Tonga-Hunga Ha’apai volcano found that “the record-high global surface temperatures in 2023-24 were not due to the Hunga eruption”.
The report suggested that the volcano had a small cooling effect (-0.03C) globally in 2023 and 2024. This might switch to a small warming effect (+0.03C) in 2025 and 2026 as the planet-cooling aerosols from the volcano fall back down to the surface but some of the stratospheric water vapour remains, it noted.
However, it added, these effects are “indistinguishable from background variability in the current climate”.
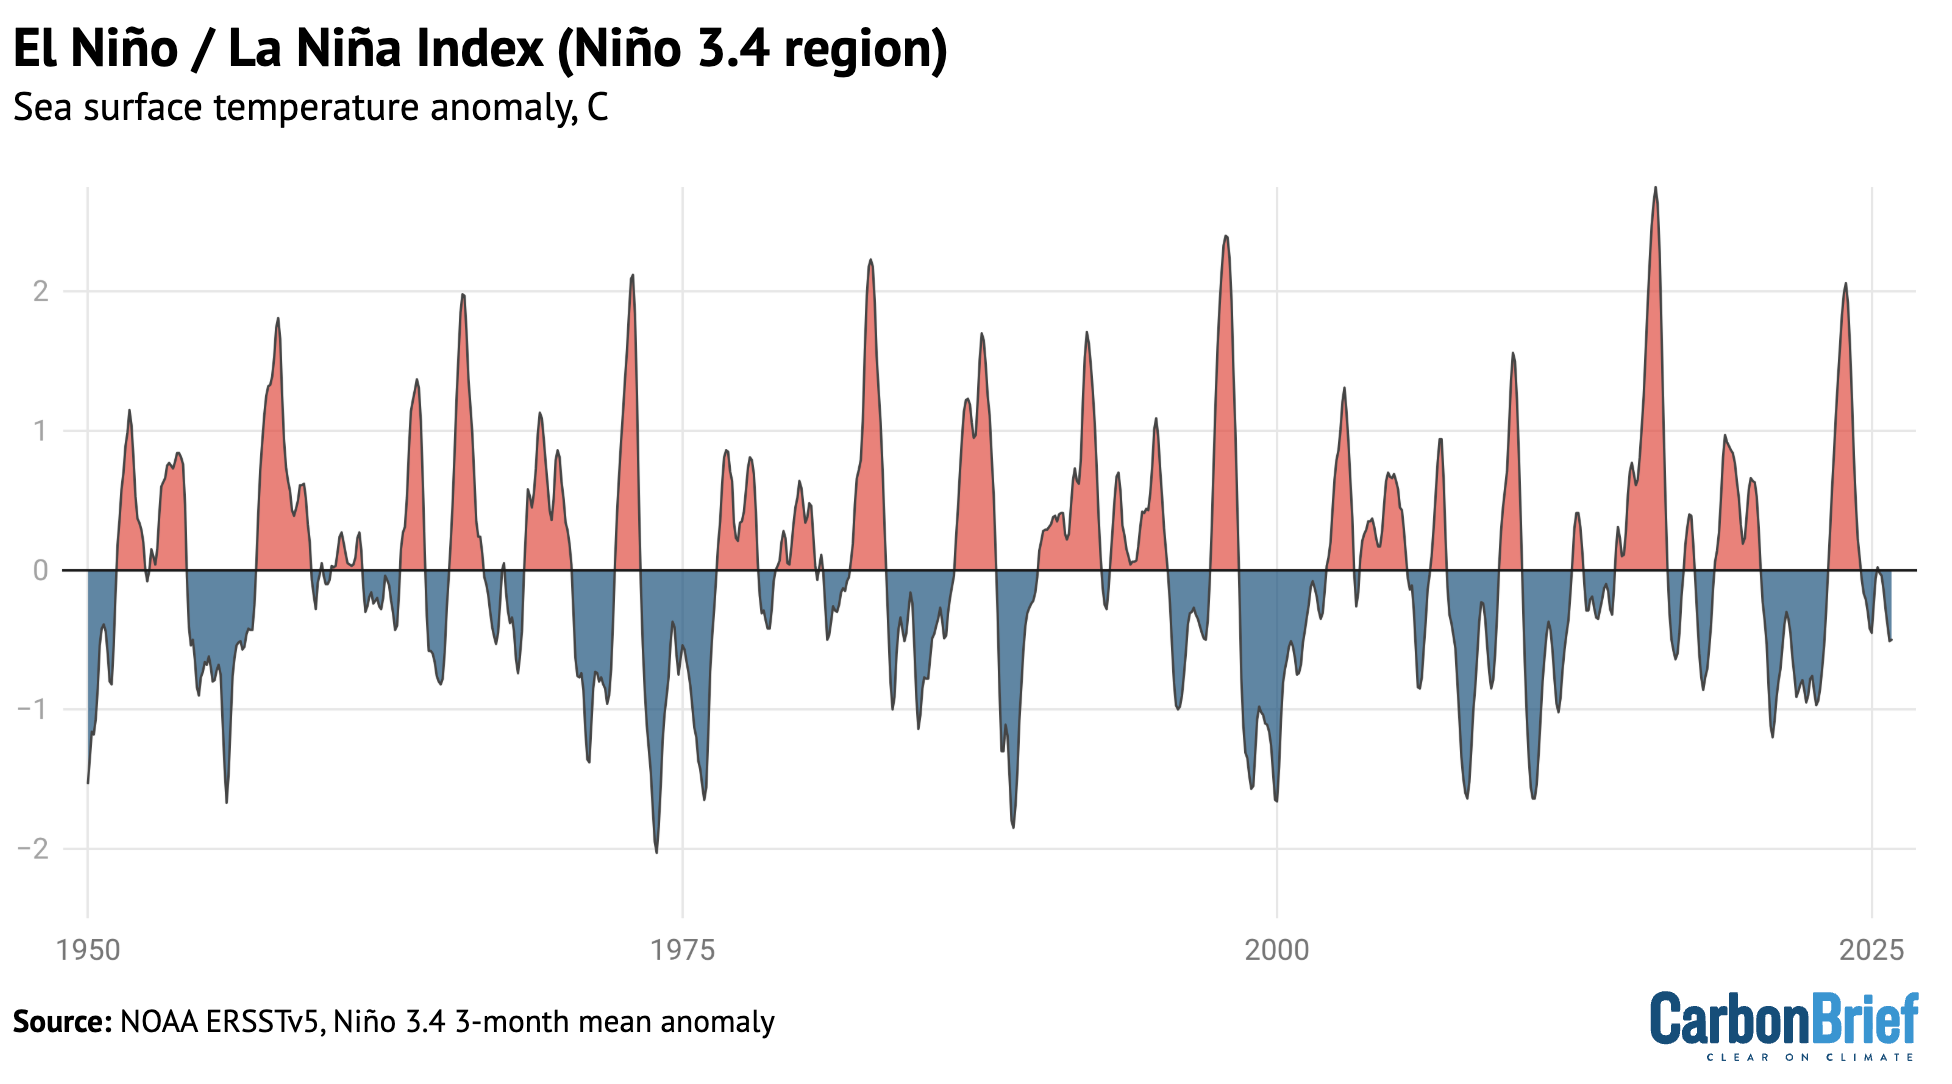
El Niño and La Niña are generally the largest drivers of year-to-year variability in global temperatures. The figure below shows the El Niño (red shading) and La Niña (blue) conditions over the past 40 years (collectively referred to as the El Niño-Southern Oscillation, or “ENSO”).
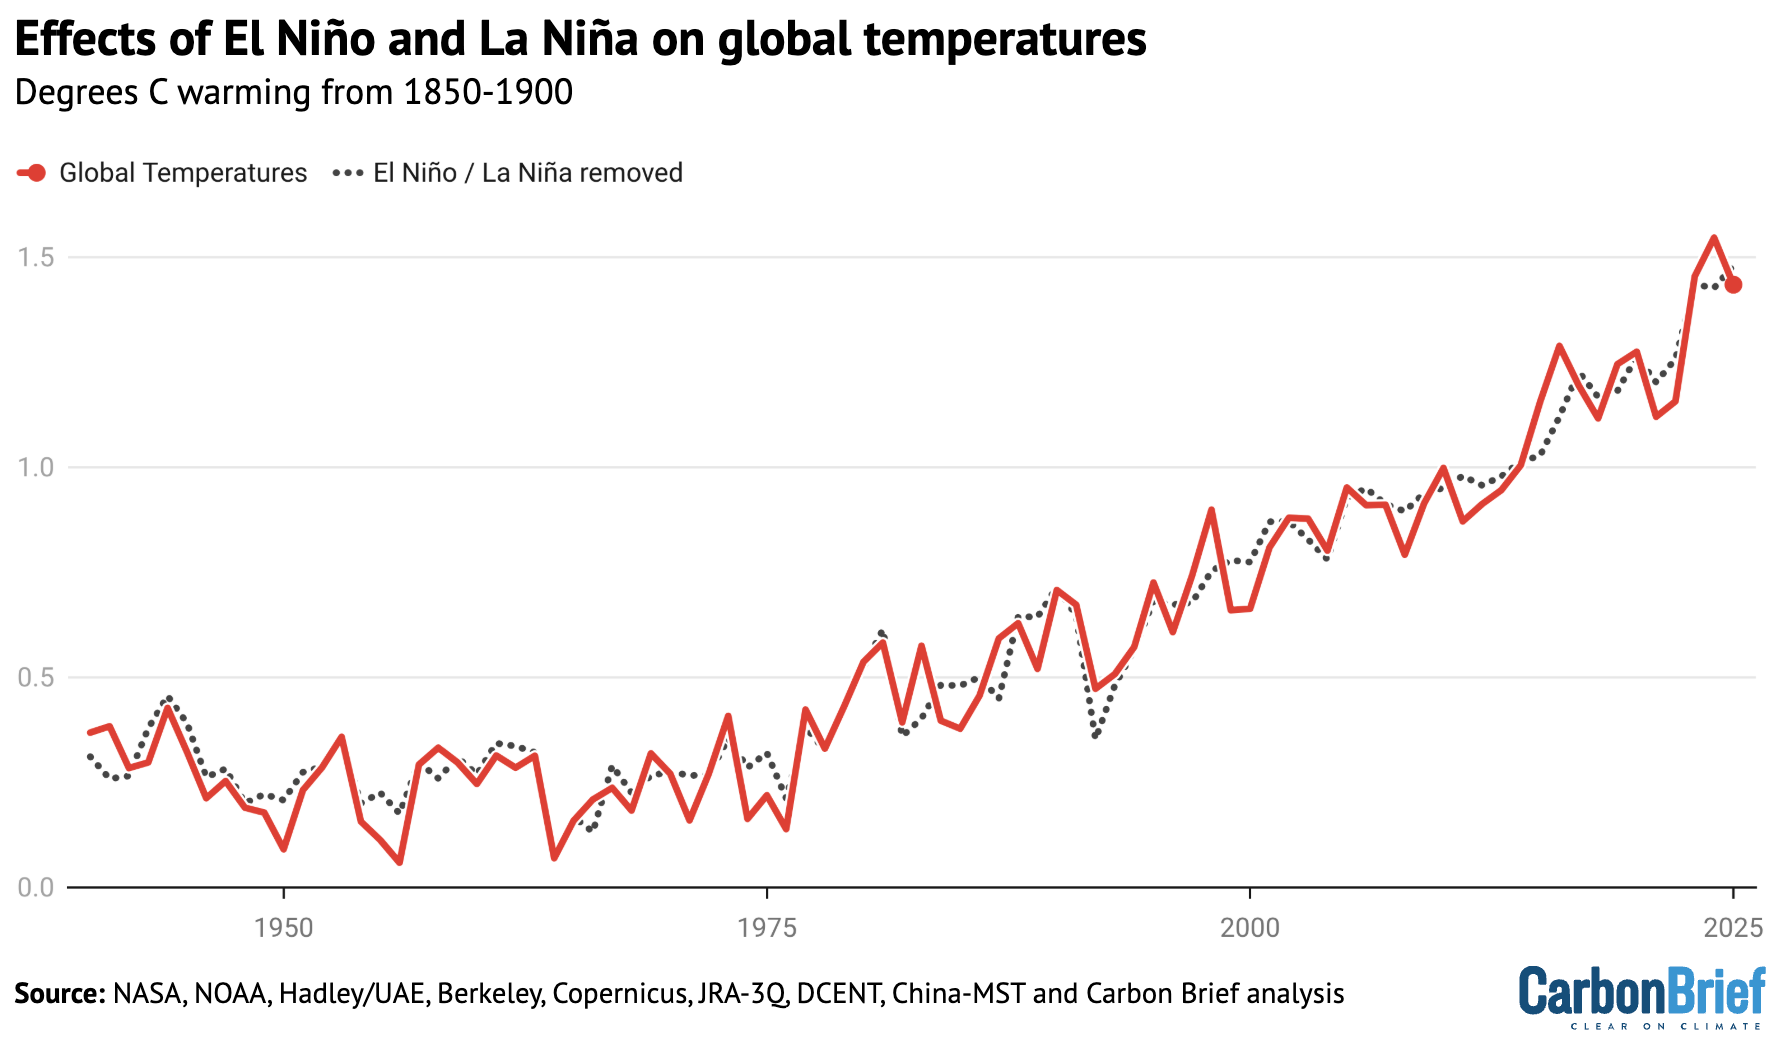
Carbon Brief has used the historical relationship between ENSO conditions and temperature to effectively remove the effects of El Niño and La Niña events from global temperatures, as shown in the figure below.
This analysis indicates that El Niño cooled global temperatures in 2025 around -0.05C, following a boost to global temperatures of around 0.12C in 2024, compared to the estimate of global temperatures with both El Niño and La Niña events removed.
Annual global average surface temperatures from the average of the eight datasets, as well as Carbon Brief’s estimate of global temperatures with the effect of El Niño and La Niña (ENSO) events removed using the Foster and Rahmstorf (2011) approach. Chart by Carbon Brief.
This suggests that the shift from El Nino to La Nina conditions can fully explain the decline in global temperatures between 2024 and 2025 and that 2025 would have likely been the warmest year in the observational record if it had not been for the effects of ENSO.
Scientists provided estimates of where they expected 2025 temperatures to end up at the start of the year.
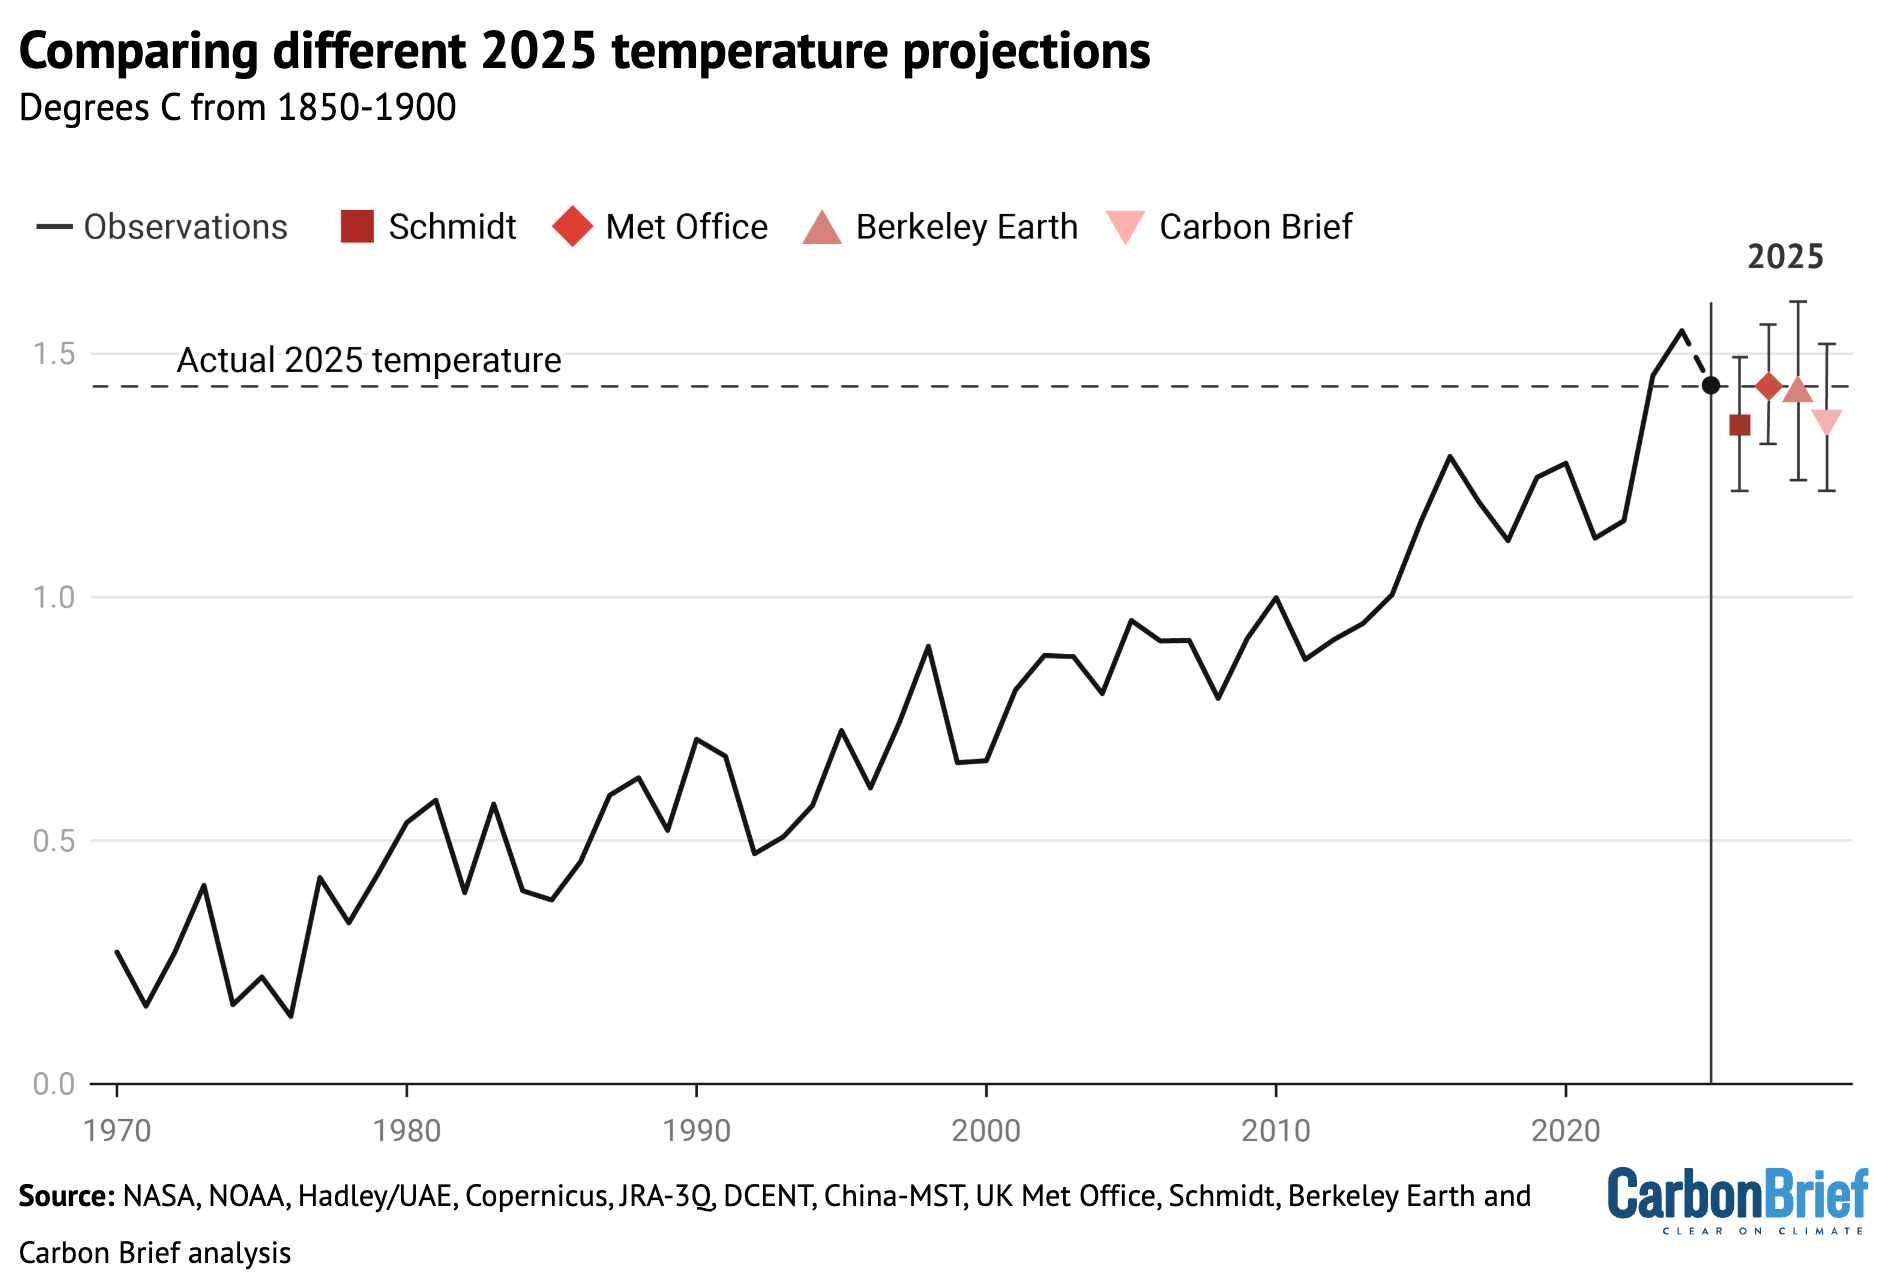
The figure below shows estimates by four different groups that provided temperature predictions for the year prior to any data being collected – the Met Office, NASA’s Dr Gavin Schmidt, Berkeley Earth and Carbon Brief’s own estimate — compared to what actually transpired.
Temperature predictions for 2025 from UK Met Office, NASA’s Dr Gavin Schmidt, Berkeley Earth and Carbon Brief’s estimate relative to pre-industrial (1850-1900) temperatures and compared to the historical average of the eight observational datasets. Chart by Carbon Brief.
Unlike in 2023 –and, to a lesser extent, 2024 –when start-of-year predictions were notably low, 2025 fell reasonably in-line with what was expected. The Met Office estimate was nearly exactly on target, with Berkeley Earth’s being close as well. Carbon Brief and Schmidt’s estimates were a little on the low side, but actual temperatures were well within the estimated error bars.
Observations in-line with climate model projections
Climate models provide physics-based estimates of future warming given different assumptions about future emissions, greenhouse gas concentrations and other climate-influencing factors.
Here, Carbon Brief examines a collection of climate models – known as CMIP6 – used in the 2021 science report of the IPCC’s sixth assessment.
In CMIP6, model estimates of temperatures prior to 2015 are a “hindcast” using known past climate influences, while temperatures projected from 2015 onward are a “forecast” based on an estimate of how things might change.
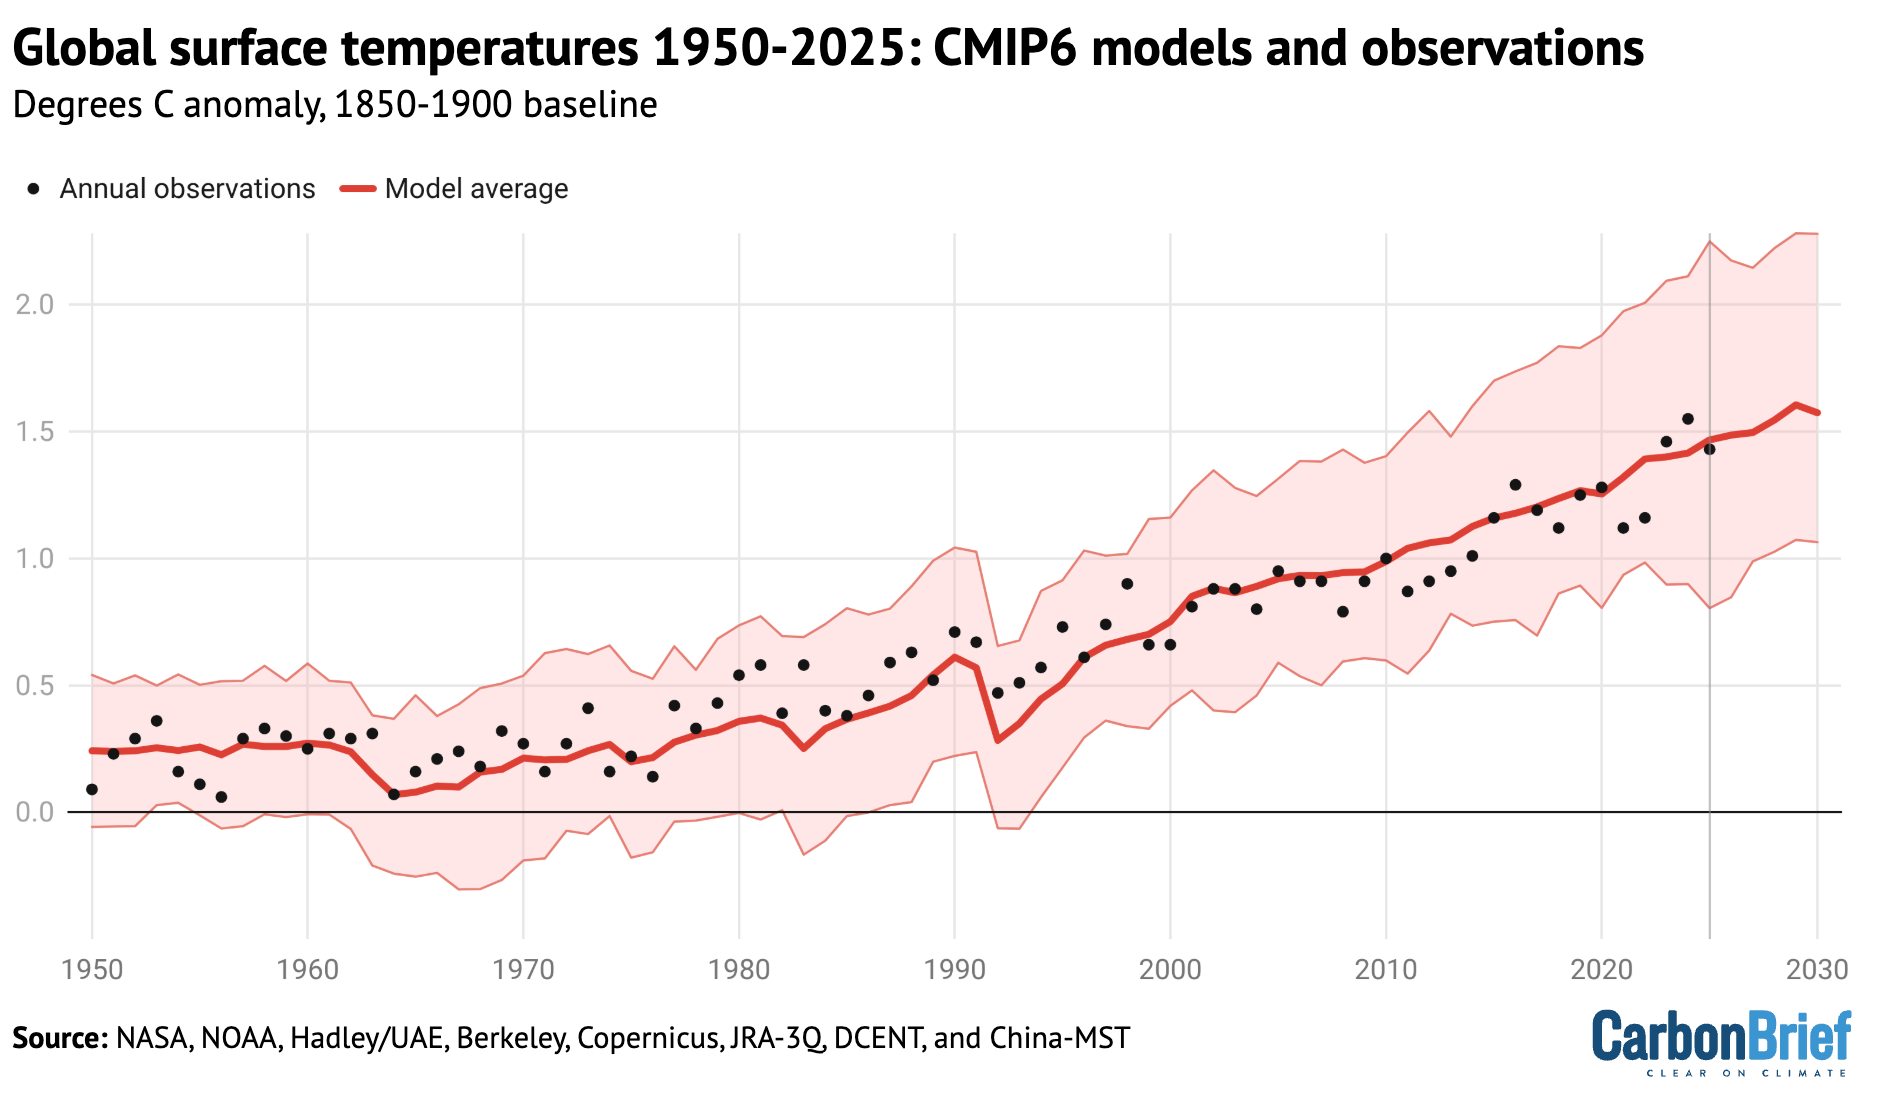
The figure below shows how observations compare to the full ensemble of 37 CMIP6 models under the middle-of-the-road SSP2-4.5 emissions scenario for future projections. The red line represents the average of all the models and the red areas showing the 5th to 95th percentile range. The average of the eight observational temperature datasets are plotted as dots on top of the climate model data.
The chart illustrates how observations have generally been a bit below the model average over the past two decades, were slightly above model average in 2024 and are more or less dead on in 2025.
Annual global average surface temperatures from CMIP6 models and observations between 1950 and 2030 (through 2025 for observations). Models use the SSP2-4.5 scenario after 2015. Anomalies plotted with respect to a 1850-1900 baseline. Chart by Carbon Brief.
However, the ensemble of CMIP6 models differs from the main projection of future warming in the recent IPCC AR6 report. A subset of CMIP6 models have unrealistically high climate sensitivity and they reproduce historical observations poorly.
To account for this, rather than simply averaging all the models – as had been done in prior assessments – the IPCC employed an approach that effectively weights models by their performance. As a result, the models align better with the range of climate sensitivity derived from multiple different lines of evidence.
The chart below shows the assessed warming projections from the IPCC AR6 report in red, with historical observations since 1850 as black dots.
Annual global average surface temperatures from the average of eight datasets (black dots) along the 30-year LOWESS fit (red line), combined the AR6 assessed warming projection for SSP2-4.5 as published and without any baseline alignment. Chart by Carbon Brief.
The chart reveals that observed global surface temperatures (black dots) are further above the modeled central estimate 2023-25, but generally remain within the IPCC assessed range.
Climate models broadly expect an acceleration of warming in the current period in a scenario like SSP2-4.5 where emissions of CO2 and other greenhouse gases continue to modestly increase, but emissions of planet-cooling aerosols like sulphur dioxide are rapidly reduced.
Second-warmest atmospheric temperatures
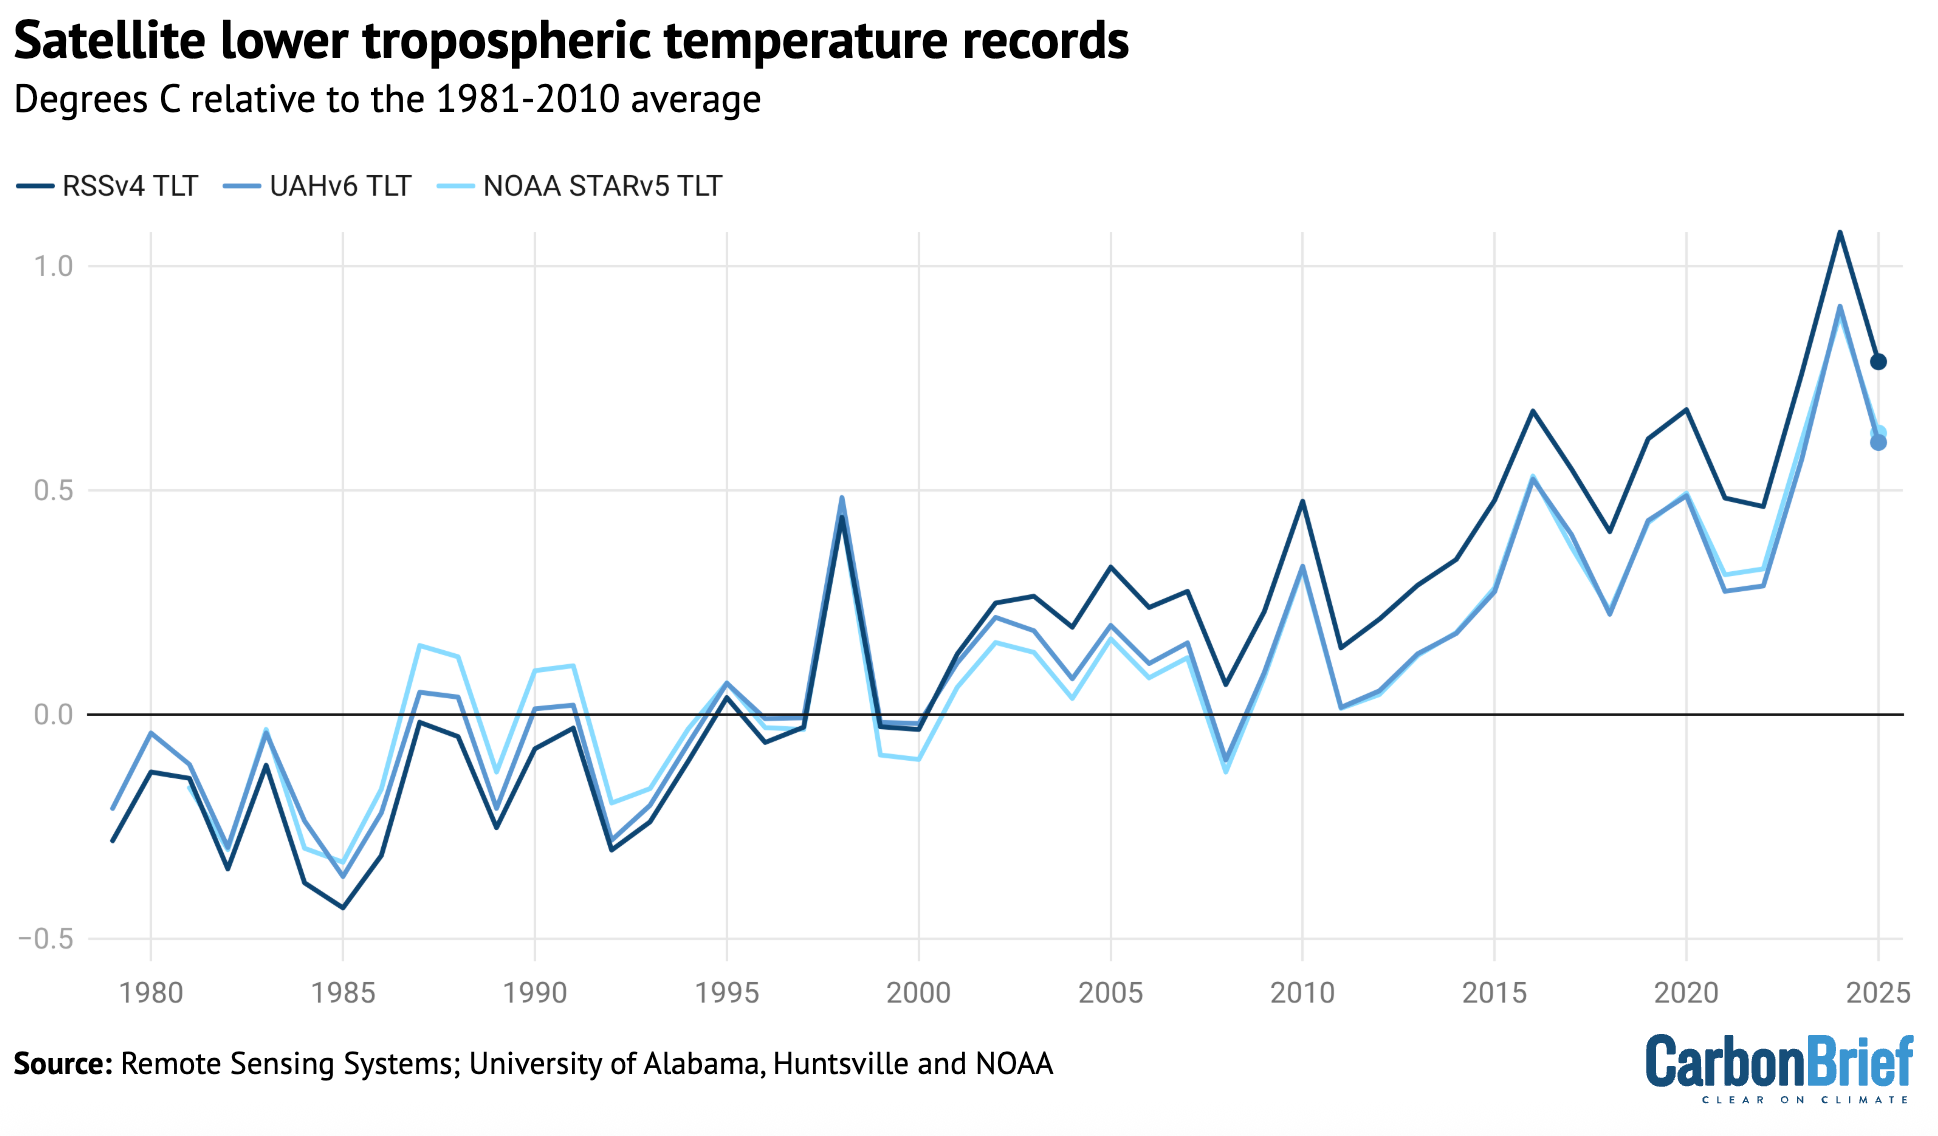
In addition to surface measurements over the world’s land and oceans, satellite microwave sounding units have been providing estimates of temperatures at various layers of the atmosphere since 1979.
The lowest layer of the atmosphere that satellite microwave units provide temperature estimates for is the lower troposphere. This data reflects temperatures a few kilometres above the Earth’s surface. It reveals a pattern of warming in the lowest troposphere that is similar – though not identical – to surface temperature changes.
The records produced by Remote Sensing Systems (RSS), the University of Alabama, Huntsville (UAH) and NOAA show 2025 as the second warmest year on record in the lower troposphere, after 2024. The chart below shows the three records for the lower troposphere, using a more recent baseline period (1981-2010) given the absence of satellite data before 1979.
Global average lower-troposphere temperatures from RSS version 4 (dark blue), UAH version 6 (mid-blue) and NOAA STAR version 5 (light blue) for the period from 1979-2025, relative to a 1981-2010 baseline. Chart by Carbon Brief.
The lower troposphere tends to be influenced more strongly by El Niño and La Niña events than the surface. Therefore, satellite records show correspondingly larger warming or cooling spikes during these events. This explains why there was both a bigger increase between 2023 and 2024 and a bigger decline between 2024 and 2025 in the satellite record than in surface records.
The lower-tropospheric temperature records show large differences after the early 2000s. RSS shows an overall rate of warming quite similar to surface temperature records, while UAH and NOAA show considerably slower warming in recent years than has been observed on the surface.
Greenhouse gas concentrations reach new highs
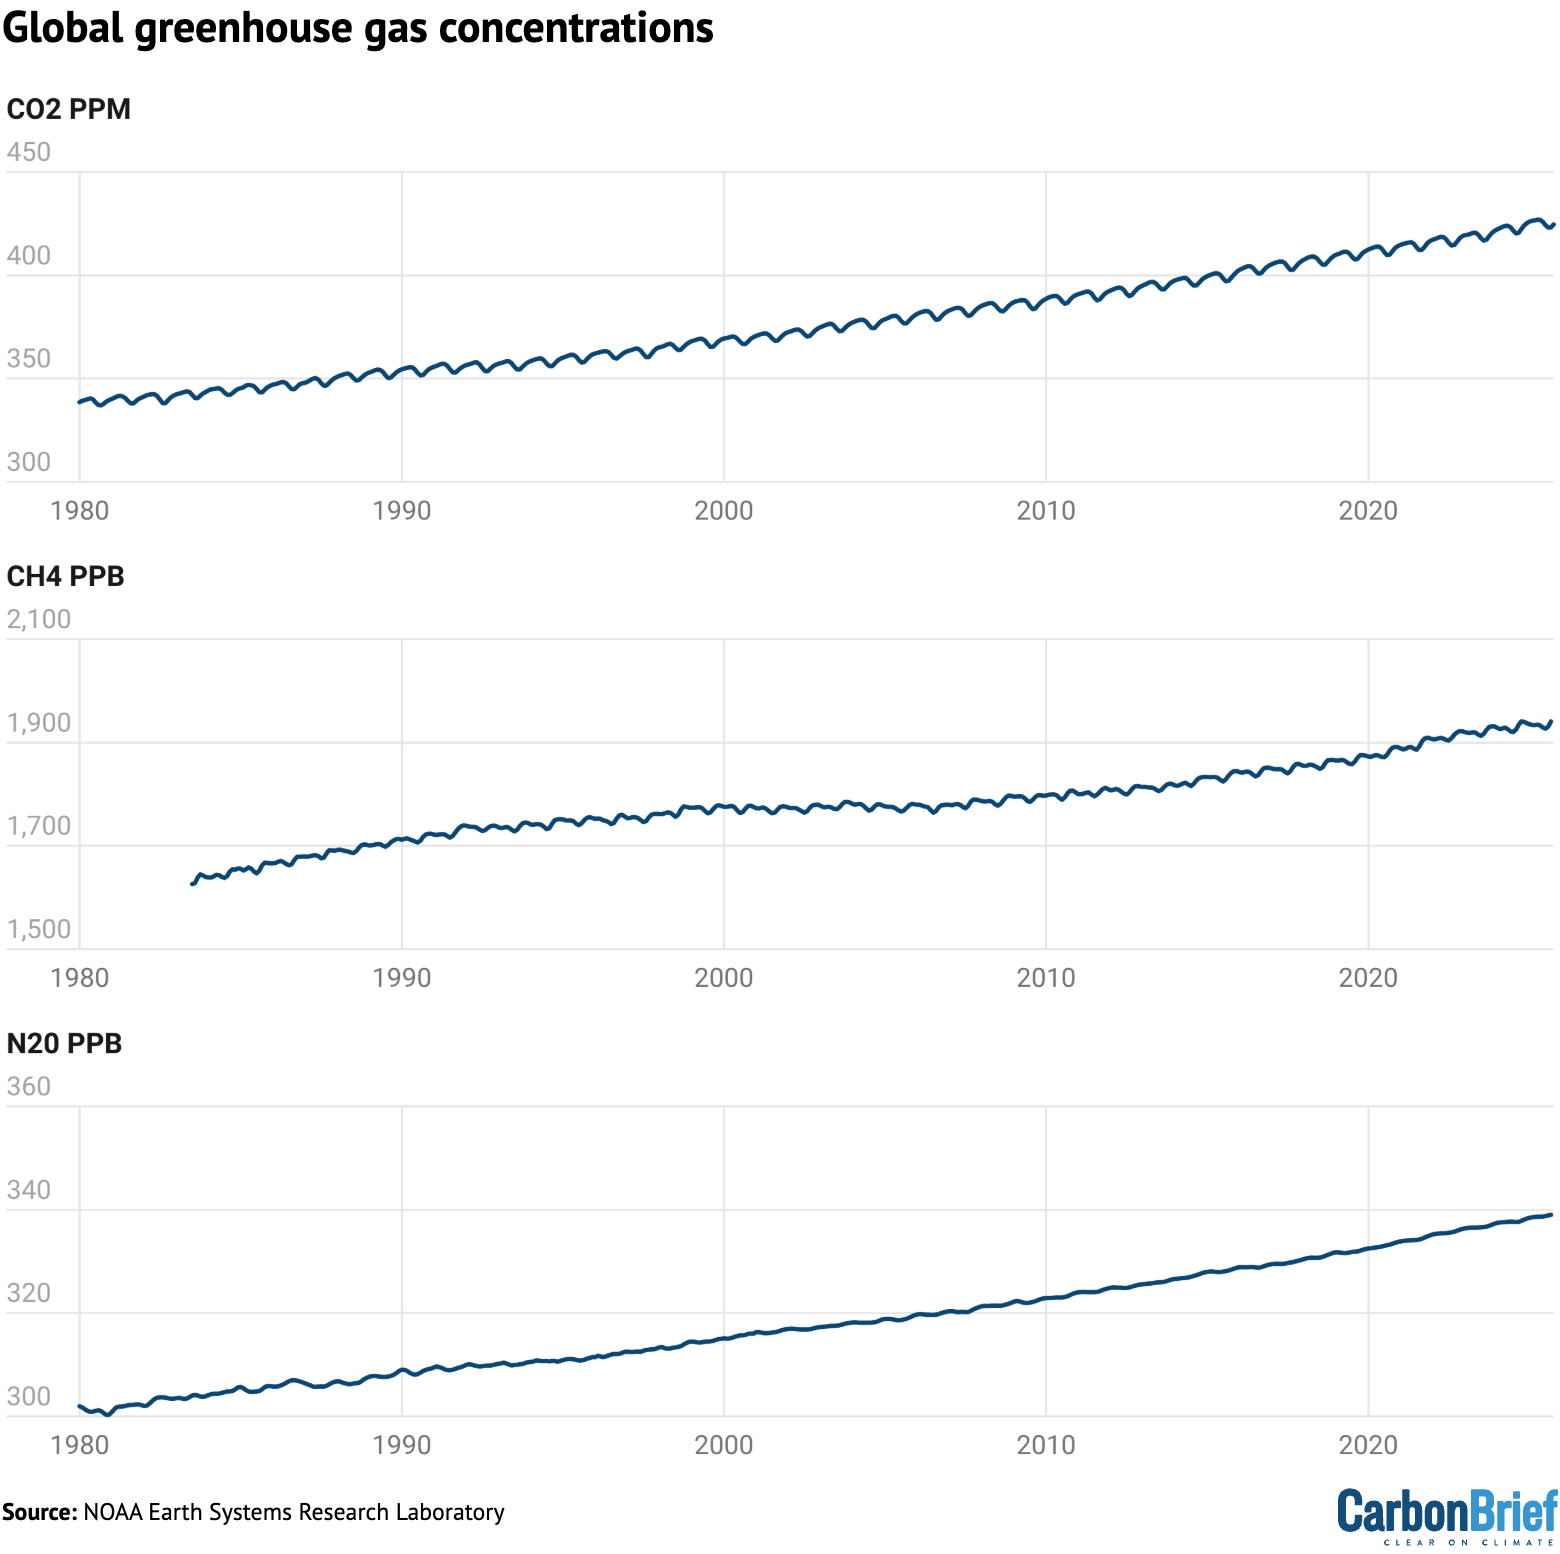
Greenhouse gas concentrations reached a new high in 2025, driven by human-caused emissions from fossil fuels, land use and agriculture.
Three greenhouse gases – CO2, methane (CH4) and nitrous oxide (N2O) – are responsible for the bulk of additional heat trapped by human activities. CO2 is by far the largest factor, accounting for roughly 42% of the increase in global surface temperatures since the pre-industrial era (1850-1900).
Methane accounts for 28%, while nitrous oxide accounts for around 5%. The remaining 25% comes from other factors including carbon monoxide, black carbon and halocarbons, such as chlorofluorocarbons (CFCs).
Human emissions of greenhouse gases have increased atmospheric concentrations of CO2, methane and nitrous oxide to their highest levels in at least a few million years – if not longer.
The figure below shows concentrations of these greenhouse gases – in parts per million (ppm) for CO2 and parts per billion (ppb) for methane and nitrous oxide – from the early 1980s through to October 2025 for CO2 and September 2025 for CH4 and N2O (the most recent data currently available).
Global concentrations of CO2, methane (CH4) and nitrous oxide (N2O). Based on data from NOAA’s Earth Systems Research Laboratory. Note that the y-axes do not start at zero. Chart by Carbon Brief.
Sea level is rising rapidly
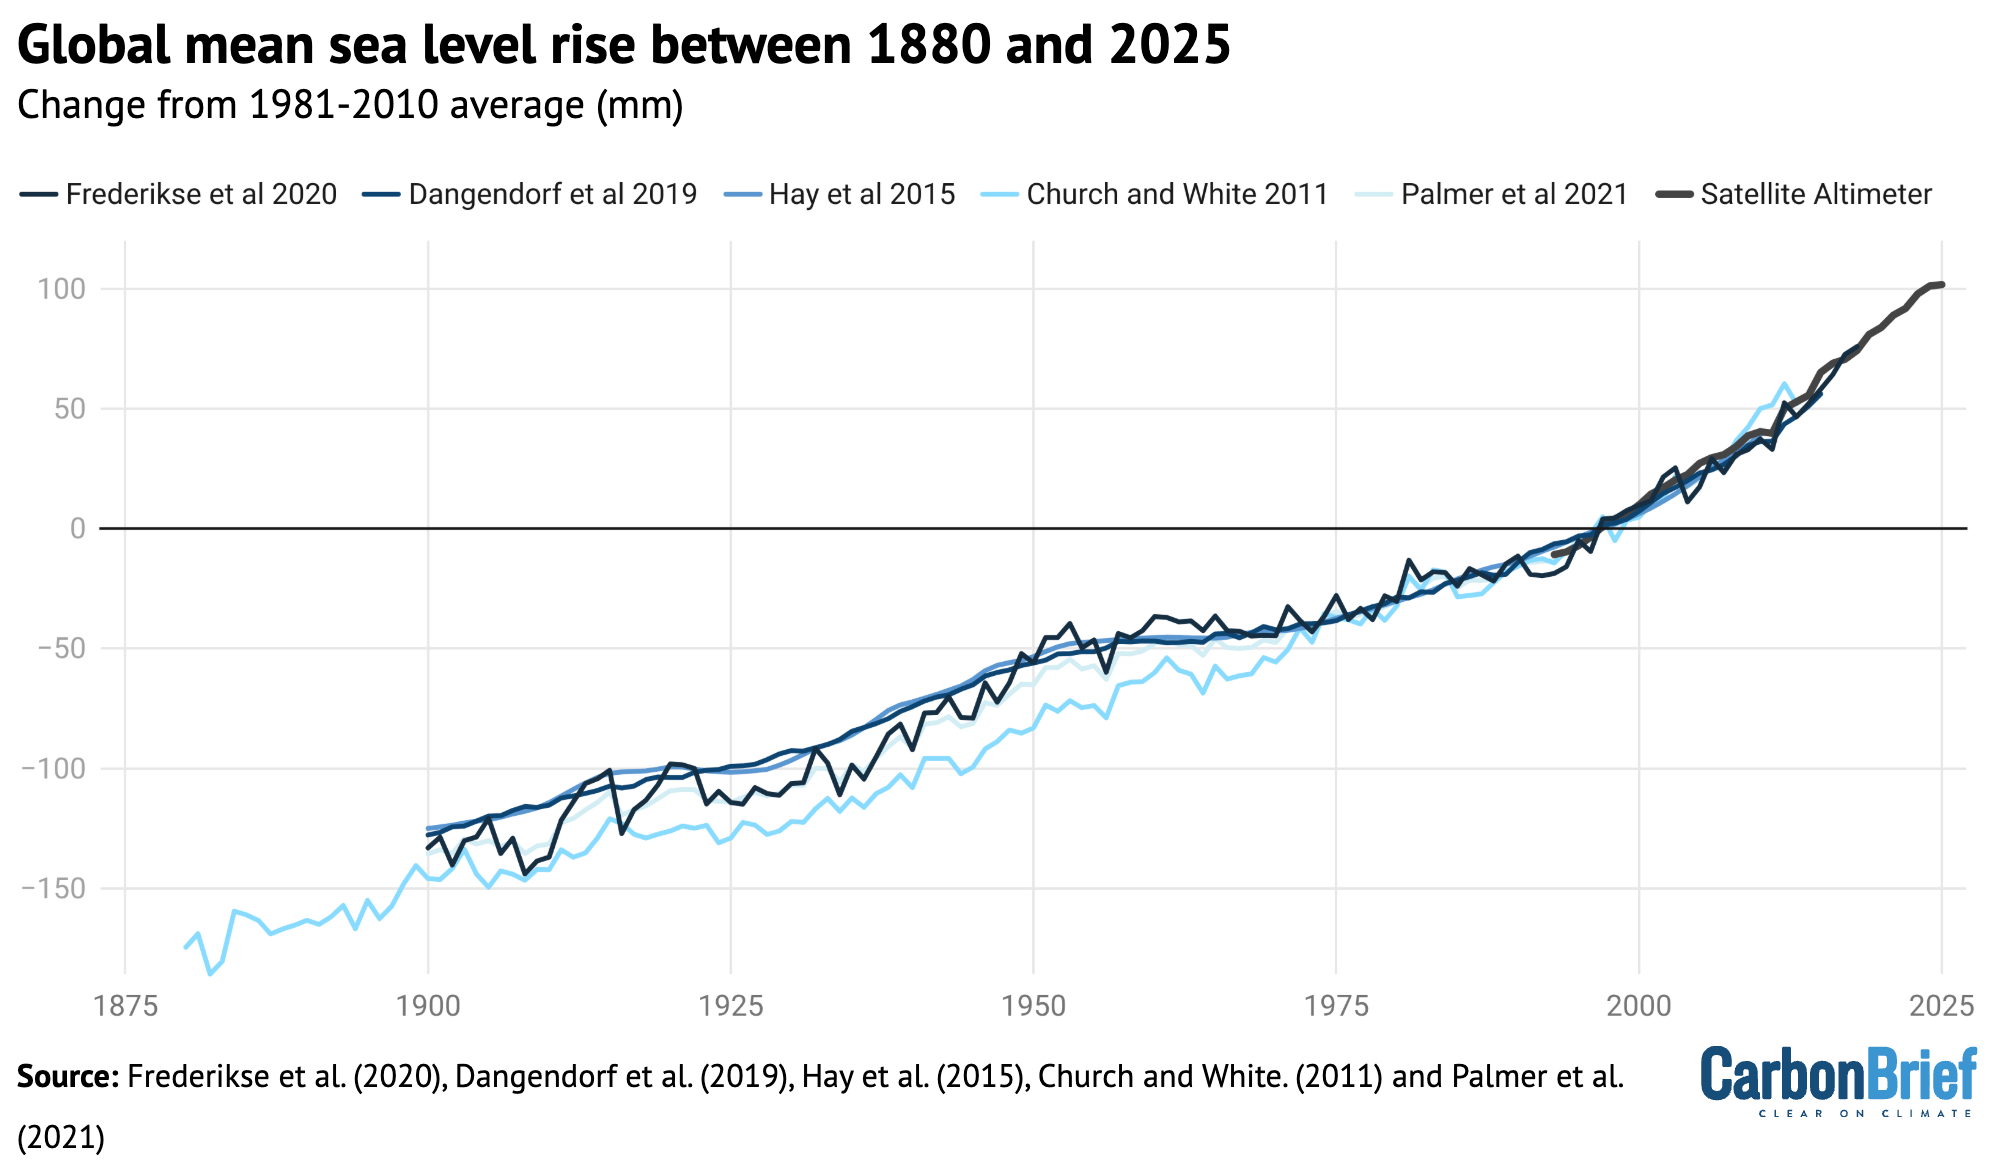
Modern-day sea levels have risen to a new high, due to a combination of melting land ice (such as glaciers and ice sheets), the thermal expansion of water as it warms and changes in land water storage.
In recent years, there have been larger contributions to sea level rise from melting ice sheets and glaciers, as warmer temperatures accelerate ice sheet losses in Greenland and Antarctica.
Since the early 1990s, the increase in global sea level has been estimated using altimeter data from satellites. Earlier global sea levels have been reconstructed from a network of global tide gauge measurements. This allows researchers to estimate how sea level has changed since the late 1800s.
The chart below shows five different modern sea level rise datasets (blue lines), along with satellite altimeter measurements as assessed by AVISO (in black) after 1993. (As sea level rise data has not yet been released for the whole year, the 2025 value is estimated based on data through to November.)
Global average sea level rise reconstructed from tide gauge data between 1880 and 2025 from Frederikse et al. (2020), Dangendorf et al. (2019), Hay et al. (2015), Church and White (2011), and Palmer et al. (2021). Satellite altimeter data from 1993 (black) to present is taken from AVISO. Chart by Carbon Brief.
Sea levels have risen by over 0.2 metres (200mm) since 1900. While sea level rise estimates mostly agree in recent decades, larger divergences are evident before 1980. There is also evidence of accelerating sea level rise over the post-1993 period when high-quality satellite altimetry data is available.
(To understand more on how climate change is accelerating sea level rise, read Carbon Brief’s explainer.)
Shrinking glaciers and ice sheets
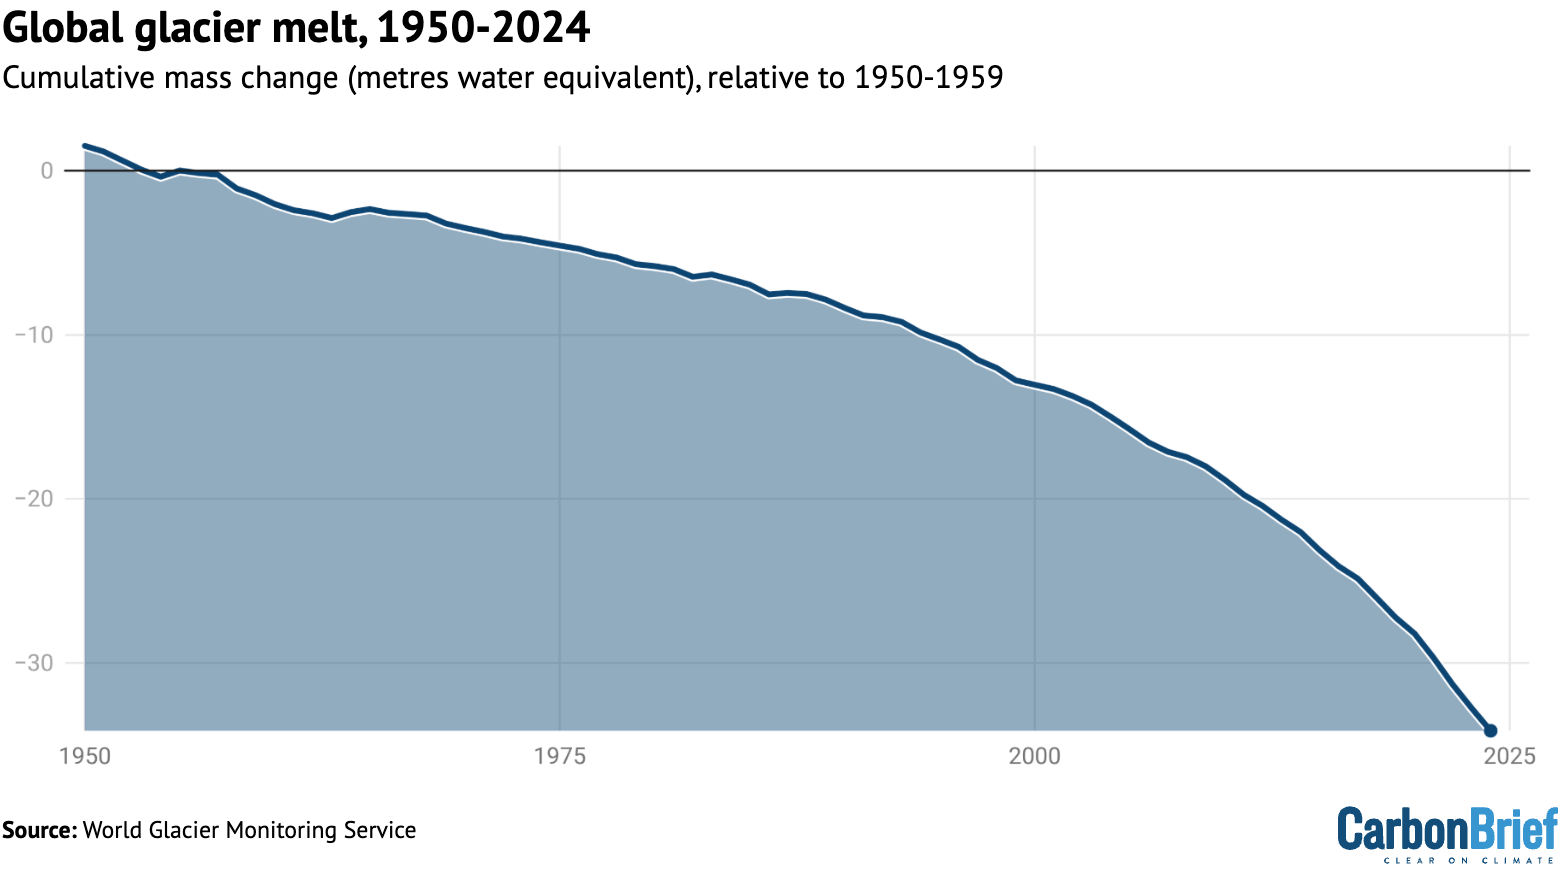
A significant portion of global sea level rise is being driven by melting glaciers on land.
Scientists measure the mass of glaciers around the world using a variety of remote-sensing techniques, as well as through GRACE measurements of the Earth’s gravitational field. The balance between snow falling on a glacier and ice loss through melting and the breaking off – or “calving” – of icebergs determines if glaciers grow or shrink over time.
The World Glacier Monitoring Service is an international consortium that tracks more than 130 different glaciers in 19 different regions around the world. The figure below shows the change in global average glacier mass from 1950 through to the end of 2024. (2025 values are not yet available.) Note that glacier melt is reported in metres of water equivalent, which is a measure of how much mass has been lost on average.
Global average glacier melt over the 1950-2024 period from the World Glacier Monitoring Service, in metres of water equivalent. Carbon Brief.
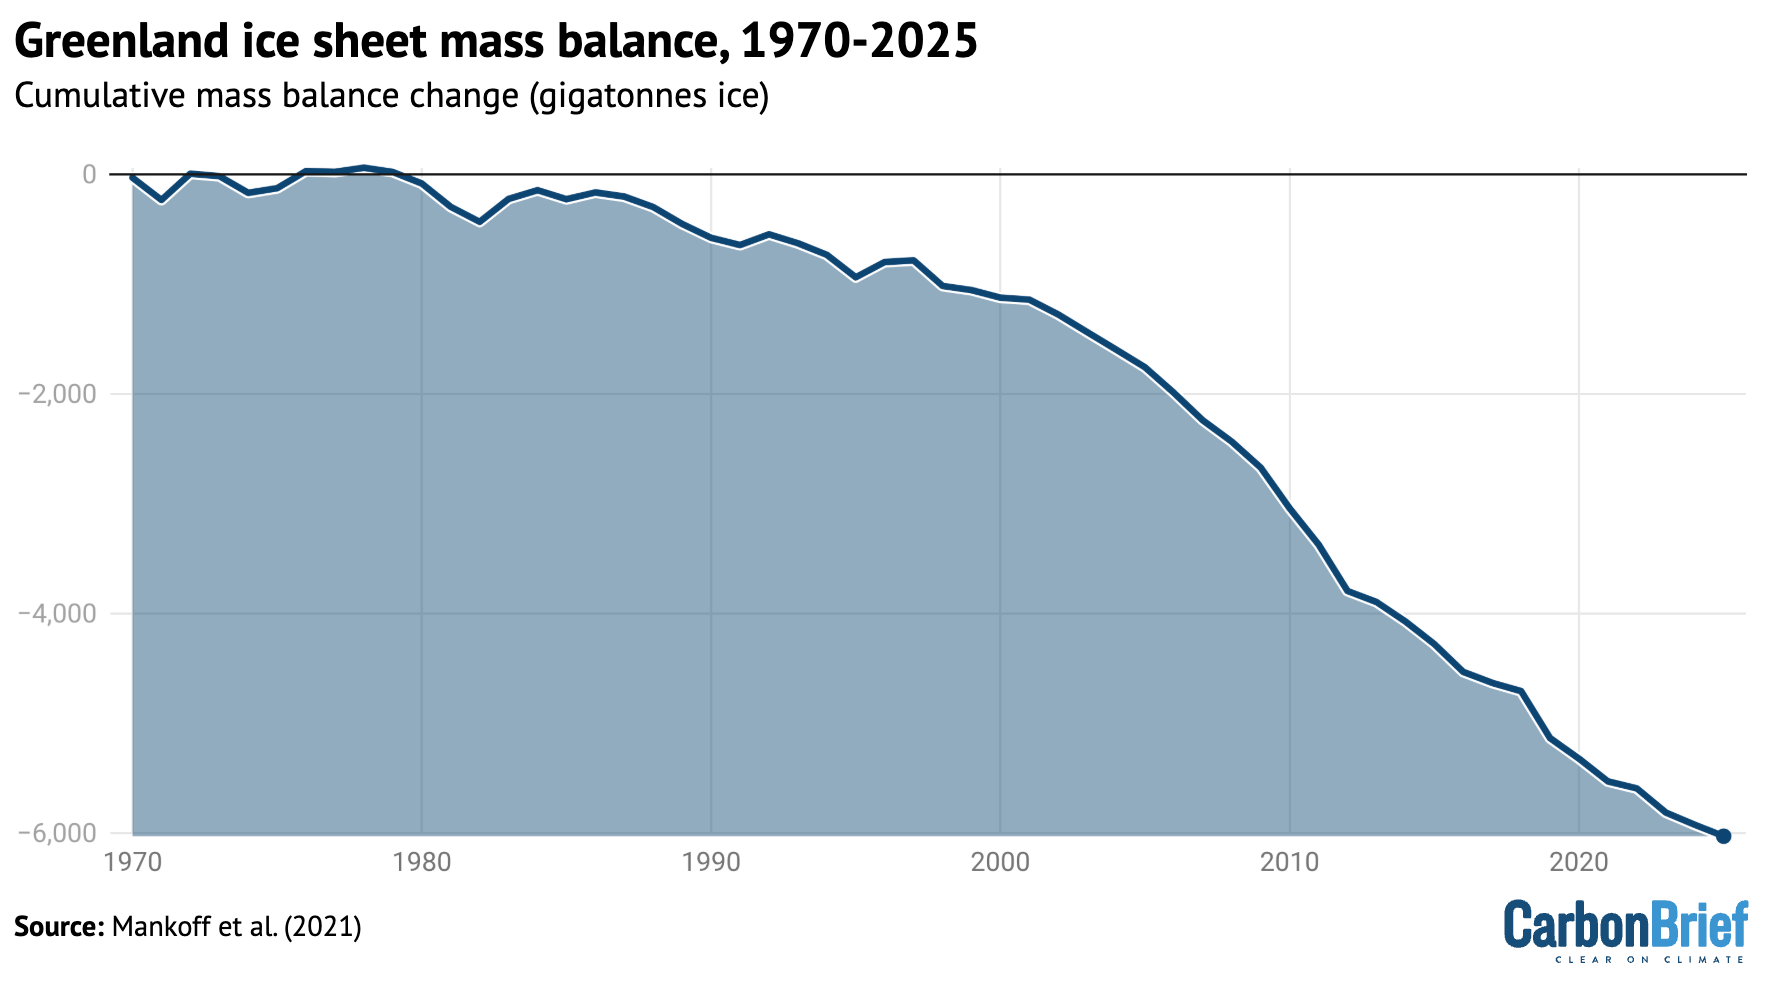
Greenland ice sheets have become a larger contributor to sea level rise in recent years due to accelerating loss of mass. The year 2025 was the 29th in a row where Greenland lost ice overall, with 105bn tonnes of ice lost over the 12 months from September 2024 to August 2025. Greenland last saw an annual net gain of ice in 1996.
The figure below shows the cumulative mass balance change – that is, the net ice loss – from Greenland between 1970 and 2025. The authors find that Greenland has lost around 6tn tonnes of ice over the past 50 years – more than 700 tonnes lost per person for every person on the planet.
Cumulative ice loss from Greenland in billion metric tonnes (gigatonnes) between 1970 and 2025 from Mankoff et al 2021. Chart by Carbon Brief.
Lowest winter Arctic sea ice extent
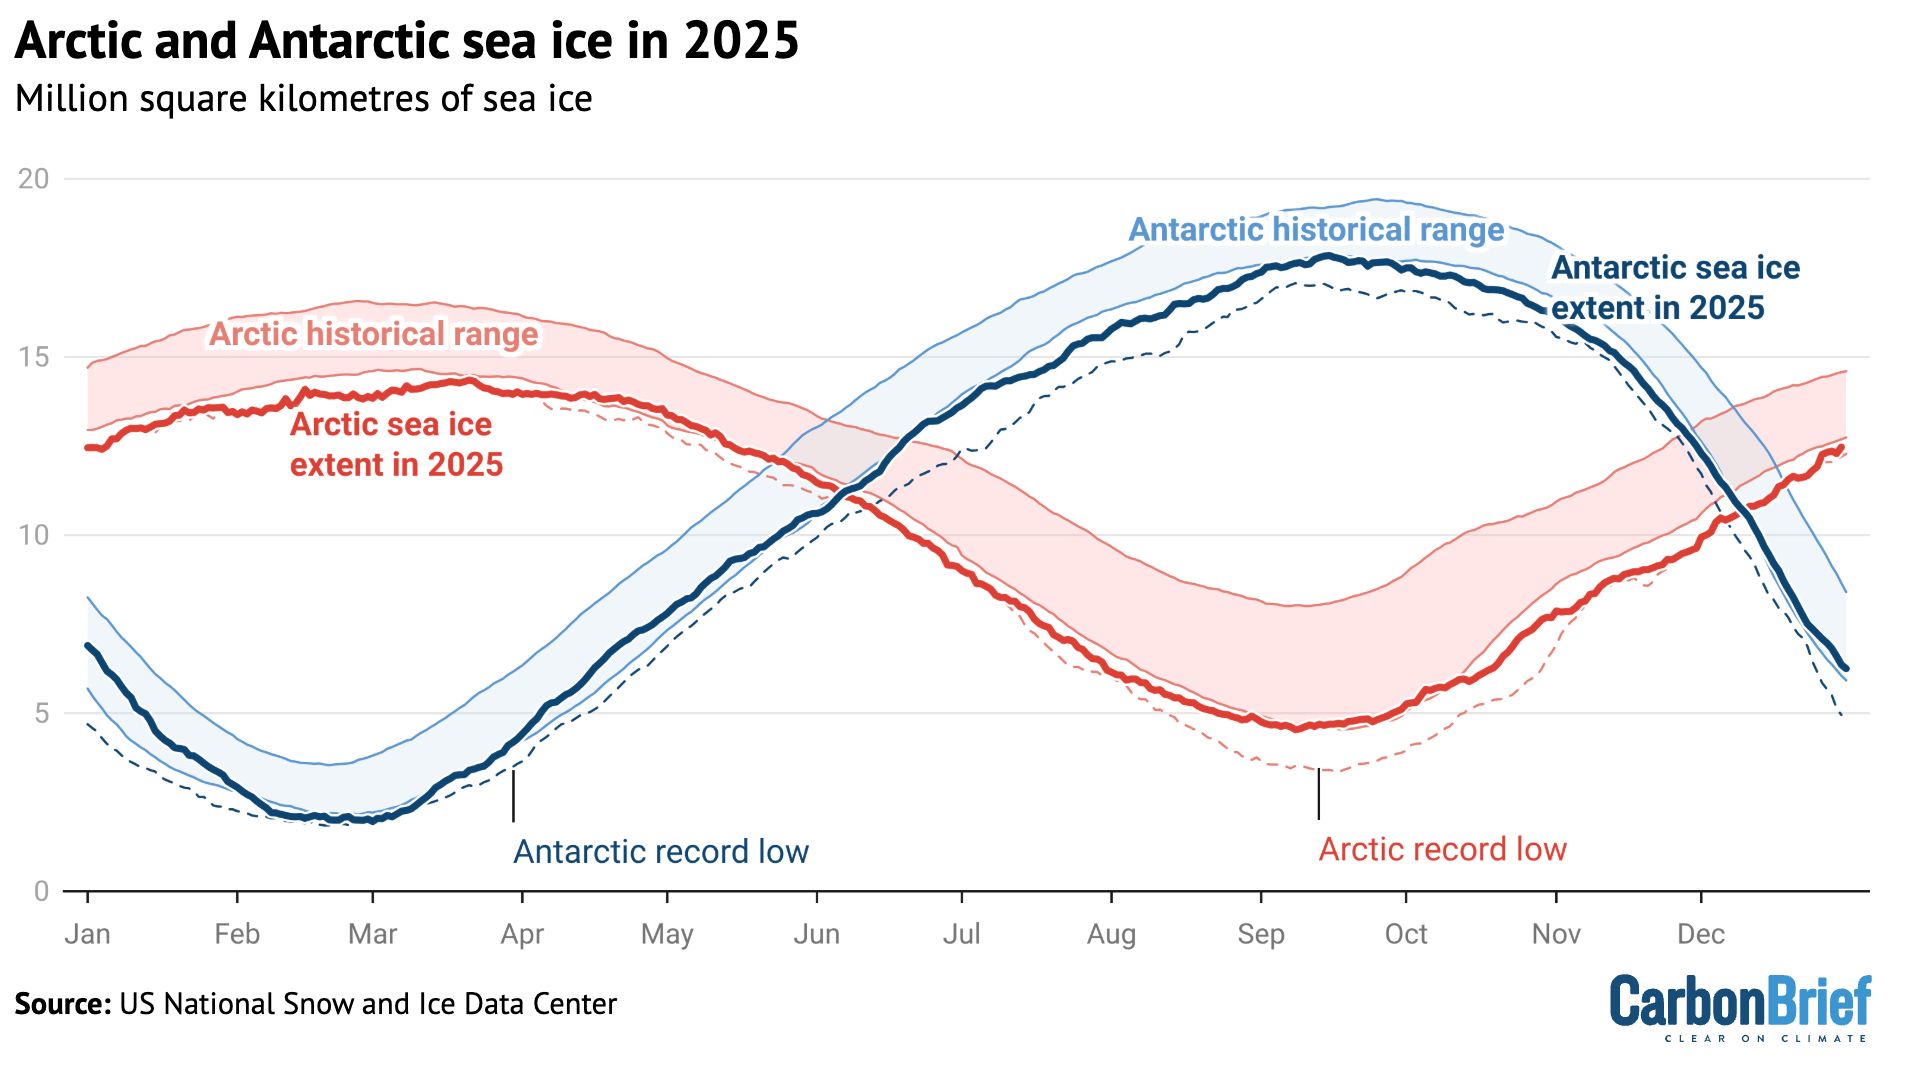
Arctic sea ice saw its lowest winter peak on record as well as its 10th-lowest summer minimum extent, while Antarctic sea ice saw its third-lowest minimum extent.
Both the Arctic and Antarctic were at the low end of the historical (1979-2010) range for most of 2025, with new daily lows recorded for Arctic sea ice extent in January, February, March, June and December.
The figure below shows both Arctic (red line) and Antarctic (blue line) sea ice extent for each day of the year, along with how it compares to the historical range (corresponding shading).
Arctic and Antarctic daily sea ice extent from the US National Snow and Ice Data Center. The bold lines show daily 2025 values, the shaded area indicates the two standard deviation range in historical values between 1979 and 2010. The dotted black lines show the record lows for each pole. Chart by Carbon Brief.
Looking ahead to 2026
There is reason for caution when estimating likely temperatures for 2026.
In 2023, temperatures were significantly higher than predictions made at the start of the year, while 2024 temperatures were towards the high end of annual predictions. Temperatures in 2025 were more in-line with predictions, albeit still on the higher side for three out of the four predictions included above.
There are currently weak La Niña conditions currently present in the tropical Pacific, which are expected to extend through February. This would somewhat suppress temperatures in the first half of the year. However, the latest forecasts suggest a growing likelihood of El Niño conditions developing by June, which may lead to warmer temperatures in late 2026 – and potentially much warmer temperatures in 2027.
Carbon Brief predicts that global average surface temperatures in 2026 are likely to be between the second and fourth warmest on record, similar to 2023 and 2025, at around 1.4C above pre-industrial levels.
The figure below shows the four different 2026 predictions compared to the average of eight different temperature records explored in this article. (These have been “normalised” to show 2026 warming relative to the 2023-25 average to allow a clear comparison, given that each of the predictions was originally presented for a different temperature record.)
Carbon Brief’s prediction of likely 2026 temperatures is based on a statistical model using the average temperature of the past year, the latest monthly temperature and projections of ENSO conditions over the first three months of 2026.
Temperature projections for 2026 from the Met Office, NASA’s Dr Gavin Schmidt, Berkeley Earth and Carbon Brief, relative to pre-industrial (1850-1900) temperatures and compared to the historical average of eight different surface temperature datasets. Chart by Carbon Brief.
The Met Office, Dr Schmidt, Berkeley Earth and Carbon Brief estimates all have 2026 ending up as somewhere between the second- and fourth-warmest year on record, with the best estimate as being more or less tied with 2023 and 2025.
There is a very small chance that 2026 could end up beating 2024 as the warmest year on record, or end up below 2016 as the fifth or sixth warmest year.
However, with the growing likelihood of El Niño conditions developing in the second half of 2026, it is increasingly likely that 2027 will challenge 2024 for the title of the warmest year on record. The rate of warming has notably accelerated over the past 15 years and the period of exceptionally warm years that started in 2023 shows no signs of abating.
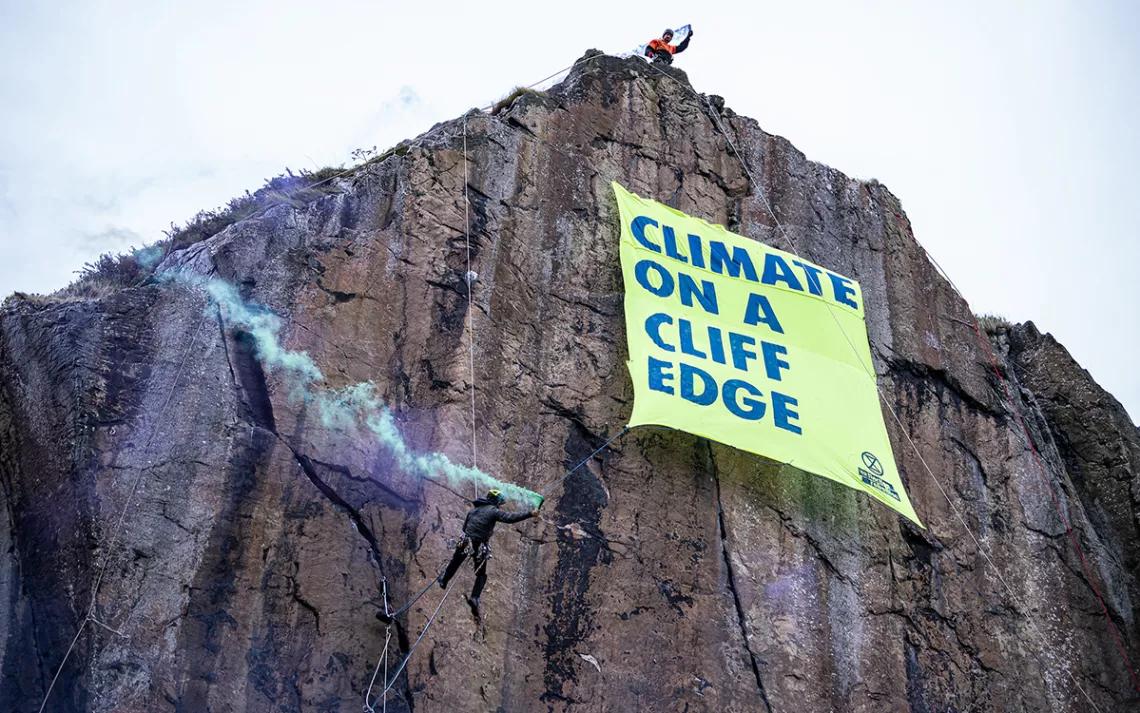
Experienced climbers scale a rock face near the historic Dumbarton castle in Glasgow, releasing a banner that reads “Climate on a Cliff Edge.” One activist, dressed as a globe, symbolically looms near the edge, while another plays the bagpipes on the shores below. | Photo courtesy of Extinction Rebellion and Mark Richards
Donald Trump urges you to be a Climate Science denier like him. He says that he makes millions and millions for destroying the planet, Burn, Baby, Burn and Flood, Baby, Flood.Nigel Farage urges you to ignore facts and reality and be a climate science denier like him and his Deputy Richard Tice. He says that Reform UK has received £Millions and £Millions from the fossil fuel industry to promote climate denial and destroy the planet.
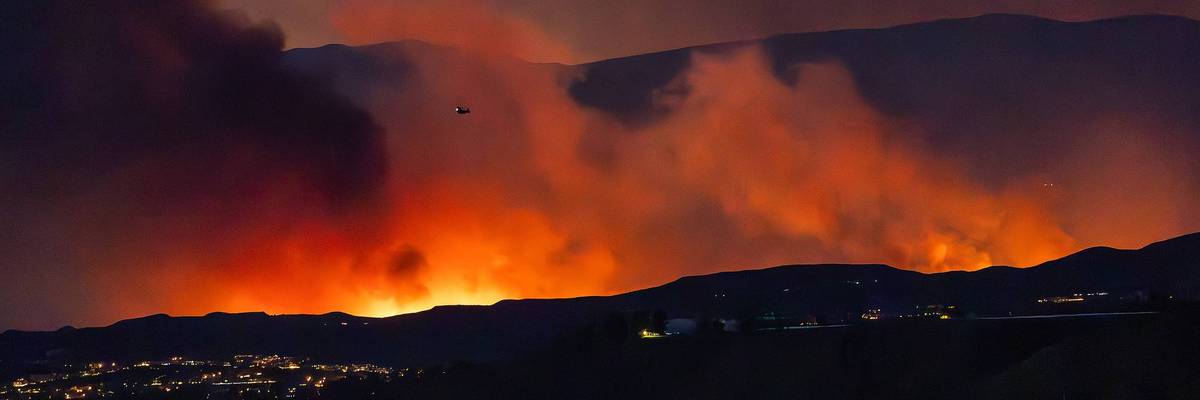
The Hughes fire burns north of Santa Clarita, California on January 22, 2025. (Photo by Myung J. Chun/Los Angeles Times via Getty Images)
“Pretty much all federal scientists working on climate in the US have had to self-censor,” said one scientist. “Thankfully much of the underlying science is still occurring, even if they cannot talk about it.”
National Aeronautics and Space Administration Administrator Bill Nelson declared a year ago that “once again, the temperature record has been shattered—2024 was the hottest year since recordkeeping began in 1880,” and NASA’s statement noted climate change and its consequences, from sweltering heat to devastating wildfires. This week, under a president who has called the fossil fuel-driven crisis “the greatest con job ever perpetrated on the world,” there was no such language from the US agency.
NASA did release a statement about its latest findings on Wednesday. The agency said that, like other experts around the world, its scientists found that “Earth’s global surface temperature in 2025 was slightly warmer than 2023—but within the margin of error the two years are effectively tied,” and “the hottest year on record remains 2024.”
Specifically, 2025 saw average temperatures 2.14°F or 1.19°C above the 1951-80 average, the statement said, also detailing NASA’s data sources. However, in line with what President Donald Trump’s second administration has done across the federal government, the release does not mention human-caused climate change.
The omission quickly caught the attention of journalists and scientists, including Agence France-Presse‘s Issam Ahmed, who began a Wednesday report on the topic with, “Don’t say the c-word” and spoke with various experts:
“The US government is now, like Russia and Saudi Arabia, a petrostate under Trump and Republican rule, and the actions of all of its agencies and departments can be understood in terms of the agenda of the polluters that are running the show,” University of Pennsylvania climatologist Michael Mann told AFP. “It is therefore entirely unsurprising that NASA administrators are attempting to bury findings of its own agency that conflict with its climate denial agenda.”
Zeke Hausfather, a research scientist at Berkeley Earth, added, “I’m just happy they were allowed to put out a press release.”
“Pretty much all federal scientists working on climate in the US have had to self-censor and leave out reference to human influences on climate change, unfortunately,” he told AFP. “Thankfully much of the underlying science is still occurring, even if they cannot talk about it.”
Mike Scott of Carbon Copy Communications, toldEuronews Green on Thursday that NASA’s new statement is “consistent” with the administration’s other “anti-climate actions.”
In September, the US Department of Energy—led by climate liar and former fracking CEO Chris Wright—added “climate change” to its “list of words to avoid” at the Office of Energy Efficiency and Renewable Energy. Other banned terms include carbon/CO2 “footprint,” clean, decarbonization, “dirty” energy, emissions, energy transition, green, sustainability/sustainable, and tax breaks/tax credits/subsidies.
Last month, the Trump administration removed all references to human-caused climate change from Environmental Protection Agency webpages, as well as data showing global warming over recent decades and the resulting risks. Daniel Swain, a climate scientist at the University of California Agriculture and Natural Resources, called it “one of the more dramatic scrubbings we’ve seen so far in the climate space.”
Since returning to office nearly a year ago with support from Big Oil’s money, Trump has also declared a “national energy emergency” to help deliver on his campaign pledge to “drill, baby, drill,” rolled back various climate policies implemented under his Democratic predecessor, ditched the Paris climate agreement again along with dozens of other international treaties and organizations, refused to attend an annual United Nations summit, and more.
“They have attacked the federal scientific enterprise built up over decades through taxpayer investments, fired or forced out agency experts, and cut funding for critical science. And a compliant Congress has enabled this destructive agenda, including by rubber-stamping some of the president’s illegal actions and by failing to exercise its constitutional powers to check his tyrannical power grabs,” she continued.
“This year has also brought extraordinary efforts to expose and fight back against the worst excesses of this unhinged administration,” she noted, pointing to lawsuits, organizing, and wins in states. “And as we face down another tough year under the anti-science, authoritarian Trump administration, we’re fired up to keep up the fight for science and for our democracy. We hope you’ll join us—because despite it all, that future is ours to build.”
Like Cleetus, Scott of Carbon Copy Communications expects Trump and his allies to continue waging its war on science.
“It’s not clear what climate institutions are left for Trump to try and dismantle, but there is little doubt that if he finds them, he will go after them,” he warned. “The climate denial is really worrying and out of line with almost every other country in the world, including most of the world’s largest oil producers. Failing to acknowledge the impacts of climate change will leave the US less able to deal with those impacts—which will continue to happen whatever Trump thinks.”
“The US stance is bad for science, it’s bad for the US economy and its citizens, and it’s bad for the climate,” Scott added. “It’s also unsustainable. Climate change will not stop because the US administration doesn’t believe in it. The American response to climate-related disasters will be worse if it doesn’t understand why extreme weather events and other climate impacts are happening.”
Elon Musk urges you to be a Fascist like him, says that you can ignore facts and reality then.Donald Trump urges you to be a Climate Science denier like him. He says that he makes millions and millions for destroying the planet, Burn, Baby, Burn and Flood, Baby, Flood.Orcas discuss Donald Trump and the killer apes’ concept of democracy. Front Orca warns that Trump is crashing his country’s economy and that everything he does he does for the fantastically wealthy.
The year 2025 saw the return to power of Donald Trump, a jewellery heist at the Louvre museum in Paris and an engagement that “broke the internet”.
Amid the biggest stories of the year, climate change research continued to feature prominently in news and social media feeds.
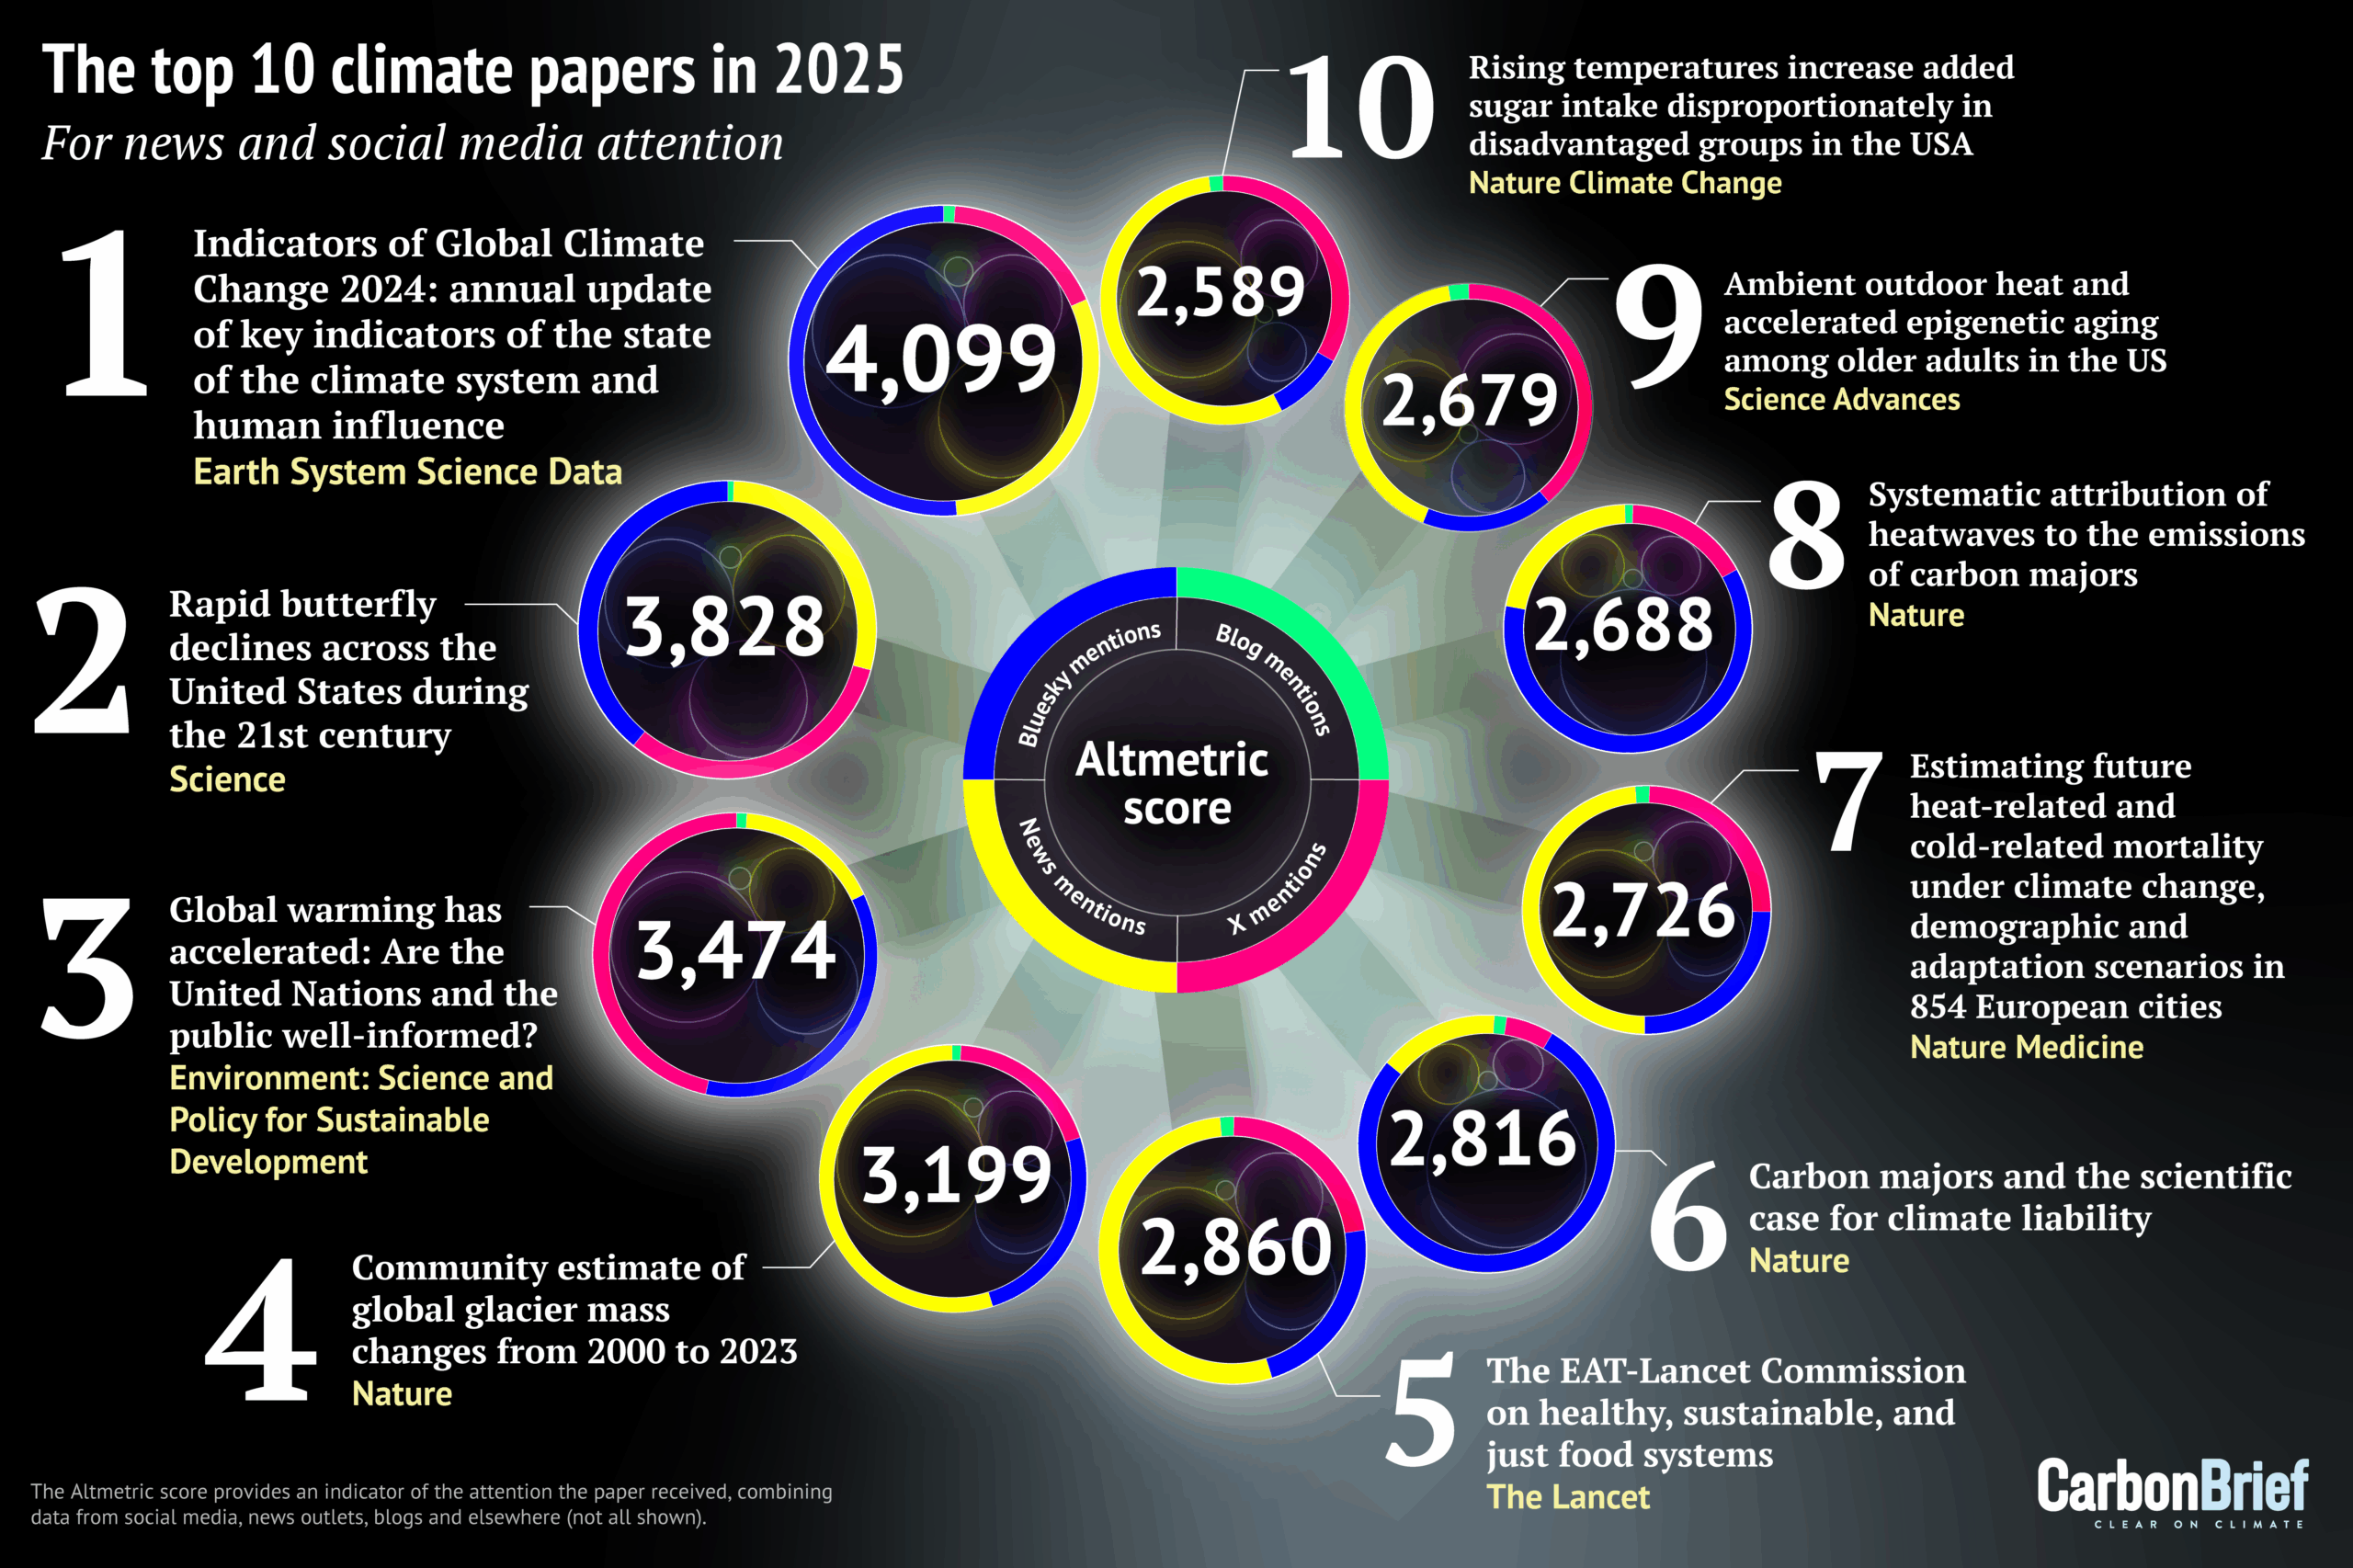
Using data from Altmetric, which scores research papers according to the attention they receive online, Carbon Brief has compiled its annual list of the 25 most talked-about climate-related studies of the past year.
The top 10 – shown in the infographic above and list below – include research into declining butterflies, heat-related deaths, sugar intake and the massive loss of ice from the world’s glaciers:
Later in this article, Carbon Brief looks at the rest of the top 25 and provides analysis of the most featured journals, as well as the gender diversity and country of origin of authors.
New for this year is the inclusion of Altmetric’s new “sentiment analysis”, which scores how positive or negative a paper’s social media attention has been.
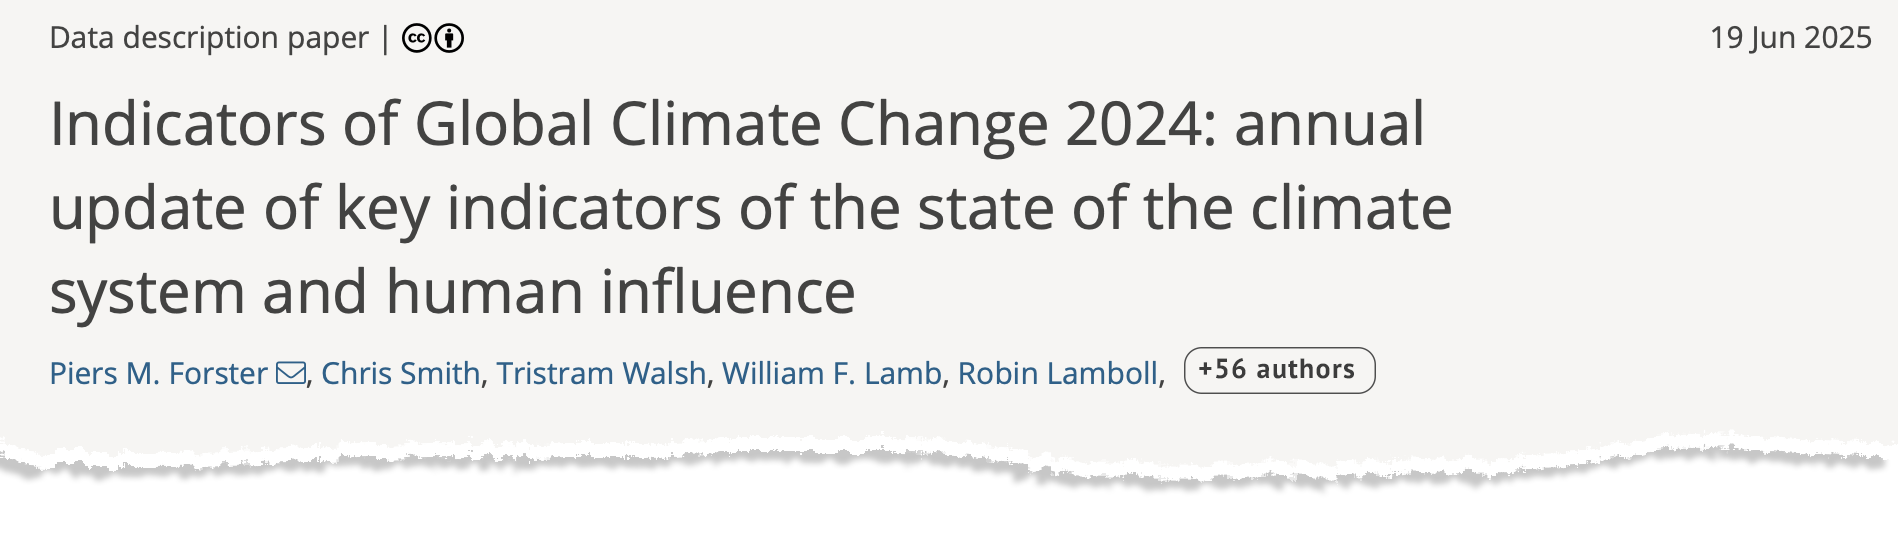
The top-scoring climate paper of 2025, ranking 24th of any research paper on any topic, is the annual update of the “Indicators of Global Climate Change” (IGCC) report.
The report was established in 2023 to help fill the gap in climate information between assessments of the Intergovernmental Panel on Climate Change (IPCC), which can take up to seven years to complete. It includes the latest data on global temperatures, the remaining carbon budget, greenhouse gas emissions and – for the first time – sea level rise.
The paper, published in Earth System Science Data, has an Altmetric score of 4,099. This makes it the lowest top-scoring climate paper in Carbon Brief’s list since 2017.
(An Altmetric score combines the mentions that published peer-reviewed research has received from online news articles, blogs, Wikipedia and on social media platforms such as Facebook, Reddit, Twitter and Bluesky. See an earlier Carbon Brief article for more on how Altmetric’s scoring system works.)
Previous editions of the IGCC have also appeared in Carbon Brief’s list – the 2024 and 2023 iterations ranked 17th and 18th, respectively.
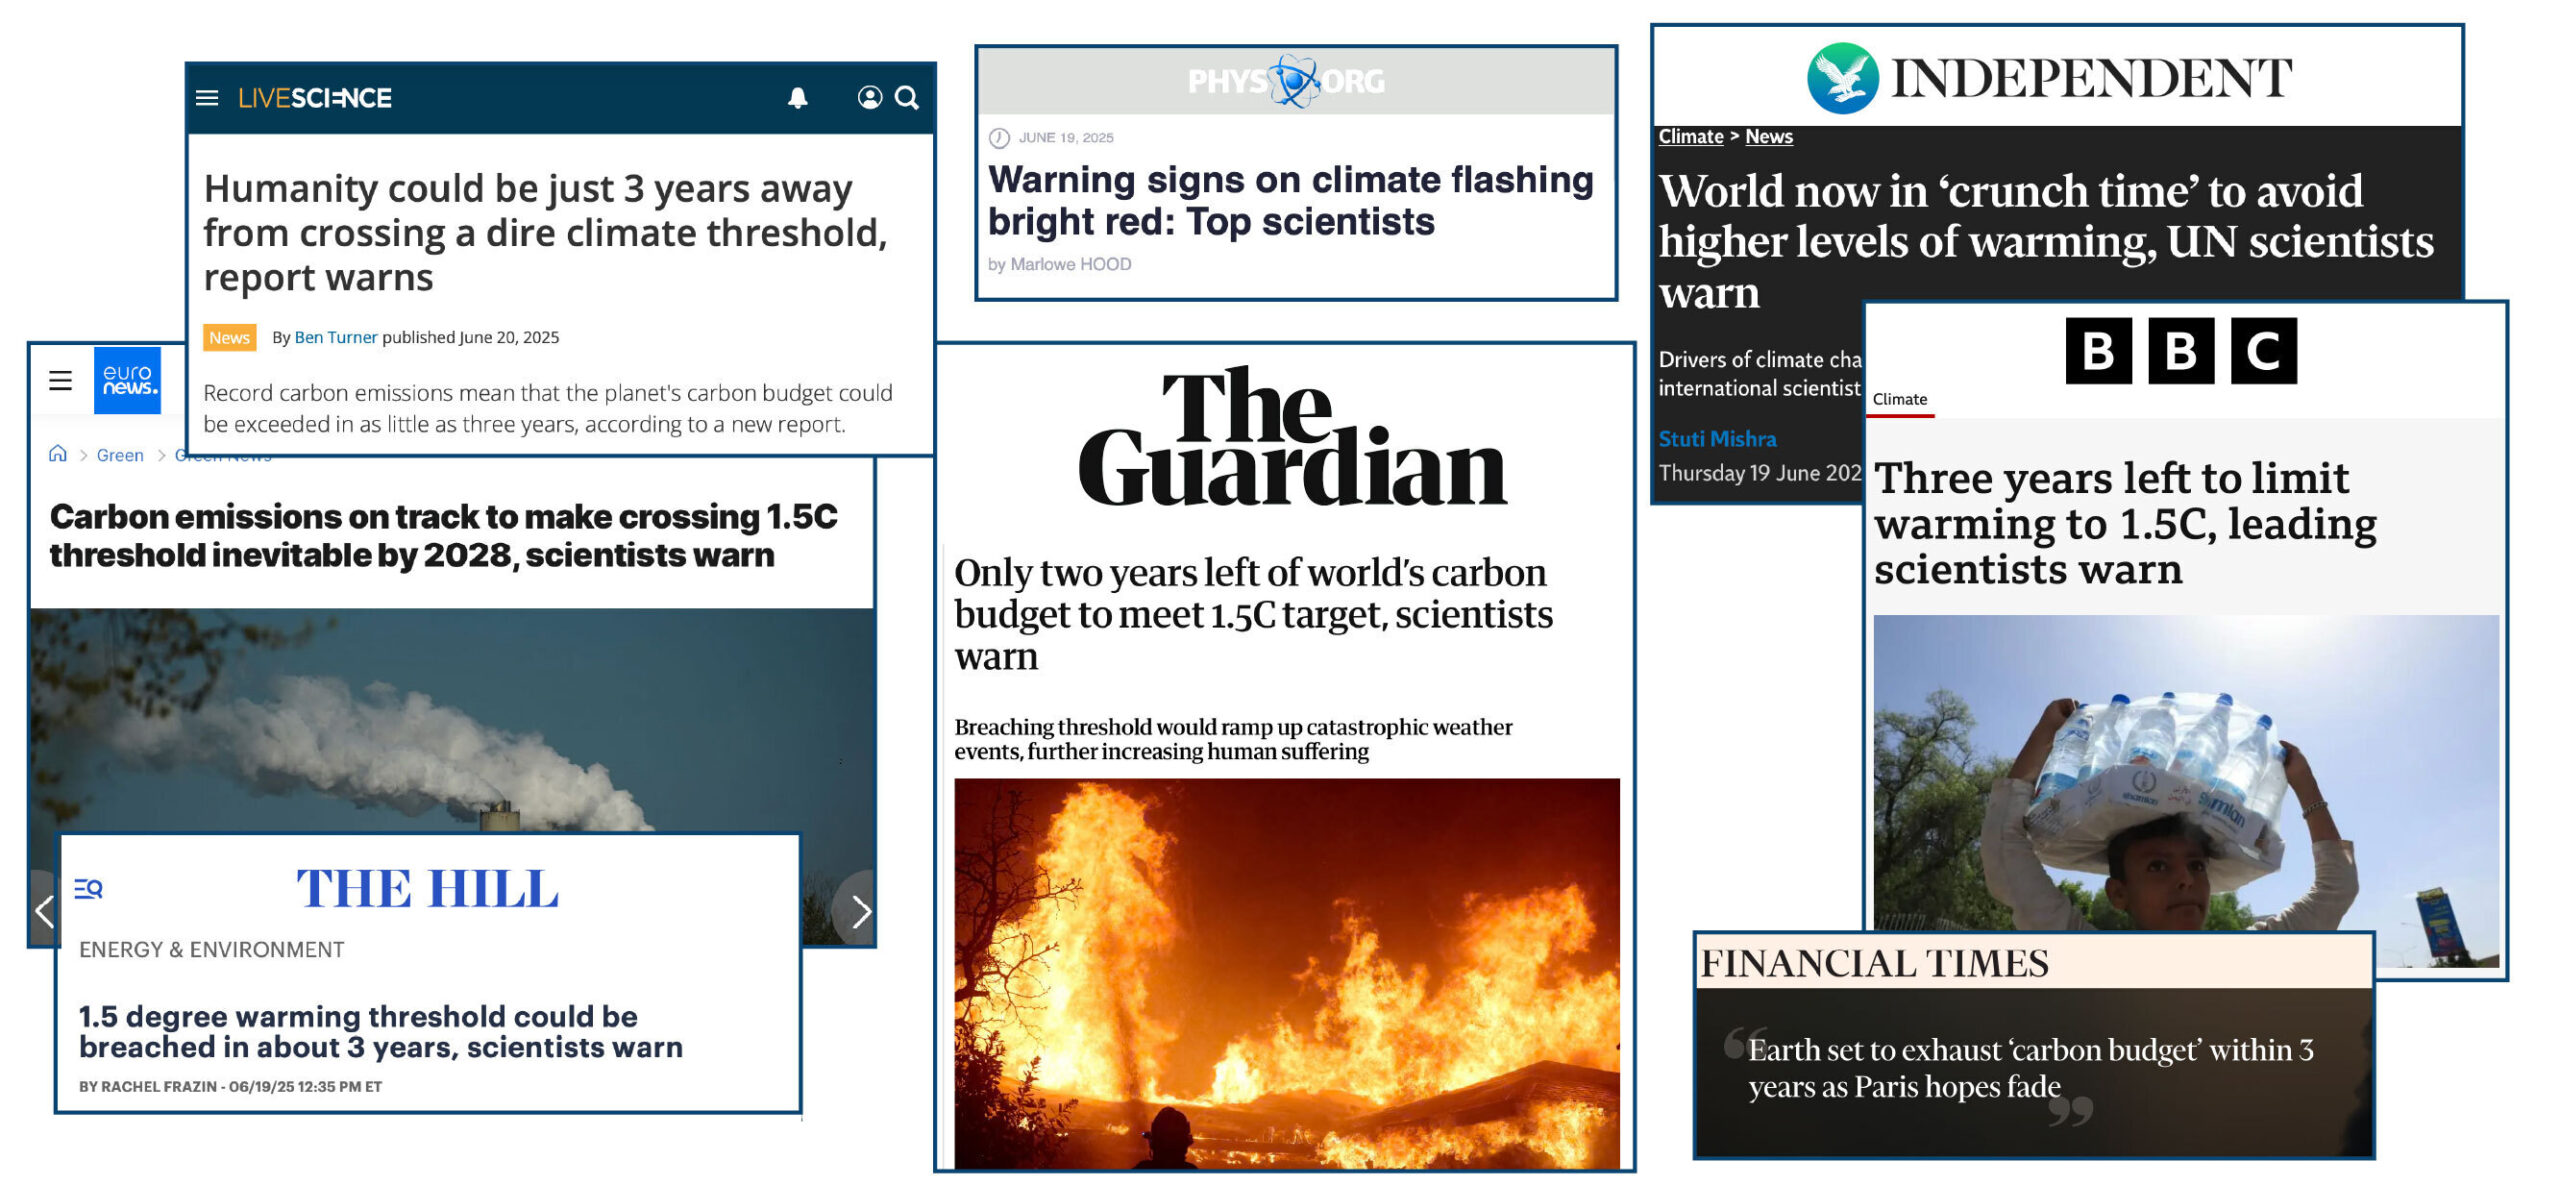
Many outlets led their coverage with the study’s findings on the global “carbon budget”. This warned that the remaining carbon budget to limit warming to 1.5C will be exhausted in just three years if global emissions continue at their current rate.
“It is also now inevitable that global temperatures will reach 1.5C of long-term warming in the next few years unless society takes drastic, transformative action…Every year of delay brings reaching 1.5C – or even higher temperatures – closer.”
Forster, who was awarded a CBE in the 2026 new year honours list, tells Carbon Brief that media coverage of the study was “great” at “putting recent extreme weather in the context of rapid long-term rates of global warming”.
However, he adds:
“Climate stories are not getting the coverage they deserve or need at the moment so the community needs to get all the help we can for getting clear consistent messages out there.”
The paper was tweeted more than 300 times and posted on Bluesky more than 950 times. It also appeared in 22 blogs.
Using AI, Altmetric now analyses the “sentiment” of this social media attention. As the summary figure below shows, the posts about this paper were largely positive, with an approximate 3:1 split of positive and negative attention.
Altmetric’s AI-generated summary of the sentiment of social media posts regarding the Forster et al. (2025) paper. Totals may add up to more than 100% because of rounding. Source: Altmetric
Butterfly decline
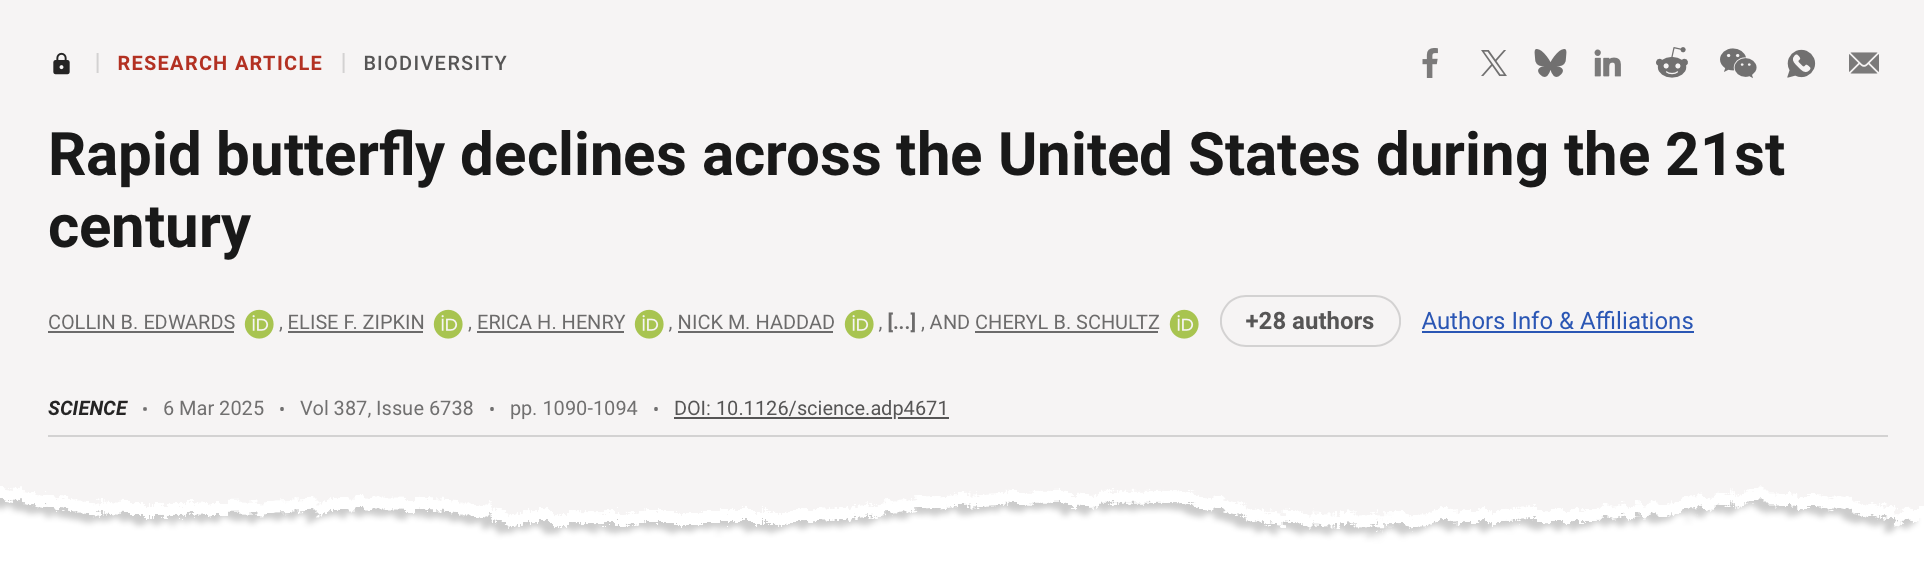
With an Altmetric score of 3,828, the second-highest scoring climate paper warns of “widespread” declines in butterfly numbers across the US since the turn of the century.
The paper, titled “Rapid butterfly declines across the US during the 21st century” and published in Science, identifies a 22% fall in butterfly numbers across more than 500 species between 2000 and 2020.
(There is a higher-scoring paper, “The 2025 state of the climate report: a planet on the brink”, in the journal BioScience, but it is a “special report” and was not formally peer reviewed.)
The scale of the decline suggests “multiple and broadly acting threats, including habitat loss, climate change and pesticide use”, the paper says. The authors find that “species generally had stronger declines in more southerly parts of their ranges”, with some of the most negative trends in the driest and “most rapidly warming” US states.
The paper was also mentioned in 13 blogs, more than 750 Bluesky posts and more than 600 tweets.
The sentiment analysis reveals that social media posts about the paper were largely negative. However, closer inspection reveals that this negativity is predominantly towards the findings of the paper, not the research itself.
For example, a Bluesky post on the “distressing” findings by one of the study’s authors is designated as “neutral negative” by Altmetric’s AI analysis.
In a response to a query from Carbon Brief, Altmetric explains that the “goal is to measure how people feel about the research paper itself, not the topic it discusses”. However, in some cases the line can be “blurred” as the AI “sometimes struggles to separate the subject matter from the critique”. The organisation adds that it is “continuously working on improving our models to better distinguish between the post’s content and the research output”.
Altmetric’s AI-generated summary of the sentiment of social media posts regarding the Forster et al. (2025) paper. Totals may add up to more than 100% because of rounding. Source: Altmetric
On the attention that the paper received, lead author Dr Collin Edwards of the Washington Department of Fish & Wildlife says that “first and foremost, people care about butterflies and our results are broad-reaching, unequivocal and, unfortunately, very concerning”.
Edwards tells Carbon Brief he hopes the clarity of the writing made the paper accessible to readers, noting that he and his co-authors “sweat[ed] over every word”.
The resulting news coverage “accurately captured the science”, Edwards says:
“Much as I wish our results were less consistently grim, the consistency and simplicity of our findings mean that even if a news story only provides the highest level summary, it isn’t misleading readers by skipping some key caveat or nuance that changes the interpretation.”
The findings suggest that the cooling effect of aerosols – tiny, light‑scattering particles produced mainly by burning fossil fuels – has masked more of the warming driven by greenhouse gases than previously estimated by the IPCC.
As efforts to tackle air pollution continue to reduce aerosol emissions, warming will accelerate further – reaching 2C by 2045, according to the research.
The paper was covered by almost 400 news stories – driven, in part, by Hansen’s comments in a press briefing that the Paris Agreement’s 2C warming limit was already “dead”.
Hansen’s analysis received a sceptical response from some scientists. For example, Dr Valerie Masson-Delmotte, an IPCC co-chair for its most recent assessment report on climate science, told Agence France-Presse the research “is not published in a climate science journal and it formulates a certain number of hypotheses that are not consistent with all the available observations”.
In addition, other estimates, including by Carbon Brief, suggest new shipping regulations have made a smaller contribution to warming than estimated by Hansen.
Hansen tells Carbon Brief that the paper “did ok” in terms of media coverage, although notes “it’s on [scientists] to do a better job of making clear what the core issues are in the physics of climate change”.
With more than 1,000 tweets, the paper scored highest in the top 25 for posts on Twitter. It was also mentioned in more than 800 Bluesky posts and on 27 blogs.
The sentiment analysis suggests that these posts were largely positive, with just a small percentage of negative comments.
Altmetric’s AI-generated summary of the sentiment of social media posts regarding the Hansen et al. (2025) paper. Totals may add up to more than 100% because of rounding. Source: Altmetric
Making the top 10
Ranking fourth in Carbon Brief’s analysis is a Nature paper calculating changes in global glacier mass over 2000-23. The study finds glaciers worldwide lost 273bn tonnes of ice annually over that time – with losses increasing by 36% between 2000-11 and 2012-23.
The study has an Altmetric score of 3,199. It received more news coverage than any other paper in this year’s top 25, amassing 1,187 mentions. with outlets including the Guardian, Associated Press and Economic Times.
Carbon Brief’s coverage of the report highlights that “a global shift towards ‘healthier’ diets could cut non-CO2 greenhouse gas emissions, such as methane, from agriculture by 15% by 2050”. It adds:
“The findings build on the widely cited 2019 report from the EAT-Lancet Commission – a group of leading experts in nutrition, climate, economics, health, social sciences and agriculture from around the world.”
Also making the top 10 – ranking sixth and eighth – are a pair of papers published in Nature, which both link extreme heat to the emissions of specific “carbon majors” – large producers of fossil fuels, such as ExxonMobil, Shell and Saudi Aramco,.
The first is a perspective, titled “Carbon majors and the scientific case for climate liability”, published in April. It begins:
“Will it ever be possible to sue anyone for damaging the climate? Twenty years after this question was first posed, we argue that the scientific case for climate liability is closed. Here we detail the scientific and legal implications of an ‘end-to-end’ attribution that links fossil fuel producers to specific damages from warming.”
The authors find “trillions (of US$) in economic losses attributable to the extreme heat caused by emissions from individual companies”.
The paper was mentioned 1,329 times on Bluesky – the highest in this year’s top 25. It was also mentioned in around 270 news stories.
Published four months later, the second paper uses extreme event attribution to assess the impact of climate change on more than 200 heatwaves recorded since the year 2000.
The authors find one-quarter of the heatwaves would have been “virtually impossible” without human-caused global warming. They add that the heatwaves were, on average, 1.7C hotter due to climate change, with half of this increase due to emissions stemming from the operations and production of carbon majors.
This study was mentioned in almost 300 news stories – including by Carbon Brief – as well as 222 tweets and 823 posts on Bluesky.
In seventh place is a Nature Medicine study, which quantifies how heat-related and cold-related deaths will change over the coming century as the climate warms.
A related research briefing explains the main findings of the paper:
“Heat-related deaths are estimated to increase more rapidly than cold-related deaths are estimated to decrease under future climate change scenarios across European cities. An unrealistic degree of adaptation to heat would be required to revert this trend, indicating the need for strong policies to reduce greenhouse gases emissions.”
The paper in ninth place also analyses the health impacts of extreme heat. The study, published in Science Advances, finds that extreme heat can speed up biological ageing in older people.
Rounding out the top 10 is a Nature Climate Change study, titled “Rising temperatures increase added sugar intake disproportionately in disadvantaged groups in the US”.
The study finds that at higher temperatures, people in the US consume more sugar – mainly due to “higher consumption of sugar-sweetened beverages and frozen desserts”. The authors project that warming of 5C would drive additional sugar consumption of around 3 grams per day, “with vulnerable groups at an even higher risk”.
In 13th place is a Nature Climate Change study that finds the wealthiest 10% of people – defined as those who earn at least €42,980 (£36,605) per year – contributed seven times more to the rise in monthly heat extremes around the world than the global average.
The authors also explore country-level emissions, finding that the wealthiest 10% in the US produced the emissions that caused a doubling in heat extremes across “vulnerable regions” globally.
In 15th place is the annual Lancet Countdown on health and climate change – a lengthy report with more than 120 authors.
The study warns that “climate change is increasingly destabilising the planetary systems and environmental conditions on which human life depends”.
This annual analysis from the Lancet often features in Carbon Brief’s top 25 analysis. After three years in the Carbon Brief’s top 10 over 2020-23, the report landed in 20th place in 2023 and missed out on a spot in the top 25 altogether in 2024.
In 16th place is a Science Advances study, titled “Increasing rat numbers in cities are linked to climate warming, urbanisation and human population”. The study uses public complaint and inspection data from 16 cities around the world to estimate changes in rat populations.
It finds that “warming temperatures and more people living in cities may be expanding the seasonal activity periods and food availability for urban rats”.
In 21st place is a Nature Climate Change paper, titled “Peak glacier extinction in the mid-21st century”. The study authors “project a sharp rise in the number of glaciers disappearing worldwide, peaking between 2041 and 2055 with up to ~4,000 glaciers vanishing annually”.
Completing the top 25 is a Nature study on the “prudent planetary limit for geological carbon storage” – where captured CO2 is injected deep underground, where it can stay trapped for thousands of years.
In a Carbon Brief guest post, study authors Dr Matthew Gidden and Prof Joeri Rogelj explain that carbon dioxide removal will only be effective at limiting global temperature rise if captured CO2 is injected “deep underground, where it can stay trapped for thousands of years”.
The guest post warns that “geological carbon storage is not limitless”. It states that “if all available safe carbon storage capacity were used for CO2 removal, this would contribute to only a 0.7C reduction in global warming”.
Top journals
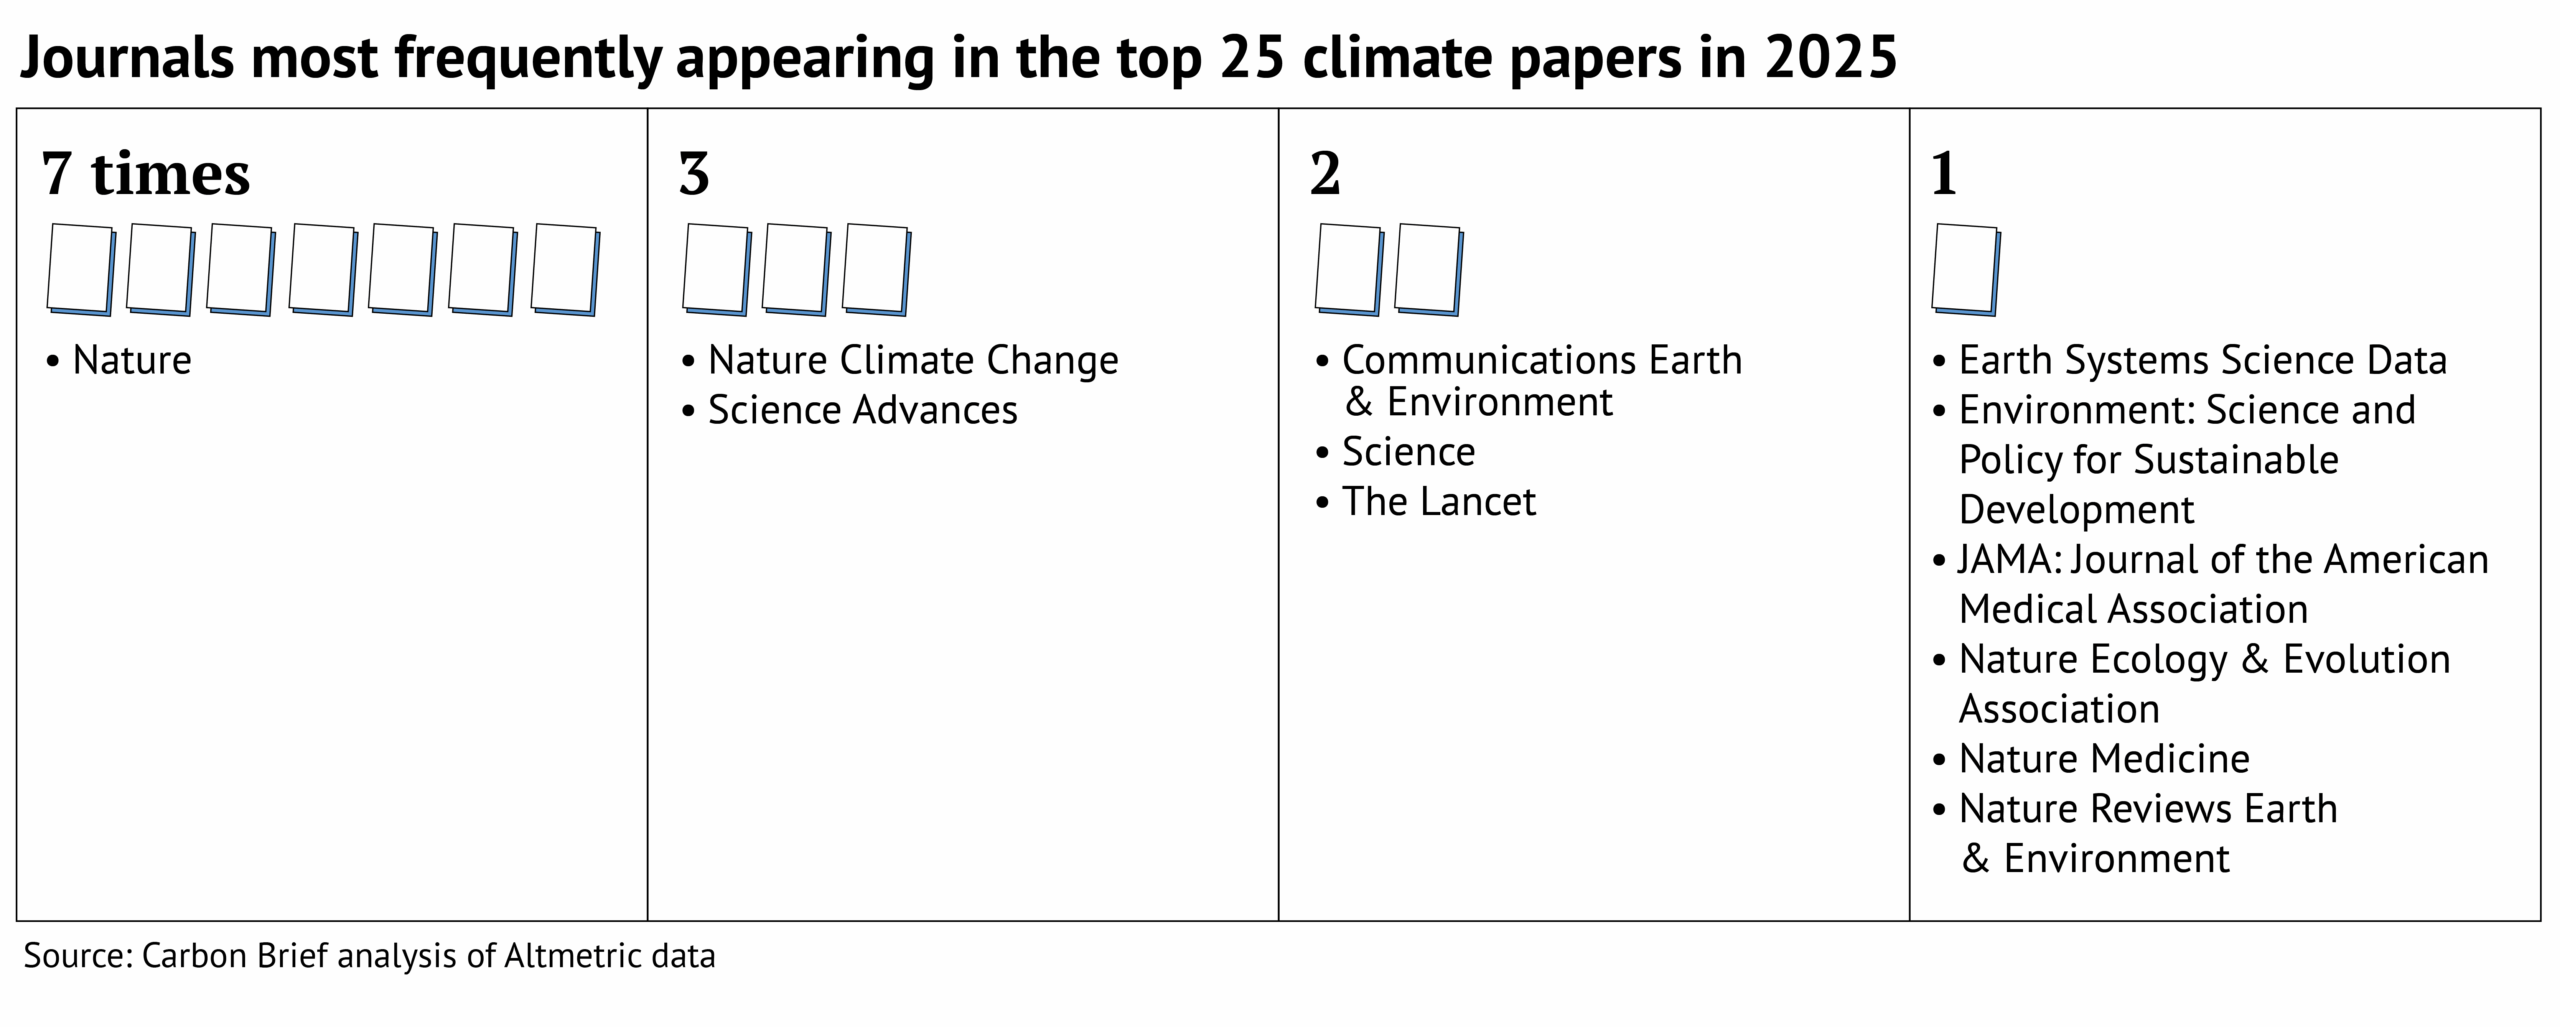
The journal Nature dominates Carbon Brief’s top 25, with seven papers featured.
Many other journals in the Springer Nature stable also feature, including Nature Climate Change (three), Communications Earth & Environment (two), as well as Nature Ecology & Evolution, Nature Medicine and Nature Reviews Earth & Environment (one each).
Also appearing more than once in the top 25 are Science Advances (three), Science (two) and the Lancet (two).
This is shown in the graphic below.
All the final scores for 2025 can be found in this spreadsheet.
Diversity in the top 25
The top 25 climate papers of 2025 cover a huge range of topics and scope. However, analysis of their authors reveals a distinct lack of diversity.
In total, the top 25 includes more than 650 authors – the highest number since Carbon Brief began this analysis in 2022.
This is largely due to a few publications with an exceptionally high number of authors. For example, the 2025 report of the Lancet Countdown on health and climate change has almost 130 authors alone, accounting for almost one-fifth of authors in this analysis.
Carbon Brief recorded the gender and country of affiliation for each of these authors. (The methodology used was developed by Carbon Brief for analysis presented in a special 2021 series on climate justice.)
The analysis reveals that 88% of the authors of the climate papers most featured in the media in 2025 are from institutions in the global north.
Global South: The “global south” is a term used to broadly describe lower-income countries in regions such as Africa, Asia and Latin America. It is often used to denote nations that are either in… Read More
Carbon Brief defines the global north as North America, Europe, Japan, Australia and New Zealand. It defines the global south as Asia (excluding Japan), Africa, Oceania (excluding Australia and New Zealand), Latin America and the Caribbean.
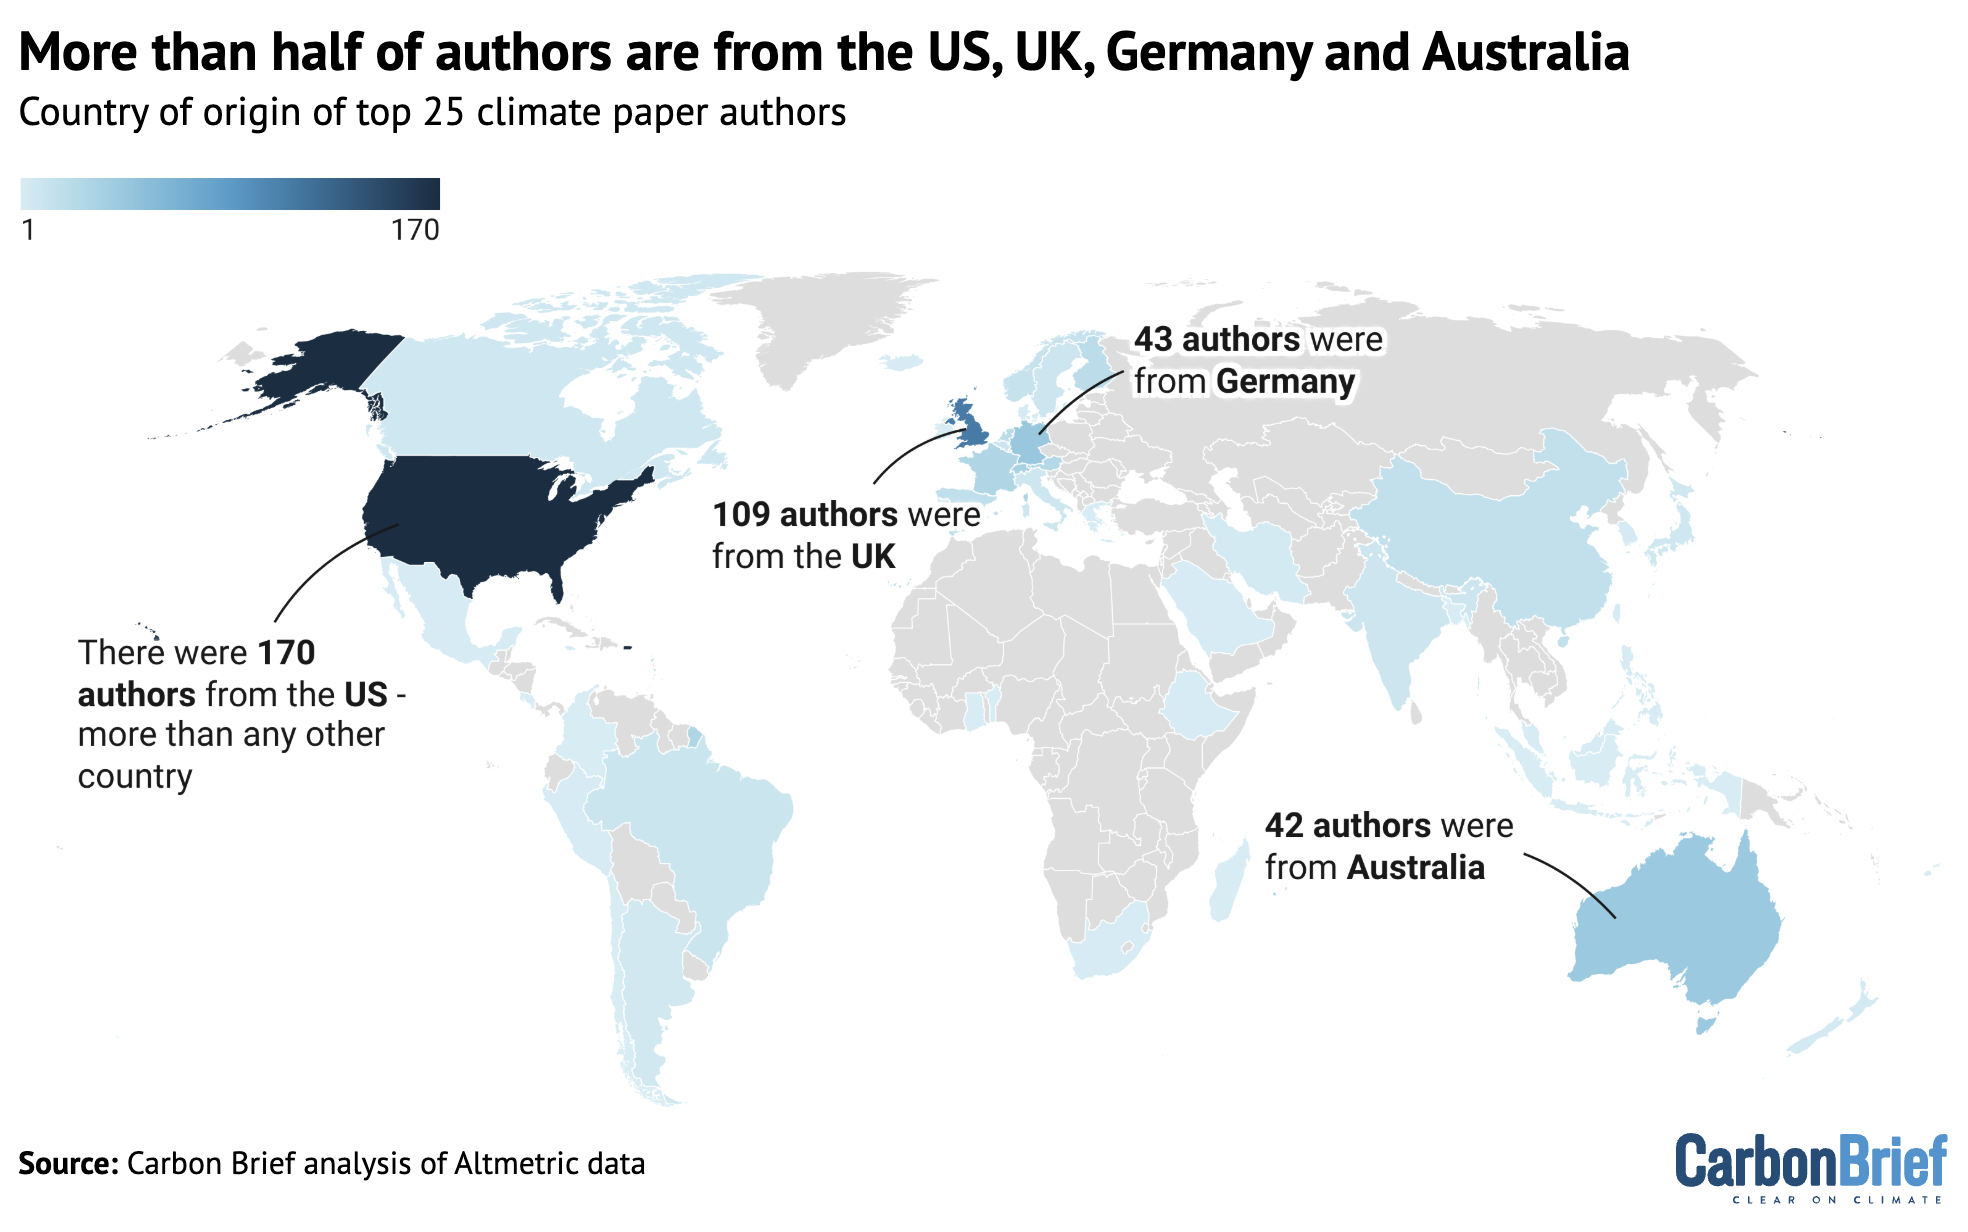
The analysis shows that 53% of authors are from European institutions, while only 1% of authors are from institutions in Africa.
Further data analysis shows that there are also inequalities within continents. The map below shows the percentage of authors from each country, where dark blue indicates a higher percentage. Countries that are not represented by any authors in the analysis are shown in grey.
The number of all authors from the climate papers most featured in the media in 2025. The designations employed and the presentation of the material on this map do not imply the expression of any opinion whatsoever on the part of Carbon Brief concerning the legal status of any country, territory, city or area or of its authorities, or concerning the delimitation of its frontiers or boundaries. Map by Carbon Brief using Datawrapper.
The top-ranking countries on this map are the US and the UK, which account for 26% and 16% of the authors, respectively.
Carbon Brief also analysed the gender of the authors.
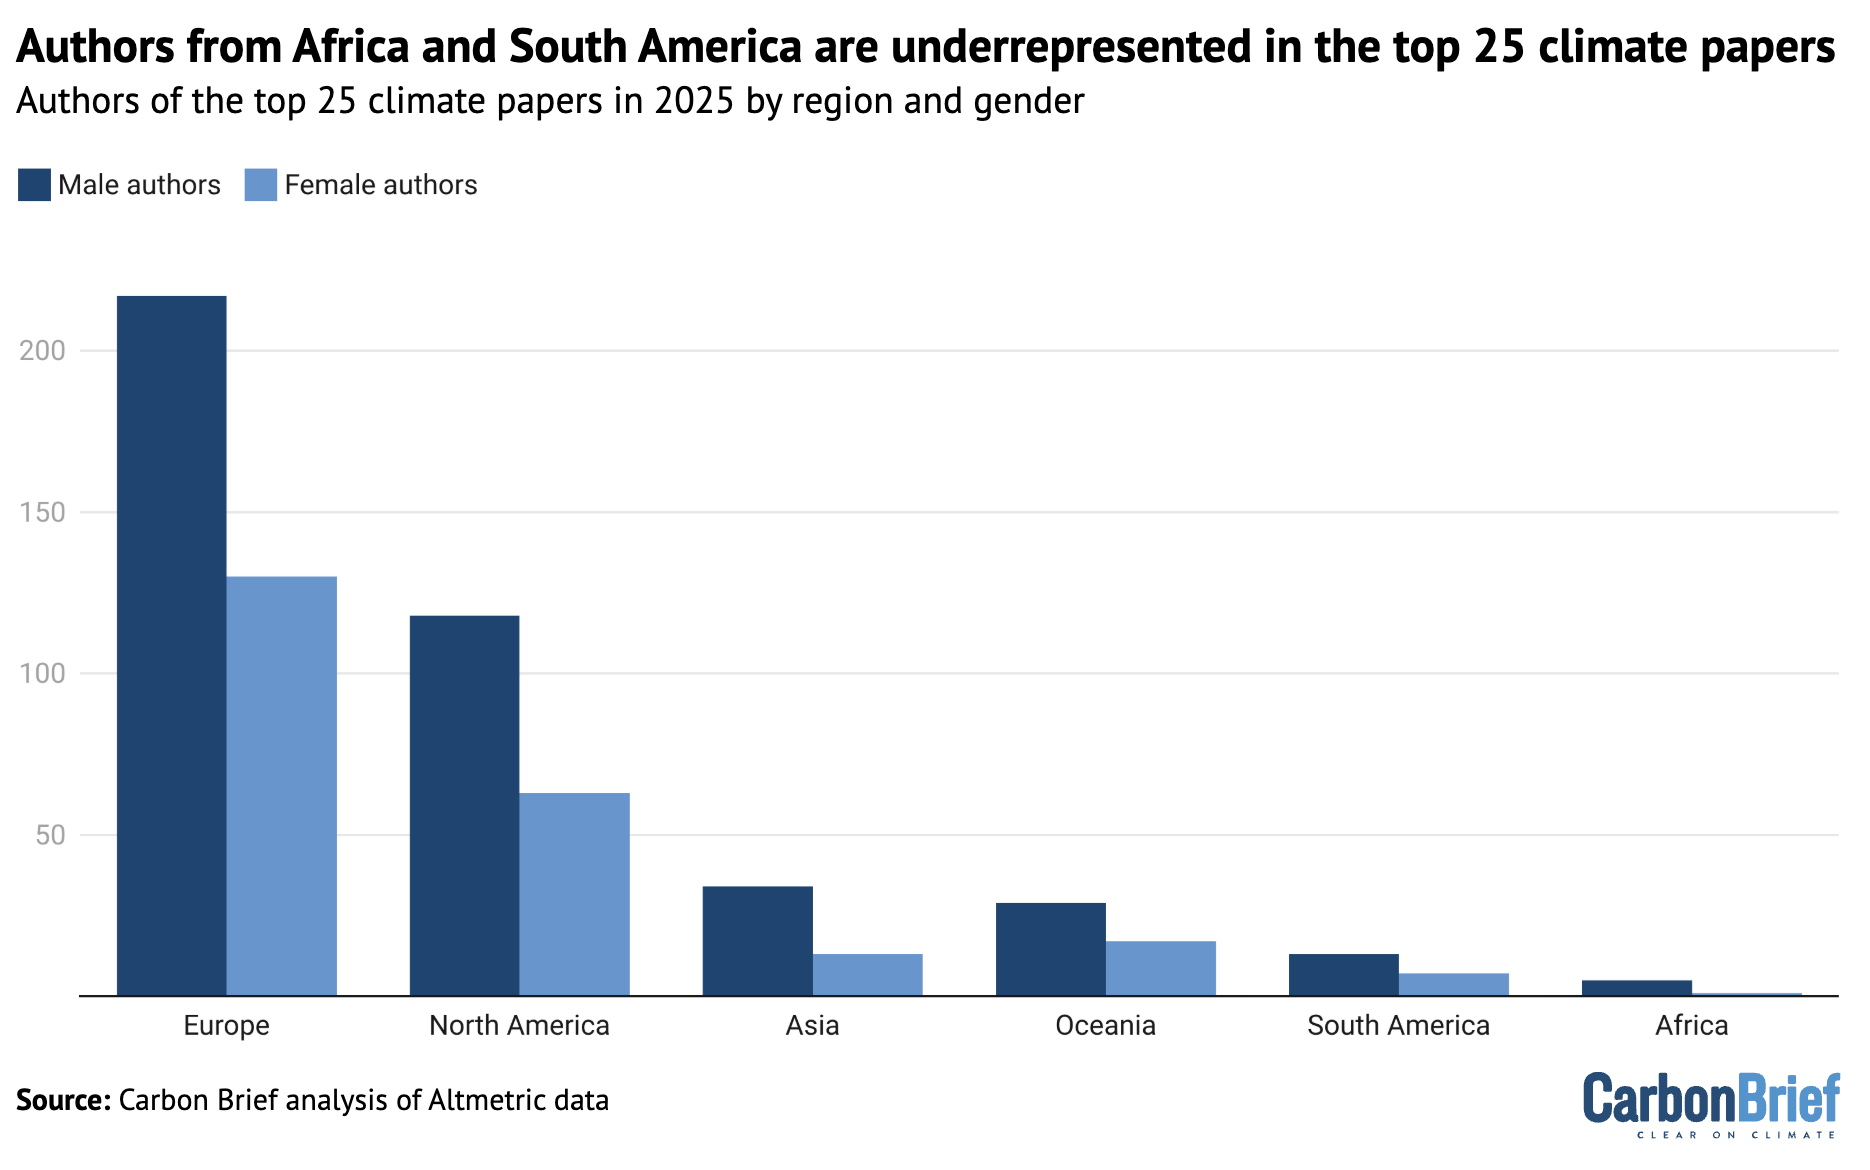
Only one-third of authors from the top 25 climate papers of 2025 are women and only five of the 25 papers list a woman as lead author.
The plot below shows the number of authors from each continent, separated into men (dark blue) and women (light blue).
The number of men (dark blue) and women (light blue) listed as authors in the climate papers most featured in the media in 2025, shown by continent. Chart by Carbon Brief using Datawrapper.
The full spreadsheet showing the results of this data analysis can be found here. For more on the biases in climate publishing, see Carbon Brief’s article on the lack of diversity in climate-science research.
Elon Musk urges you to be a Fascist like him, says that you can ignore facts and reality then.Donald Trump urges you to be a Climate Science denier like him. He says that he makes millions and millions for destroying the planet, Burn, Baby, Burn and Flood, Baby, Flood.Orcas discuss Donald Trump and the killer apes’ concept of democracy. Front Orca warns that Trump is crashing his country’s economy and that everything he does he does for the fantastically wealthy.