A man walks on a hot summer day in Srinagar, India-controlled Kashmir, July 25, 2024
SCIENTISTS say four billion people — about half the world’s population — experienced at least one extra month of extreme heat from May 2024 to May 2025 because of human-caused climate change.
The extreme heat caused illness, death, crop losses and strained energy and healthcare systems, according to the analysis from World Weather Attribution, Climate Central and the Red Cross.
“Although floods and cyclones often dominate headlines, heat is arguably the deadliest extreme event,” the report said.
Many heat-related deaths are unreported or are mislabelled by other conditions like heart disease or kidney failure.
The study shows how much climate change boosted temperatures in an extreme heat event and calculated how much more likely its occurrence was because of climate change.
…
Article continues at https://morningstaronline.co.uk/article/half-world-endured-extra-month-extreme-heat-due-climate-change



Sven Teske, University of Technology Sydney
Is climate action a lost cause? The United States is withdrawing from the Paris Agreement for the second time, while heat records over land and sea have toppled and extreme weather events have multiplied.
In late 2015, nations agreed through the Paris Agreement to try to hold warming well under 2°C and ideally to 1.5°C. Almost ten years later, cutting emissions to the point of meeting the 1.5°C goal looks very difficult.
But humanity has shifted track enough to avert the worst climate future. Renewables, energy efficiency and other measures have shifted the dial. The worst case scenario of expanded coal use, soaring emissions and a much hotter world is vanishingly unlikely.
Instead, Earth is tracking towards around 2.7°C average warming by 2100. That level of warming would represent “unprecedented peril” for life on this planet. But it shows progress is being made.
Global greenhouse gas emissions have risen since industrialisation began around 1850. Carbon dioxide (CO₂) is far and away the most common greenhouse gas we emit, while methane and nitrous oxide also play a role. These gases trap the sun’s heat in the atmosphere, preventing it from radiating back out to space.
In 2023, 41% of the world’s energy-related CO₂ emissions came from coal, mainly for electricity generation. Some 32% came from burning oil in road vehicles, and 21% from natural gas used for heating buildings and industrial processes.
The world is certainly feeling the effects. The World Meteorological Organization confirmed 2024 was the hottest year on record, temporarily hitting 1.5°C over the pre-industrial era. In turn, the world suffered lethal heatwaves, devastating floods and intense cyclones.

In 2014, the world’s peak body for assessing climate science – the Intergovernmental Panel on Climate Change – began using four scenarios called Representative Concentration Pathways (RCPs). These four big picture climate scenarios are based on what actions humanity does or doesn’t take. They comprise:
The numbers refer to how many more watts of heat strike each square metre of the planet.
Of these four, only the RCP 2.6 scenario is compatible with the Paris Agreement’s goal of holding climate change well under 2˚C.
But Earth is tracking towards somewhere between RCP 2.6 and 4.5, which would translate to about 2.7°C of warming by 2100.
IPCC experts also developed five pathways of possible social, economic and political futures to complement the four scenarios.
Of these pathways, we are tracking closest to a middle of the road scenario where development remains uneven, the intensity of resource and energy use declines, and population growth levels off.
While effective, these scenarios are now more than a decade old and need to be updated. In response, my colleagues and I produced the One Earth Climate Model to outline rapid pathways to decarbonise. We set an ambitious carbon budget of 450 gigatonnes of CO₂ before reaching net zero – a pathway even more ambitious than the RCP 2.6.
The US, European Union and China together represent about 28% of the global population, but are responsible for 56% of historic emissions (926 gigatonnes) . The pathways compatible with 1.5°C give them a remaining carbon budget of 243 Gt CO₂. China would require the largest carbon budget to reach decarbonisation.
For this to happen, by 2050, the world would have to be 100% powered by clean sources and phase out fossil fuel use. This would limit global warming to around 1.5°C, with a certainty of just over 50%. We would also have to end deforestation within the same timeframe.
Emissions of carbon dioxide and other greenhouse gases have still not plateaued, despite sharply increasing renewable electricity generation, battery storage and lower-cost electric vehicles.
But there has been real progress. The EU says its emissions fell by 8.3% in 2023 compared to 2022. Europe’s net emissions are now 37% below 1990 levels, while the region’s GDP grew 68% over the same period. The EU remains on track to reach its goal of reducing emissions by at least 55% by 2030.
Australia’s emissions fell by 0.6% last year. The country is now 28.2% below June 2005 levels, which is the baseline set for its Paris Agreement goal of a 43% reduction by 2030.
In the US, emissions are still below pre-pandemic levels and remain about 20% below 2005 levels. Since peaking in 2004, US emissions have trended downward.
The world’s largest emitter, China, is finally cutting its emissions. Huge growth in renewables has now led to the first emissions drop on record, despite surging demand for power. This is good news. For years, China’s domestic emissions remained high despite its leading role in solar, wind, EVs and battery technology.
China produces almost one-third (31%) of the world’s energy-related carbon emissions – not least because it is the workshop of the world. Every cut China makes will have a major global effect.
According to the IPCC, limiting warming to around 1.5°C requires global emissions to peak before 2025 at the latest. It now looks like the peak may occur this year.
Despite daily negative news, the decarbonisation train has left the station. In 2024, renewables accounted for more than 90% of growth in electricity production globally. Electric vehicles became cost competitive, while heat pumps are developing fast and solar is on a winning streak.
So, is it too late to save the climate? No. The technologies we need are finally cheap enough. The sooner we stop climate change from worsening, the more disasters, famine and death we avert. We might not manage 1.5°C or even 2°C, but every tenth of a degree counts. The faster we make the shift, the better our climate future.
Sven Teske, Research Director, Institute for Sustainable Futures, University of Technology Sydney
This article is republished from The Conversation under a Creative Commons license. Read the original article.


Tim Smyth, Plymouth Marine Laboratory
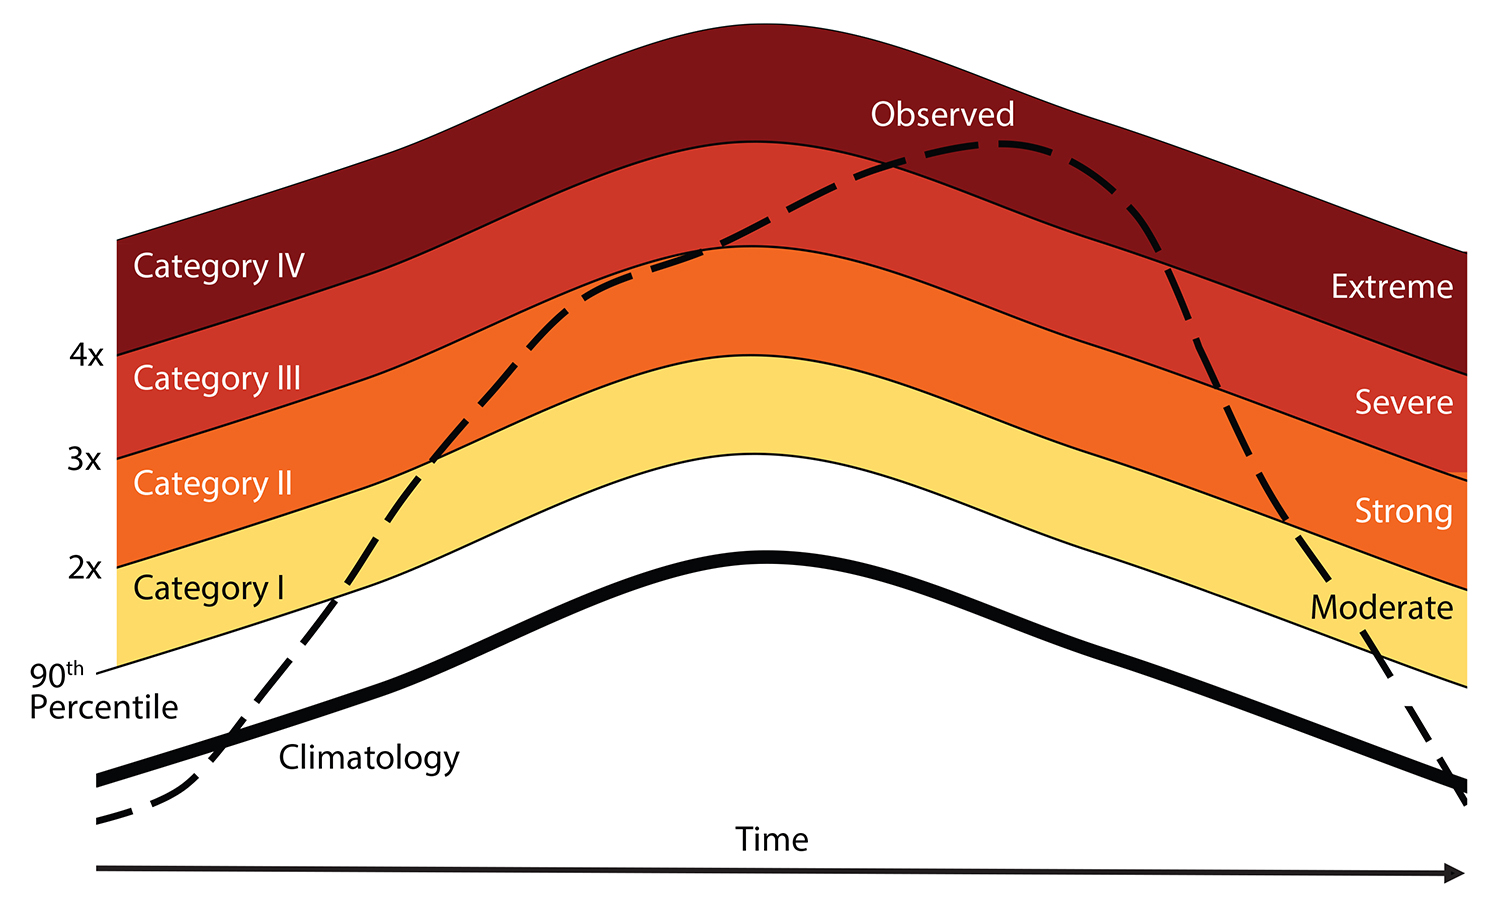
A marine heatwave has been building in the ocean surrounding the UK during an exceptionally warm and dry spring. In other words, the sea surface temperature has been within the top 10% of records for each day of the year since at least the beginning of 2025.
How can we know the temperature of the sea surface over such a large area? Throughout April and May 2025, scientists have been able to map and monitor the seas surrounding the UK via satellites, buoys and other floating devices, plus computer models that simulate the ocean’s physical and chemical properties.
Infrared detectors mounted on pole-orbiting satellites can infer the temperature of the top layer of the ocean and have been doing so continuously since the late 1970s. These sensors cannot “see” through clouds, which is why other sources of data are essential.
These datasets are now 45 years old, which is long enough to create a baseline assessment of the climate during that time. This is important to properly contextualise any departures from the long-term average. Without it, scientists would not know how severe and widespread a marine heatwave truly is.
Thanks to a research station that has been collecting ocean temperatures in the western English Channel for over a century, we know that this part of the sea south of Devon is 2.7°C warmer than the 120-year average, which makes it a category II (“strong”) marine heatwave within the four-category scheme.
Marine heatwaves are different to what we expect in a meteorological heatwave. Since 2023, the waters around the UK have been regularly experiencing marine heatwave conditions, because the data shows that the sea temperature has been in the top 10% of records: but most of us would admit that a sea temperature of 10°C in early March doesn’t exactly conjure up the impression of a heatwave.
The search for better definitions of a marine heatwave continues among scientists, particularly as long-term baseline temperatures continue to warm and the top 10% of warm temperatures shifts upwards. Datasets gathered over several decades in the same place are valuable to this effort.
For example, the Plymouth Marine Laboratory and the Marine Biological Association have been monitoring conditions in the western English Channel for over a century. One of the longest running surveys in the world is situated 20 miles south of Plymouth.
Station E1 was originally founded by the International Council for the Exploration of the Seas in 1902, as part of the English (hence the “E”) effort in ocean observation.
What sets E1 apart is the near continuous nature of its recording since then, the frequency of its data collection (monthly in winter, fortnightly in summer) and its sampling throughout the entire water column (80 metres deep), not just at the surface. This enables scientists to observe the seasonal progression of water mixing and layer formation in that location.
The 123-year old dataset shows that sea surface temperatures have increased markedly within the past 40 years, at a rate of around 0.6°C a decade. Warm anomalies have been increasingly common, and cold anomalies increasingly rare.
Marine heatwave conditions have become increasingly frequent, particularly since 2010. The data also shows that at a depth of 50 metres – well below the top layer of the ocean – temperatures have also increased markedly. The ongoing marine heatwave is not just a surface phenomenon.

The marine heatwave of spring 2025 has resulted from a combination of factors. It boils down to the fact that more energy is being put into the ocean during the day than is being lost at night.
March 2025 was the sunniest March on record (since 1910), with UK Met Office statistics showing there were around 185 hours of sunshine. April set new records for UK solar power generation, with a peak of 12.2 gigawatts (GW) being produced on April 1 out of a possible solar generating capacity of 18 GW.
May continued that trend, with long periods of clear skies under areas of the atmosphere with persistent high pressure. High-pressure areas are also associated with relatively low winds, which restricts the mixing of the warm surface with cooler deep water.
During the spring, rapidly lengthening days mean the time for energy in (day) outweighs energy out (night). It has also been notable that the spring phytoplankton bloom was very early this year (during early March). This is when tiny plant cells at the seawater surface burst into life, like plants on land. The bloom finished relatively early and the surface waters cleared earlier.
The conditions during May at E1 resembled those we would ordinarily associate with midsummer, with the phytoplankton bloom sitting deeper in the water. The clearer water at the surface allowed sunlight to penetrate deeper.
It is evident from our century-plus of measurements that marine heatwaves are happening more frequently and that there appears to be an almost continuous marine heatwave state emerging around the UK.
The intensity of a marine heatwave is generally tied to persistent high-pressure areas remaining static over the UK, but it is still unclear whether or not this is an emerging climate pattern, or just an episode within the general patterns of change within UK seas.
Don’t have time to read about climate change as much as you’d like?
Get a weekly roundup in your inbox instead. Every Wednesday, The Conversation’s environment editor writes Imagine, a short email that goes a little deeper into just one climate issue. Join the 45,000+ readers who’ve subscribed so far.
Tim Smyth, Head of Group: Marine Processes and Observations, Plymouth Marine Laboratory
This article is republished from The Conversation under a Creative Commons license. Read the original article.
Thomas Newsome, University of Sydney and William Ripple, Oregon State University
You don’t have to look far to see what climate change is doing to the planet. The word “unprecedented” is everywhere this year.
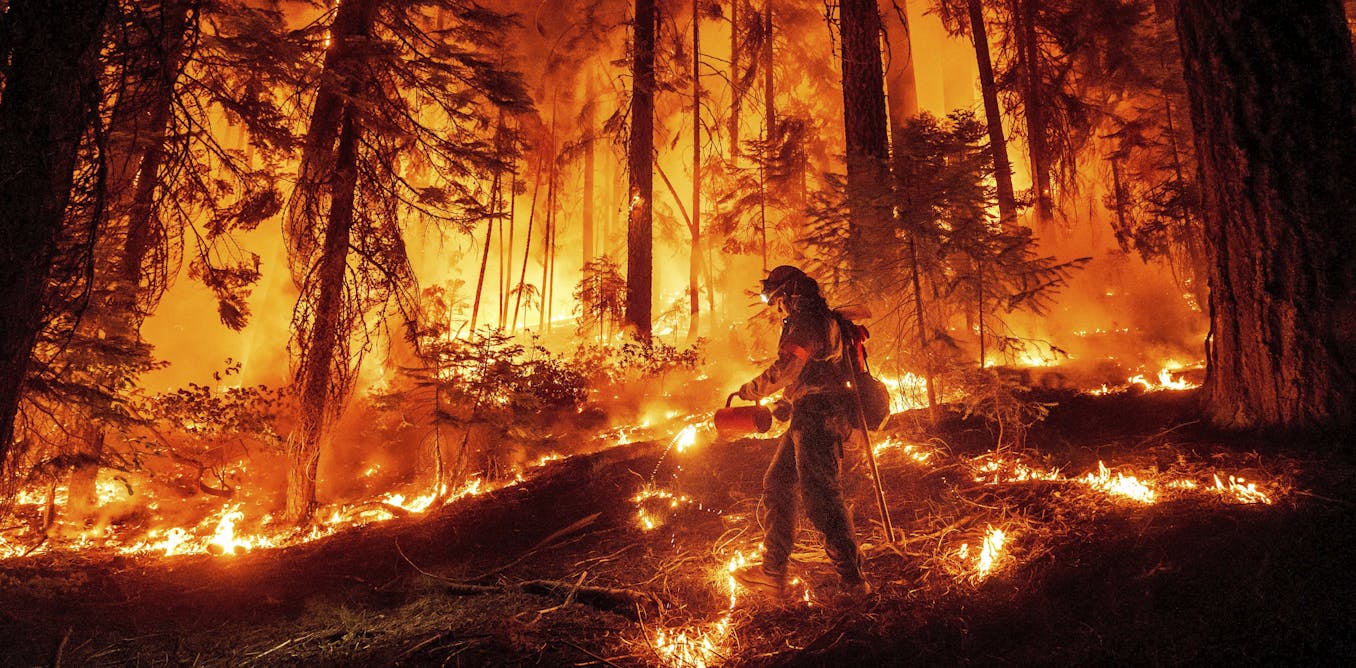
We are seeing unprecedented rapidly intensifying tropical storms such as Hurricane Helene in the eastern United States and Super Typhoon Yagi in Vietnam. Unprecedented fires in Canada have destroyed towns. Unprecedented drought in Brazil has dried out enormous rivers and left swathes of empty river beds. At least 1,300 pilgrims died during this year’s Hajj in Mecca as temperatures passed 50°C.
Unfortunately, we are headed for far worse. The new 2024 State of the Climate report, produced by our team of international scientists, is yet another stark warning about the intensifying climate crisis. Even if governments meet their emissions goals, the world may hit 2.7°C of warming – nearly double the Paris Agreement goal of holding climate change to 1.5°C. Each year, we track 35 of the Earth’s vital signs, from sea ice extent to forests. This year, 25 are now at record levels, all trending in the wrong directions.
Humans are not used to these conditions. Human civilisation emerged over the last 10,000 years under benign conditions – not too hot, not too cold. But this liveable climate is now at risk. In your grandchild’s lifetime, climatic conditions will be more threatening than anything our prehistoric relatives would have faced.
Our report shows a continued rise in fossil fuel emissions, which remain at an all-time high. Despite years of warnings from scientists, fossil fuel consumption has actually increased, pushing the planet toward dangerous levels of warming. While wind and solar have grown rapidly, fossil fuel use is 14 times greater.
This year is also tracking for the hottest year on record, with global daily mean temperatures at record levels for nearly half of 2023 and much of 2024.
Next month, world leaders and diplomats will gather in Azerbaijan for the annual United Nations climate talks, COP 29. Leaders will have to redouble their efforts. Without much stronger policies, climate change will keep worsening, bringing with it more frequent and more extreme weather.
We have still not solved the central problem: the routine burning of fossil fuels. Atmospheric concentrations of greenhouse gases – particularly methane and carbon dioxide – are still rising. Last September, carbon dioxide levels in the atmosphere hit 418 parts per million (ppm). This September, they crossed 422 ppm. Methane, a highly potent greenhouse gas, has been increasing at an alarming rate despite global pledges to tackle it.
Compounding the problem is the recent decline in atmospheric aerosols from efforts to cut pollution. These small particles suspended in the air come from both natural and human processes, and have helped cool the planet. Without this cooling effect, the pace of global warming may accelerate. We don’t know for sure because aerosol properties are not yet measured well enough.
Other environmental issues are now feeding into climate change. Deforestation in critical areas such as the Amazon is reducing the planet’s capacity to absorb carbon naturally, driving additional warming. This creates a feedback loop, where warming causes trees to die which in turn amplifies global temperatures.
Loss of sea ice is another. As sea ice melts or fails to form, dark seawater is exposed. Ice reflects sunlight but seawater absorbs it. Scaled up, this changes the Earth’s albedo (how reflective the surface is) and accelerates warming further.
In coming decades, sea level rise will pose a growing threat to coastal communities, putting millions of people at risk of displacement.
Our report stresses the need for an immediate and comprehensive end to the routine use of fossil fuels.
It calls for a global carbon price, set high enough to drive down emissions, particularly from high-emitting wealthy countries.
Introducing effective policies to slash methane emissions is crucial, given methane’s high potency but short atmospheric lifetime. Rapidly cutting methane could slow the rate of warming in the short term.
Natural climate solutions such as reforestation and soil restoration should be rolled out to increase how much carbon is stored in wood and soil. These efforts must be accompanied by protective measures in wildfire and drought prone areas. There’s no point planting forests if they will burn.
Governments should introduce stricter land-use policies to slow down rates of land clearing and increase investment in forest management to cut the risk of large, devastating fires and encourage sustainable land use.
We cannot overlook climate justice. Less wealthy nations contribute least to global emissions but are often the worst affected by climate disasters.
Wealthier nations must provide financial and technical support to help these countries adapt to climate change while cutting emissions. This could include investing in renewable energy, improving infrastructure and funding disaster preparedness programs.
Internationally, our report urges stronger commitments from world leaders. Current global policies are insufficient to limit warming to 1.5°C above pre-industrial levels.
Without drastic changes, the world is on track for approximately 2.7°C of warming this century. To avoid catastrophic tipping points, nations must strengthen their climate pledges, reduce dependence on fossil fuels, and accelerate the transition to renewable energy.
Immediate, transformative policy changes are now necessary if we are to avoid the worst effects of climate change.
Climate change is already here. But it could get much, much worse. By slashing emissions, boosting natural climate solutions and working towards climate justice, the global community can still fend off the worst version of our future.
Thomas Newsome, Associate Professor in Global Ecology, University of Sydney and William Ripple, Distinguished Professor and Director, Trophic Cascades Program, Oregon State University
This article is republished from The Conversation under a Creative Commons license. Read the original article.