US Border Patrol agents detain an unidentified man of Somali descent in Minneapolis, Minnesota, on January 8, 2026. (Photo by Octavio Jones/AFP via Getty Images)
A new database of sworn affidavits filed by the ACLU shows masked agents detaining citizens based on race without warrants, ignoring IDs, and pointing weapons at them.
Federal agents deployed to Minnesota by the Trump administration are systematically violating the rights of US citizens and lawful residents, according to more than two dozen sworn affidavits made available this week as part of a class action lawsuit against the Department of Homeland Security.
The suit was filed last month by the ACLU of Minnesota and partnered law firms, which said that as part of President Donald Trump’s Operation Metro Surge, “masked federal agents in the thousands are violently stopping and arresting countless Minnesotans based on nothing more than their race and perceived ethnicity, irrespective of their citizenship or immigration status, or their personal circumstances.”
The case was launched by three plaintiffs, which include 20-year-old Mubashir Khalif Hussein, a Somali-born US citizen whose brutal arrest and detention was caught on video in December. He was placed into a headlock by masked agents and brought to an ICE office, where he said he was left in shackles for an hour and a half before being released miles from his home in the freezing cold.
The plaintiffs called it just one example of a “startling pattern of abuse spearheaded by the Department of Homeland Security (DHS) that is fundamentally altering civic life in the Twin Cities and the state of Minnesota.”
On Thursday, the online legal policy journal Just Security published a searchable database of the 29 sworn declarations filed so far as part of the case. Nearly all of them were filed by US citizens, while a few others were permanent legal residents or had pending legal status.
We just published database of @ACLU plaintiffs' sworn declarations of ICE enforcement actions in Minnesota case.
The statements detail numerous allegations that agents violated their basic constitutional rights, including by detaining them without showing a warrant; targeting Somali and Latino individuals based on their appearances; ignoring identifying documents that could prove their legal residency or citizenship; restraining them violently; and pointing weapons at them during searches.
Last year, the Supreme Courtsided with the Trump administration’s claim that when deciding whether to stop someone as part of “roving patrols,” agents had the right to consider certain factors, including “the type of work one does,” a person’s use of Spanish or accented English, or their “apparent race or ethnicity.”
While critics described it as an invitation to blatant and unconstitutional racial profiling and invasions of privacy, Justice Brett Kavanaughwrote in a concurring opinion that the practice should not prove burdensome to those legally in the US: “If the person is a US citizen or otherwise lawfully in the United States, that individual will be free to go after the brief encounter,” he said.
Ryan Goodman, a law professor at New York University and the co-editor-in-chief of Just Security,said that the “sworn affidavits show how, on the ground, this is simply not how ICE operates.”
“They did not identify themselves, and they did not present a warrant. They just opened my car door and started yanking me out of the car. I kept saying over and over that I was a US citizen.”
One 33-year-old Latino citizen who was born in the US was driving to Menards on January 10 when he suddenly found himself boxed in by two cars at a stoplight. Before he knew it, he said agents were banging aggressively on his windows and one had started pointing a gun at him. When he put his vehicle in park, he said the doors opened automatically.
“When the doors unlocked, the agents did not ask me anything, they did not identify themselves, and they did not present a warrant. They just opened my car door and started yanking me out of the car,” he said. “I kept saying over and over that I was a US citizen.”
“Once they did get my seatbelt off and finally [pulled] me out of the car, they threw me to the ground and pinned me,” he continued. “They were pulling on my arms so tight to put on the handcuffs. They ripped my jacket, and it was torn up. My wallet fell on the ground. I was still repeating that I am a US citizen. I repeated it over and over. They never asked for or looked at my identification.”
The agents hauled the man into their car and began driving him around and interrogating him for about 20 minutes. He said the first question they asked him was his name.
“It seemed if they were going to violently arrest me before even looking at my identification, that they should have known who I was,” the victim said.
Agents eventually realized they’d been searching for another person with the same name and birthdate. They drove their captive behind a warehouse, where nobody could see, and released him. But another agent had taken his car from the intersection. An agent said he’d only give it back if the agent could scan his face, which he did.
“I felt traumatized. My arm hurt, I had bruises from the handcuffs. They were so tight that half of my hand was numb for a few days. I guess it stopped the circulation to my hands while I was handcuffed. I had cuts on my face and hands,” the victim said. “Since this happened to me, I have to pass through that spot every time I drive to work. I keep going back to it and reliving it in my mind.”
According to the database, at least five other US citizens, lawful residents, or legal asylum seekers also claimed in court that they’d had weapons pointed at them by agents during their stops.
Two other US citizens and one lawful permanent resident detailed being subject to physical force during stops.
One 53-year-old Somali man, a US citizen since 2008, said he was physically grabbed and dragged from his car, handcuffed, and pinned against the vehicle by masked agents.
“One officer pressed his knee into my back,” he said. When I screamed out in pain, another officer put his elbow into my neck, and one of the officers yelled at me, ‘Shut the fuck up, son of a bitch!’ One of the officers responded, ‘Why don’t you go back to your country?’“
“I believe that I was stopped solely because of the color of my skin and our appearance, including wearing a hijab.”
One 22-year-old Somali-American citizen who was born in Minnesota said that on January 21, five agents hopped out of their car with multiple guns drawn as she was on her way to work.
She said they demanded to see proof of her citizenship, but rejected her valid ID, claiming it was fake. They demanded to see her passport, which US citizens are not required to carry under US law. The agents told her they did not believe she was a US citizen because of her “accent.”
“I believe that I was stopped solely because of the color of my skin and our appearance, including wearing a hijab,” she said. “It was clear that the ICE agents did not know who I was when they stopped me. I had not violated any traffic laws, and the vehicle I was driving was registered to my mother, who is a United States citizen.”
It’s one of at least five cases in the database in which agents dismissed proof of a citizen or legal resident’s status.
There have also been many other documented instances, including some caught on video, in which agents have detained a citizen or legal resident or refused to let them go because they believed the person’s “accent” did not sound American.
WATCH: CNN airs unearthed footage of a ICE Border Patrol agent harassing a ride share driver:
"If you were from this country, you would know I'm an immigration officer… I can hear you don't have the same accent as me." pic.twitter.com/CZ35TKPa6T
All 29 of those who filed affidavits in the case have alleged unconstitutional racial profiling.
One 25-year-old Somali man, a US citizen born in Atlanta, said a group of masked agents accosted him and his mother while he was shoveling snow.
He said they were joined by a pair of unmasked men who appeared to be livestreaming and helped the agents to box him in. He later identified one of them as a right-wing YouTube influencer named Ben Bergquam.
Even though the vast majority of Somalis living in the US are citizens, he said the agents and the streamers were laughing and referring to him and his mother as “illegal aliens.”
“I was unsure if I was going to be seriously injured or killed.”
At least 12 people in the lawsuit have filed sworn testimony stating that agents forced them to stop while they were driving.
In one case, a Hispanic US citizen said that after following him for a few blocks, agents put on their lights and “rammed” his car off the road.
“An agent came up to my window, asking if I was a citizen. I was furious. I told them I was a citizen and they damaged my car,” he said. “Instead of apologizing, they demanded that I produce documents to prove I was a US citizen. I was too angry. I told them again that I was a US citizen and I didn’t have to prove it to them.”
He said the episode lasted 45-60 minutes, with agents repeatedly demanding his ID, name, and place of birth. Eventually, he says, they confirmed his citizenship by taking photos and videos of him and scanning his license plate.
He said agents told him they would pay for the damages to his car, but that they drove away without providing any insurance information.
“Even though I am a United States citizen and I was carrying proof of my citizenship with me, ICE agents didn’t believe me,” he said. “I felt intense fear and shock. I was unsure if I was going to be seriously injured or killed.”
The affidavits were filed as part of the caseHussen v. Noem, which claims that agents have violated Minnesotans’ rights to equal protection and against unreasonable searches and seizures. A hearing is scheduled to take place later this month.
“The government can’t stop and arrest people based on the color of their skin, or arrest people with no probable cause,” said Kate Huddleston, senior staff attorney with the ACLU’s Immigrants’ Rights Project. “These kinds of police-state tactics are contrary to the basic principles of liberty and equality that remain a bedrock of our legal system and our country.”
Donald Fuhrump says that Amerikkka doesn’t bother with crimes or charges anymore, not being 100% Amerikkkan and opposing his real estate intentions is enough.Elon Musk urges you to be a Fascist like him, says that you can ignore facts and reality then.Orcas discuss Donald Trump and the killer apes’ concept of democracy. Front Orca warns that Trump is crashing his country’s economy and that everything he does he does for the fantastically wealthy.
Demonstrators take part in a protest against Immigration and Customs Enforcement in Milan, Italy on February 6, 2026. (Photo by Mattia Rinaldi/NurPhoto via Getty Images)
One Olympic athlete, a skier representing Britain, registered his disgust with US immigration enforcement agents by urinating the message “Fuck ICE” in the snow.
Hundreds of protesters gathered in the streets of Milan, Italy on Friday to protest the presence of US Immigration and Customs Enforcement agents at the 2026 Winter Olympics, with protesters waving “FCK ICE” signs and condemning Trump administration officials—including Vice President JD Vance and Secretary of State Marco Rubio.
Reutersreported that demonstrators rallying ahead of the opening ceremony could be heard “blowing plastic whistles, which have become a symbol of anti-ICE rallies in the US.” The Trump administration said a small group of ICE officers would be traveling to Milan to help provide security for Vance and Rubio, who arrived in the city on Thursday.
One demonstrator, a Minnesotan currently studying in Europe, told the outlet that she “thought that this was a good opportunity to show that the rest of the world is not okay with what’s happening in Minnesota.”
“It’s not okay to just acquiesce and go with the status quo,” the protester said.
Demonstrators take part in a protest against US Immigration and Customs Enforcement in Milan, Italy on February 6, 2026. (Photo by Mattia Rinaldi/NurPhoto via Getty Images)
The protests came a day after Gus Kenworthy, a skier representing Britain, urinated the message “Fuck ICE” in the snow ahead of the winter games’ opening festivities and urged Americans to pressure their representatives to rein in the agency.
“Innocent people have been murdered, and enough is enough,” Kenworthy wrote on social media. “We can’t wait around while ICE continues to operate with unchecked power.”
Donald Fuhrump says that Amerikkka doesn’t bother with crimes or charges anymore, not being 100% Amerikkkan and opposing his real estate intentions is enough.Elon Musk urges you to be a Fascist like him, says that you can ignore facts and reality then.Orcas discuss Donald Trump and the killer apes’ concept of democracy. Front Orca warns that Trump is crashing his country’s economy and that everything he does he does for the fantastically wealthy.
The UK’s climate saw a record-breaking 2025, with the year being both the warmest and sunniest seen since observations began.
The year 2025 has joined 2024, 2023, 2022 and 2014 in the UK’s top-five warmest years.
In this review, we take a look back at the UK’s climate in 2025 and place the record-breaking year in the context of human-caused climate change. We find:
It was the warmest and sunniest year on record. January and September were the only months that were cooler than average.
A Met Office attribution study estimates that 2025’s average temperature would have been exceptionally unlikely in pre-industrial times – but could now occur, on average, every three years.
Spring was the warmest on record, breaking a record set in 2024.
Spring was not only the sunniest on record, but the fourth-sunniest season ever recorded, after the summers of 1976, 1996 and 1911.
It was the warmest summer on record. The summer temperature record was made around 70 times more likely due to human-induced climate change.
The persistent high-pressure systems in spring and summer, which contributed to the warm and sunny conditions, also resulted in an extended dry spell – including the driest spring since 1974.
Wetter conditions at the end of the year alleviated some of the rain shortfall. The year concluded with 90% of average annual rainfall.
Storm Éowyn in late January was the most powerful wind storm in over a decade and the most severe storm in Northern Ireland since 1998.
Storm Floris in early August was not unprecedented for a storm, but was one of the most severe wind storms to affect Scotland during the summer.
Storm Amy in early October hit north-western parts of the UK, with heavy rain falling widely, resulting in the wettest day of the year for the UK overall.
The Met Office relies on the long-running HadUK-Grid dataset to place recent UK weather and climate into its historical context. The gridded, geographically complete dataset combines observational data for monthly temperature since 1884, rainfall since 1836 and sunshine since 1910.
Unless stated otherwise, the rankings of events and statements (such as “warmest on record”) in this article relate to the HadUK-Grid series.
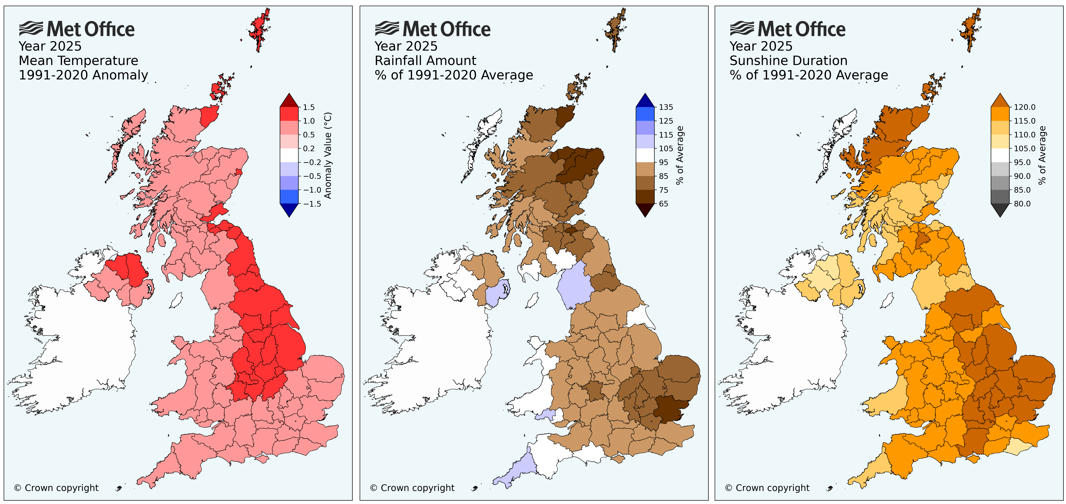
The “climate anomaly” maps below show the difference between the average temperature (left), rainfall total (middle) and sunshine duration (right) between 2025 and the 1991-2020 period. In other words, they show how much warmer, cooler, wetter, drier, sunnier or cloudier the year was than average for each county of the UK.
Maps showing anomalies in 2025 relative to a 1991-2020 reference period for temperature (C), precipitation (%) and sunshine (%). The darker shading indicates a greater departure from average. Credit: Met Office
The maps show that the whole country was warmer than average, with central and north-east England, parts of Northern Ireland and the tip of north-west Scotland, Orkney and Shetland seeing the greatest change.
The UK overall had 90% of average rainfall. The driest regions relative to average were around Essex, Moray and Aberdeenshire, which received less than 75% of normal annual rainfall.
In contrast, some western counties were slightly wetter than average – including Cornwall (110%) and Cumbria (107%).
Sunshine was above average across the UK, with eastern England and north Scotland exceeding 120% of the average.
Attribution
The UK’s absolute temperature averaged at 10.09C in 2025. This follows 2022 (at 10.03C) as the second time that the annual average temperature has exceeded 10C.
In our analysis of the UK’s climate in 2022 for Carbon Brief, we reported on a Met Office attribution study that found that human-caused climate change had increased the likelihood of UK annual absolute temperature averaging above 10C by a factor 160.
That study concluded that exceeding 10C – while unprecedented in the historical observational record – would become increasingly common and would likely occur every three-to-four years.
Three years on from that analysis and the 10C threshold has been breached for a second time – and an updated attribution analysis has been produced exploring the likelihood of a return of temperatures above the 10.09C recorded in 2025.
The study, which uses the same methodology as the 2022 paper, finds that UK annual mean temperatures above 10.09C are estimated to occur approximately every three years in the current climate. In contrast, they would have occurred around every 780 years in pre-industrial times.
Human-caused climate change has, therefore, increased the probability of average temperatures in excess of 10.09C by a factor of 260.
These results show that 2025’s record-breaking annual temperature – while unprecedented in the historical observational record – should be considered fairly normal in the current climate.
Climate projections indicate that, by the later part of the 21st century, a year like 2025 could be a relatively cool year.
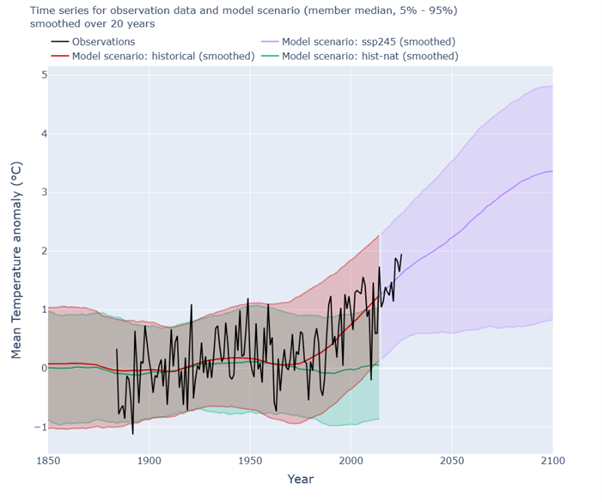
The figure below compares observations of UK annual average temperatures (black line) – relative to the long-term average – to climate model simulations that include (red/purple) or exclude (green) human-caused emissions of greenhouse gases and land-use change.
The green and red curves start to diverge from around the 1980s, suggesting that human influence is indeed the dominant factor in the warming trend. The shaded range of the simulations show that in our current and future climate, much warmer years than 2025 are plausible.
Colder years are also still possible, but it is much less likely that we would experience a cold year like 2010 – and exceptionally unlikely for a year to be in the top-10 coldest years for the UK. The most recent year to feature in the top-10 coldest years was 1963.
Timeseries of the UK annual mean temperature anomaly (w.r.t. 1901 – 1930). Observational data from HadUK-Grid (black). Simulations from the CMIP6 historical simulation including natural and human-caused drivers (red), SSP2-4.5 projections of future climate based on a “medium” emissions scenario (purple) and “hist-nat” simulations that include only natural drivers of climate such as solar and volcanic activity (green). Simulation data is represented as median values and filled 5-95th percentile ranges explored by members of the multi-model ensemble. Percentiles of simulation data are smoothed with a rolling window of 20 years, with historical and SSP2-4.5 combined into one continuous series. Observed data runs from 1884-2025. Credit: Met Office
Warmer, wetter, sunnier
Four of the UK’s last five years all appear in the top-five warmest years since 1884.
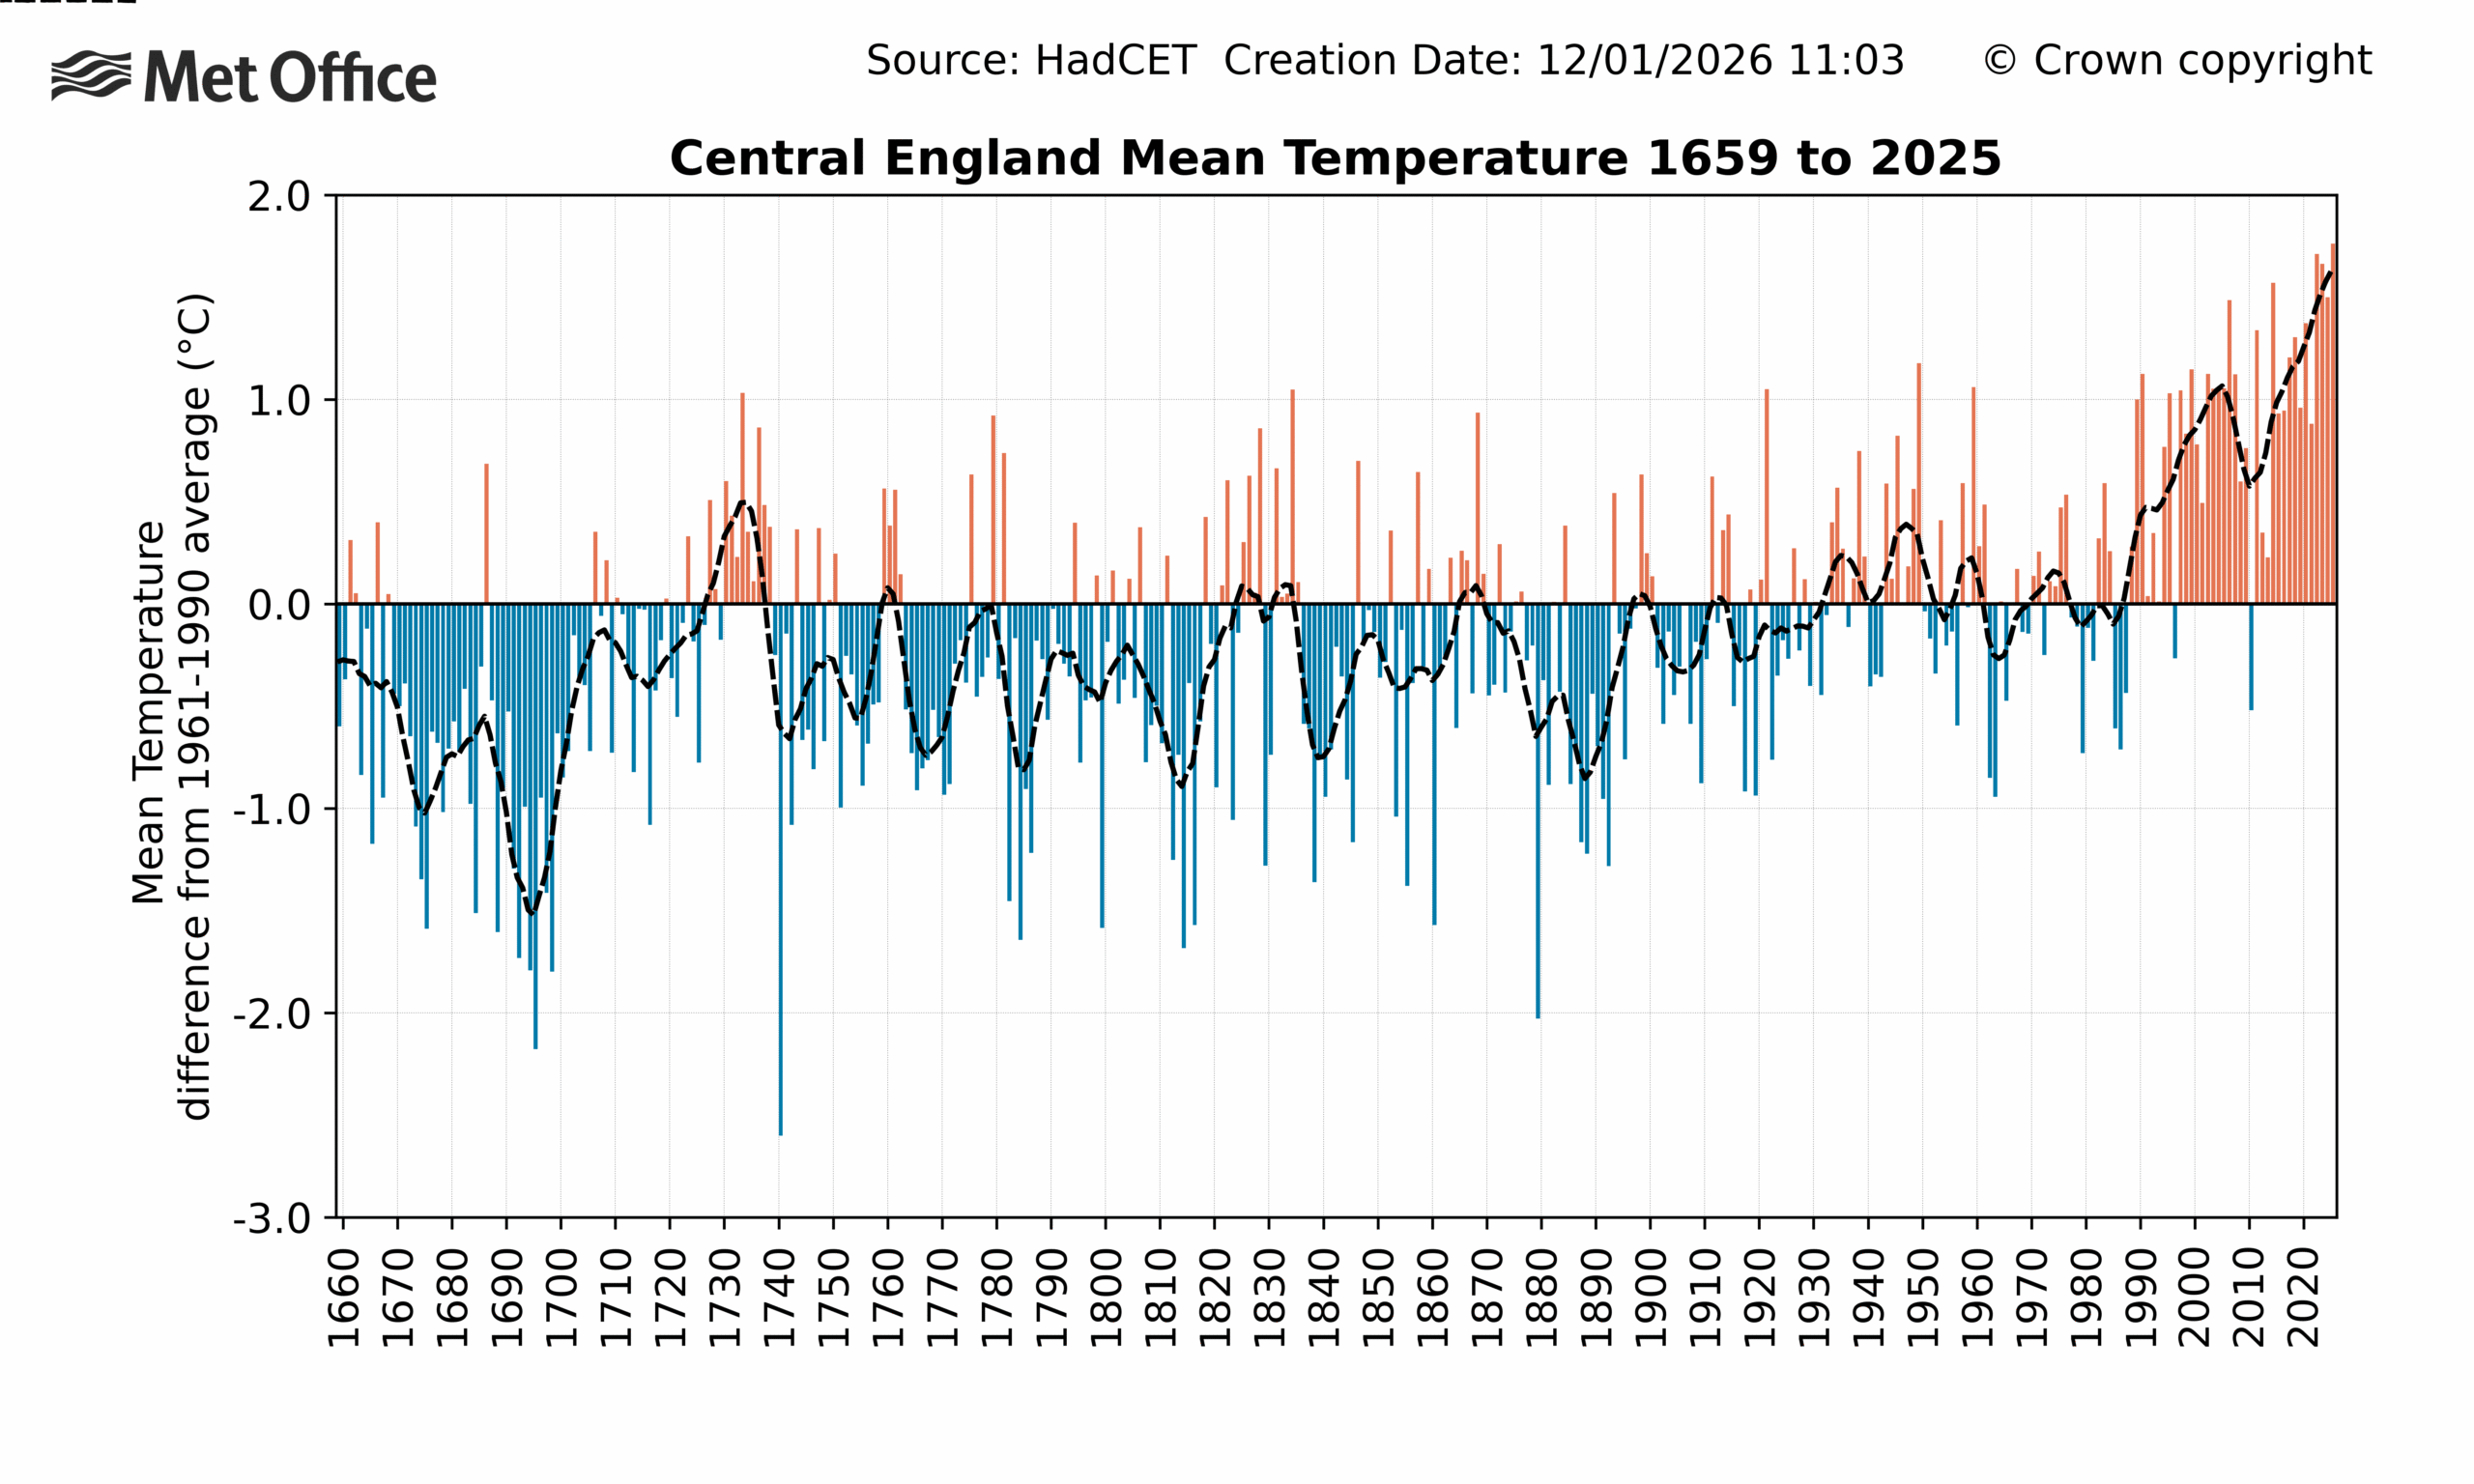
The Central England Temperature (CET) series is the longest continuous instrumental climate record in the world, dating back to 1659. Covering a region roughly enclosed by Lancashire, London and Bristol, it does not represent the whole of the UK. However, when averaged across a year and analysed across centuries, it does provide a multi-century perspective that is representative of climate variations and changes that impacted the UK.
As with the HadUK-Grid temperature record, the CET series also identifies 2025 as the warmest year on record. The longer-running temperature series identifies the same five years – in the same order – as the warmest on record. This is shown in the table below.
Year
UK (from HadUK-Grid)
Central England Temperature
2025
10.09C
11.23C
2022
10.03C
11.18C
2023
9.97C
11.13C
2014
9.88C
11.04C
2024
9.79C
10.96C
The graph below of the CET series shows that temperatures recorded in recent years are well outside the range of variability recorded over more than 300 years.
Average temperature anomalies (relative to a 1961-90 average) for each year in the CET series from 1659 to 2025. Colours show years that are above (red) or below (blue) average. The dashed line is a smoothed series to show the decadal variations and trend. Credit: Met Office
However, the UK is not only warming, it is also getting wetter and sunnier. The year 2025 was relatively dry, recording 90% of average rainfall. This made it the driest year recorded since 2010 and put it in contrast to relatively wet years in 2023 and 2024.
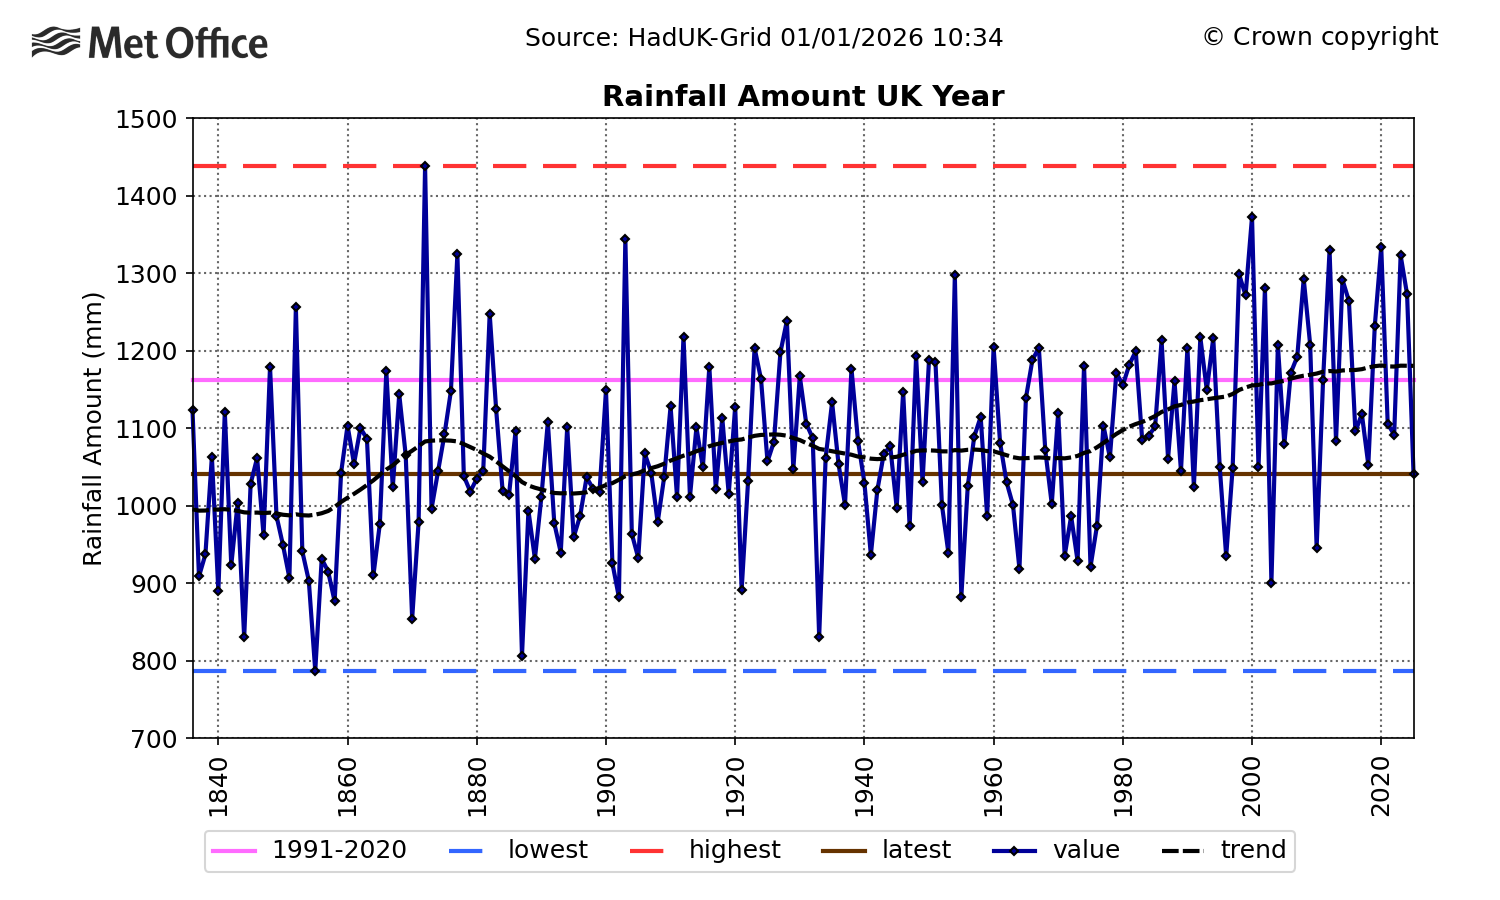
The longer-term trend can be seen in the figure below, which shows that 2025 was relatively dry compared to recent decades, but not exceptional in the longer-term historical context.
The last time the UK had a year in the top-10 driest was in 1955, whereas all five of the top-10 wettest years have occurred this millennium. The wettest year on record still stands as 1872.
Timeseries of UK total rainfall from 1836 to 2025. The trend is represented by a black dashed line, the 1991-2020 average is shown in pink and the highest and lowest values in the series are shown by the red and blue dashed lines, respectively. The 2025 value is represented by the horizontal brown line. Credit: Met Office
The drivers of annual rainfall trends are more complex than for temperature.
A significant factor in rainfall trends is a warming atmosphere’s ability to hold more moisture. However, this does not completely account for recent increases in rainfall.
Large-scale atmospheric circulation patterns – particularly features such as the jet stream and associated storm tracks across the North Atlantic – also play a crucial role. These are influenced by annual and decadal fluctuations in the Earth’s climate, as well as human-caused climate change.
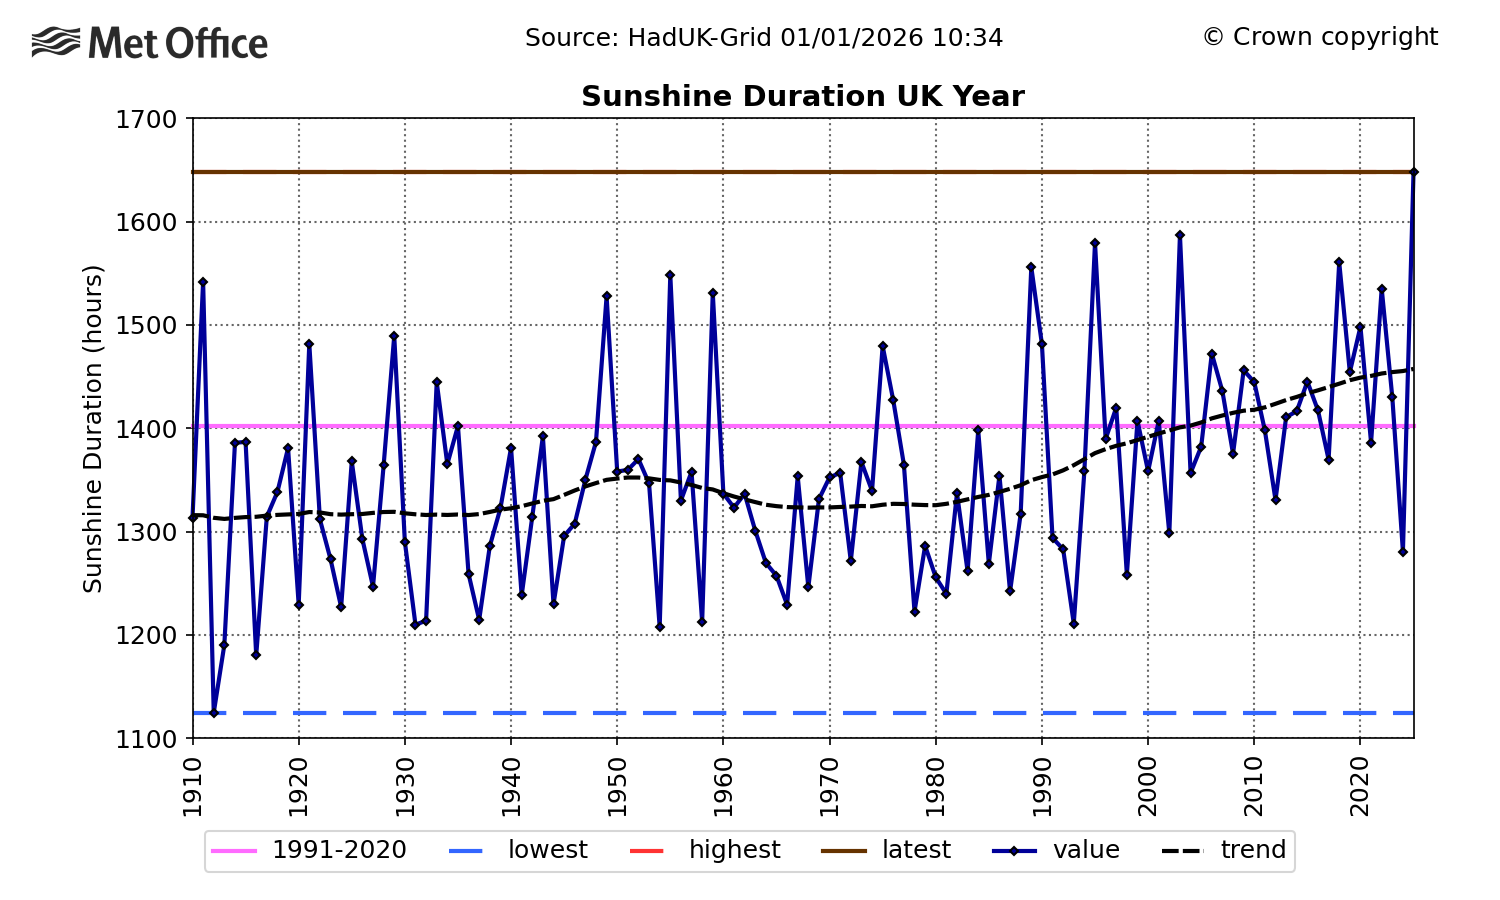
UK annual sunshine totals have also been rising since the 1980s, with 2025 setting a record by a considerable margin. This is in sharp contrast to 2024, which was the dullest year since 1998. This is shown in the graph below, where the dotted line shows the underlying long-term trend, with year-to-year variations removed.
Timeseries of UK total annual sunshine hours from 1910 to 2025. The trend is represented by a black dashed line, the 1991-2020 average is shown in pink and the highest and lowest values in the series are shown by the red and blue dashed lines, respectively. The 2025 value is represented by the horizontal brown line (which covers the red line for the highest in the record). Credit: Met Office
The cause of the sunshine trend is also uncertain, with both natural climate variability and human activity (through reduced regional air pollution caused by a reduction in aerosol emissions) potential contributors. Climate projections do not provide any strong evidence for how sunshine trends might develop.
The year in storms
The Met Office has been naming storms since 2015. Each storm-naming period runs from September to August.
(For more on storm naming in the UK, read Carbon Brief’s explainer.)
The criteria for storm naming has changed over time. It accounts for meteorological conditions, as well as the potential severity of impacts. As a result, comparisons between years can indicate relative levels of storm activity, but should not be done on a like-for-like basis.
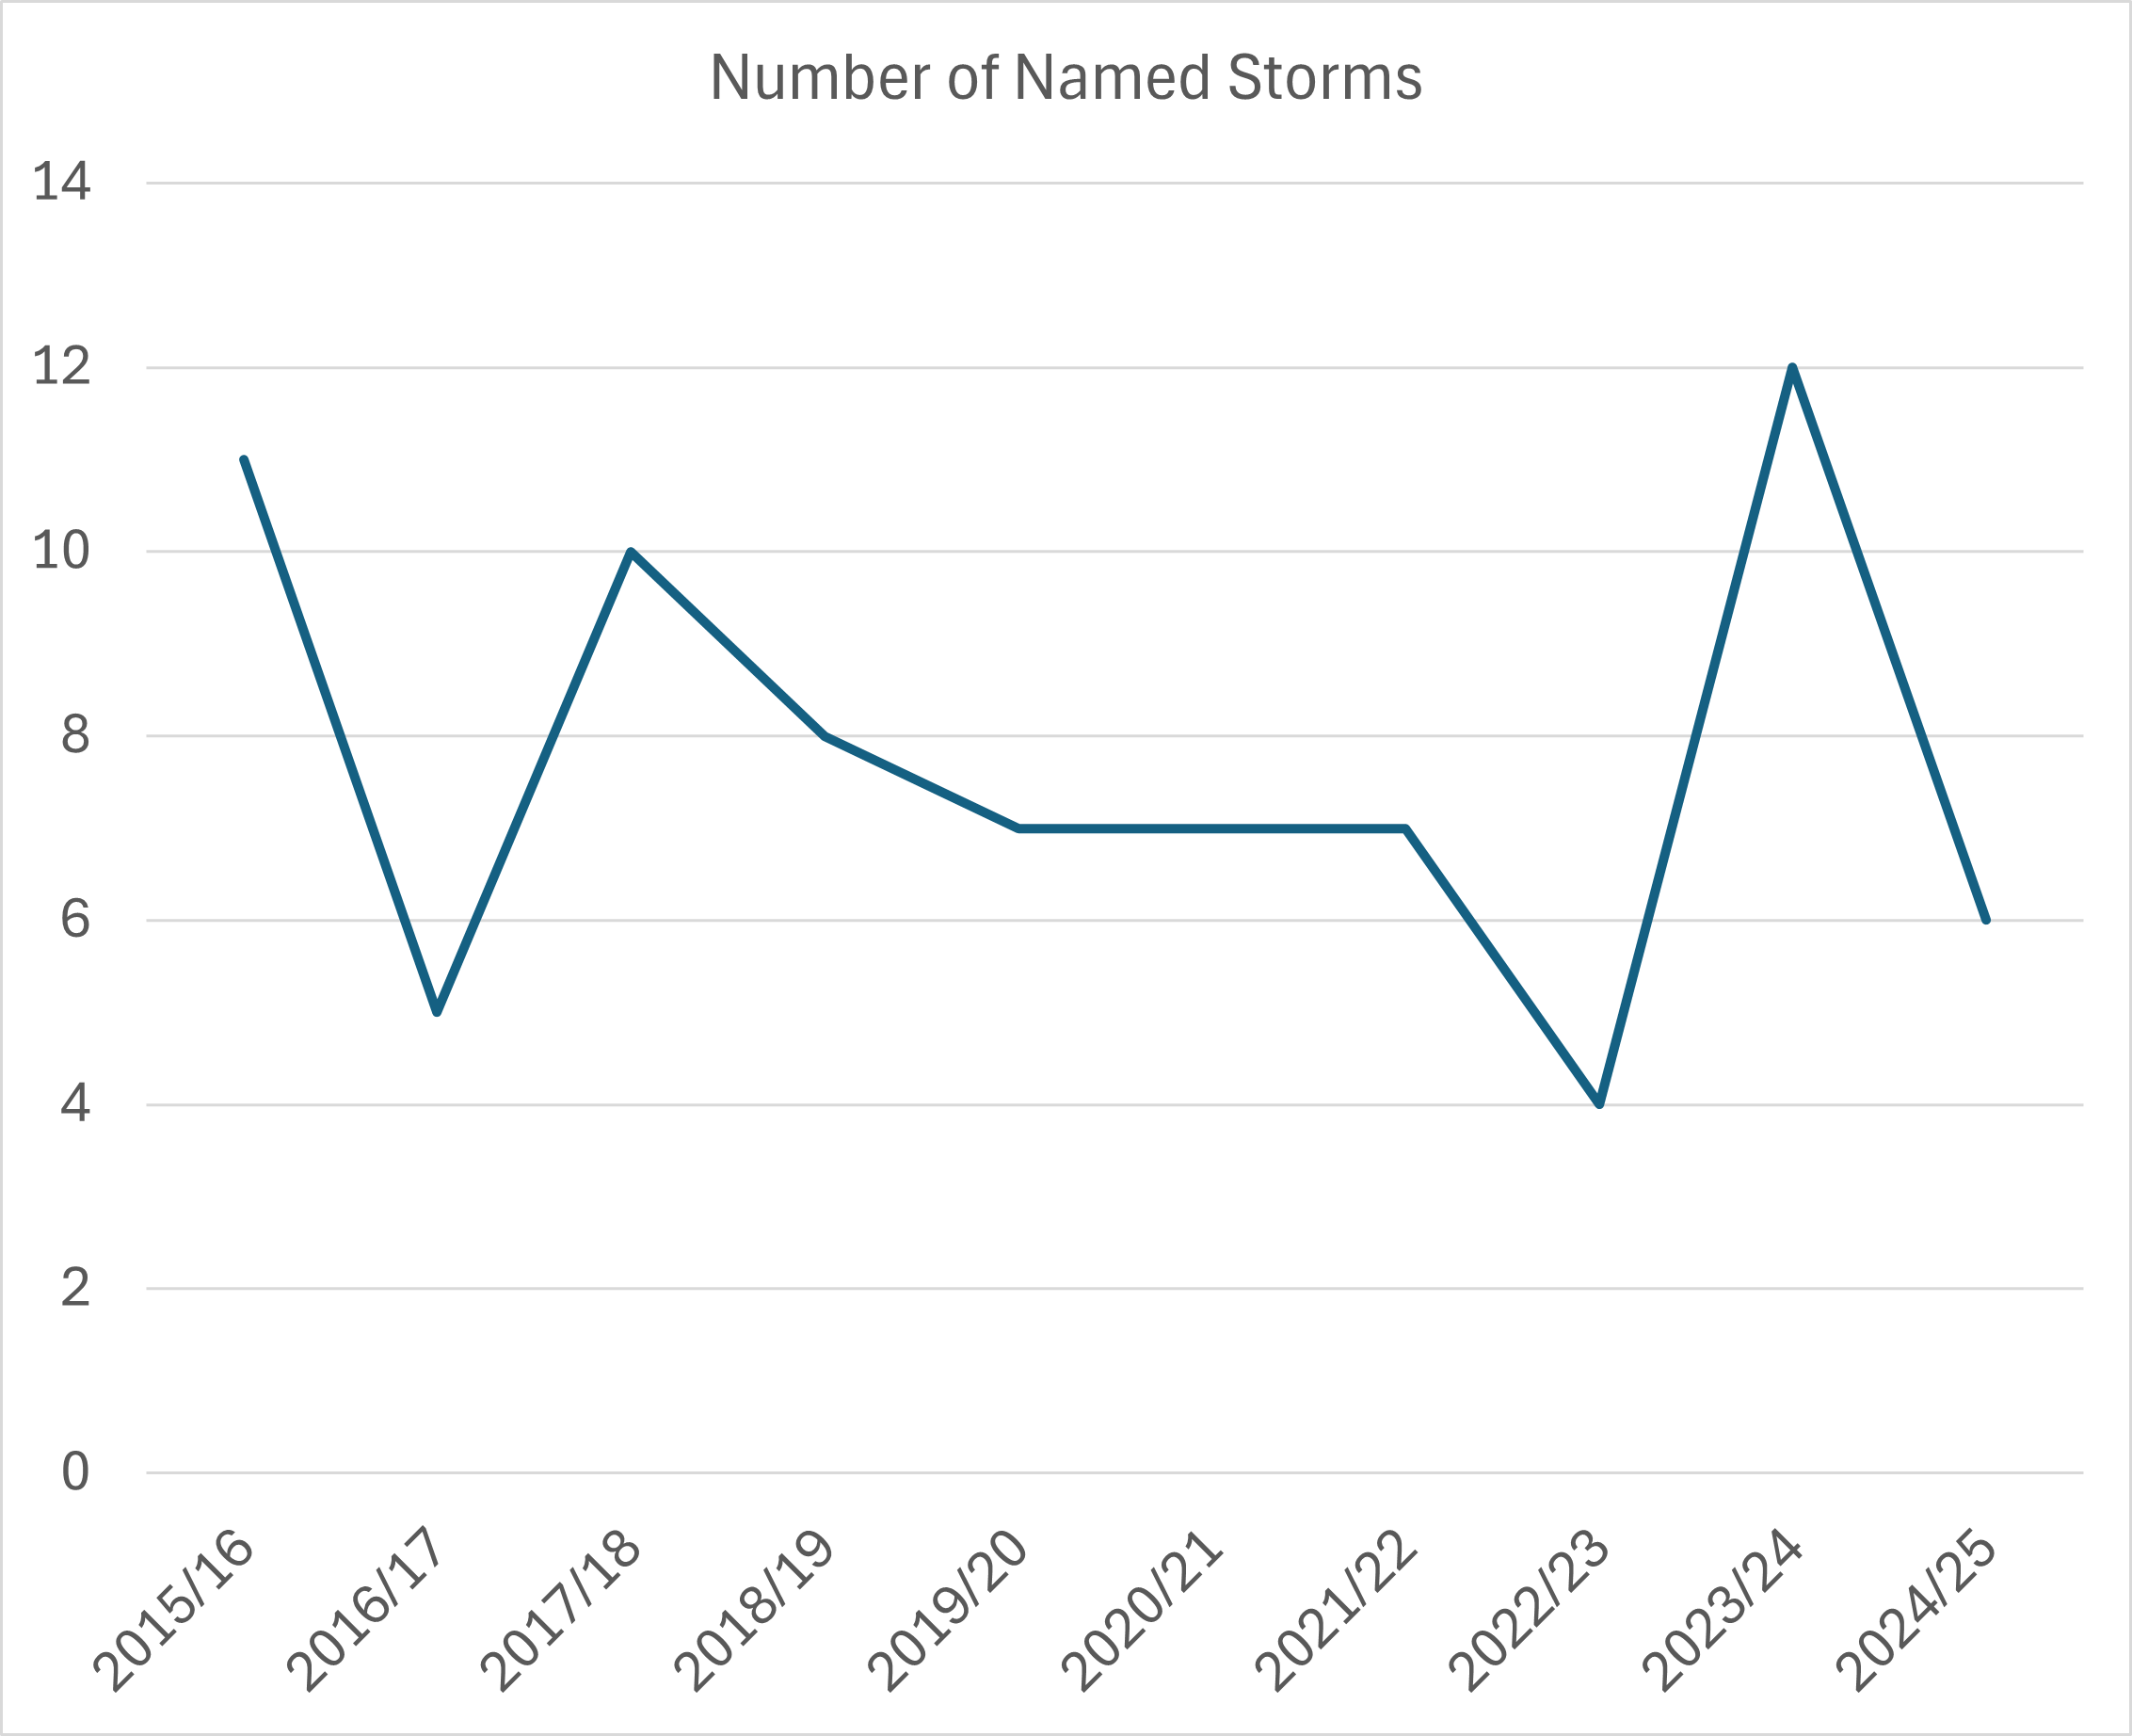
Between the 2015-16 and 2024-25 storm seasons, there have been, on average, 7.7 named storms each year, with a high of 12 recorded in the 2023-24 season and a low of four over 2022-23. This is shown in the line chart below.
Timeseries of the number of named storms for each storm-naming period (which runs from September to August) since 2015. It includes storms named by other Met Services that impacted the UK. Source: Met Office
By this measure, 2025 was not exceptional with six named storms – two from the 2024-25 season and four from 2025-26. These are listed in the table below.
Storm name
Date(s) of impact in UK
Maximum wind gust
Notable features
2024-25 names
Éowyn
24 January
87Kt (100mph), Drumalbin, Lanarkshire
Most powerful storm for over a decade
Floris
4-5 August
71Kt (82mph) at Wick Airport, Caithness
Equalled Scotland’s August gust speed record
2025-26 names
Amy
3-4 October
83Kt (96mph) at Tiree, Argyll
Significant disruption from flooding.
Benjamin (named by Meteo France)
22-23 October
52Kt (60mph) Needles, Isle Of Wight
Strongest winds affected northern France
Claudia (named by AEMET, Spain)
14 November
59Kt (68mph) Warcop Range, Cumbria
Extensive heavy rainfall across England and Wales
Bram
8-10 December
73Kt (84mph), Capel Curig, Conwy
Flooding from heavy rainfall on saturated ground.
Credit: Met Office storm centre
Storm Éowyn in January had the most severe winds of any storm in 2025. The Met Office issued a red warning for wind across Northern Ireland and the south-west and central belt of Scotland. An amber warning was issued for the northern half of the UK. At the peak of the storm, power outages were reported at around 1m homes.
Storms from October to December were notable for bringing some persistent and heavy rain during a period of wetter weather, in contrast to the extended dry spell earlier in the year.
Weather through the year
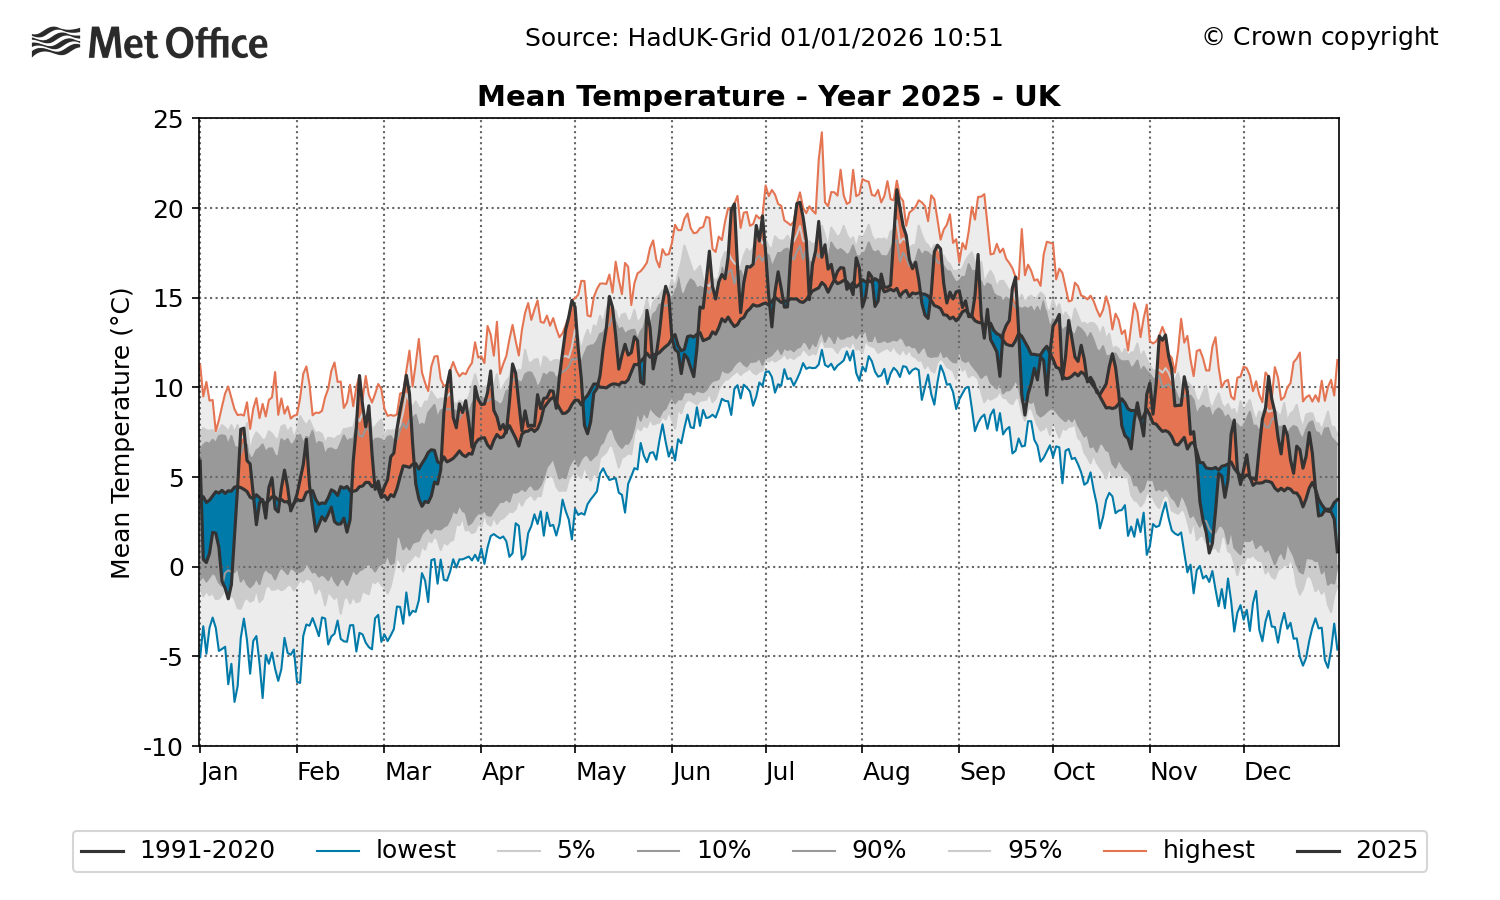
The charts below show the progression of temperature and rainfall through the course of 2025.
The plot below charts average daily temperature over the course of 2025, with orange shading showing warmer-than-average conditions. Overall, the year had 244 days – 66% of the total – where temperatures were above average.
On the other hand, cold spells – indicated by blue shading – were generally short-lived and not very severe, with the exception of events in early January and November.
Timeseries of daily UK average temperature during 2025. Orange shading indicates periods of above-average temperature and blue shading below average. The solid black line is the 1991-2020 reference period by day of the year. The grey shading reflects the 5th, 10th, 90th and 95th percentiles of the temperature distribution and the red and blue lines are the highest and lowest values for each day of the year, based on a dataset of daily data from 1960. Credit: Met Office
Fifty-one days in 2025 were in the top 5% warmest for the time of year in the historical record, but only one day – 20 November – was in the 5% of coldest.
The significant number of warmer days and absence of cool ones helps build a picture of how 2025 was the warmest year overall.
The highest daily maximum temperature recorded in the year was 35.8C at Faversham, Kent on 1 July during an early summer heatwave. The lowest minimum temperature was -18.9C, recorded at Altnaharra, Sutherland on 11 January.
A maximum annual temperature of 35.8C is not an exceptional high for recent years – especially when compared with 2022’s record of 40.3C. However it would have been a rare event in the 20th century, when just three years – 1932 (36.1C), 1976 (35.9C) and 1990 (37.1C) – saw a higher temperature.
In the 21st century, six years have seen temperatures above 35.8C – 2003, 2006, 2015, 2019, 2020, and 2022.
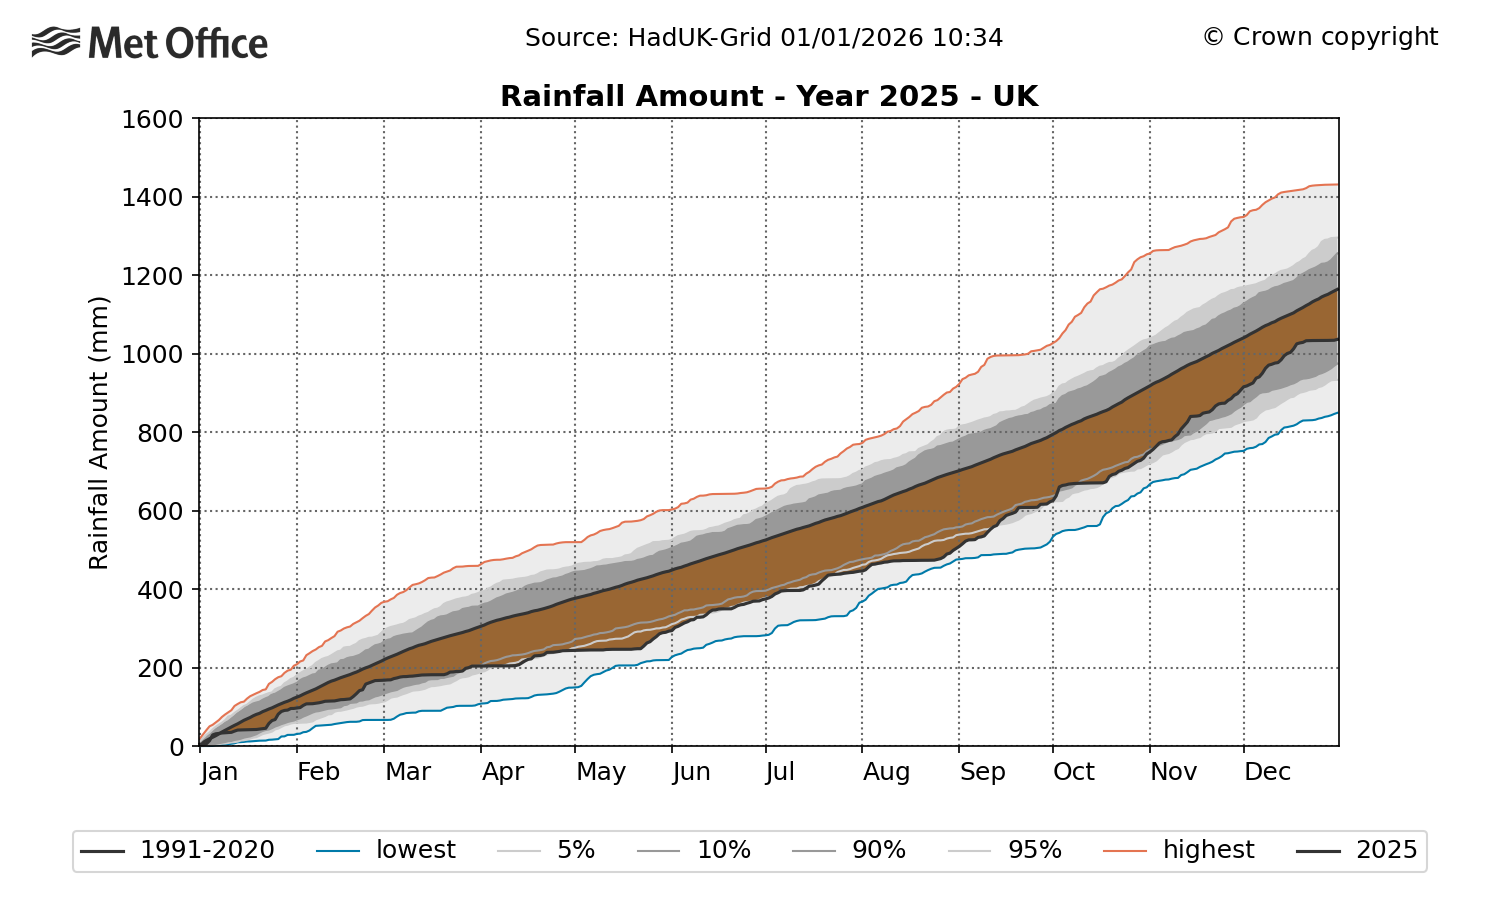
The plot below illustrates 2025’s below-average rainfall accumulation.
The brown shading – which represents the deficit in rainfall at that point of the year compared to the 1991-2020 average – highlights how rainfall totals were particularly low during the dry spring and summer period. The lower blue line shows how rainfall accumulation in 2025 came close to – but did not quite reach – a record low in late May and late August.
Wetter conditions in the autumn saw rainfall totals recover a little to reach 90% at the end of the year – which is below average, but not exceptional. As noted previously, there were regional variations.
Timeseries showing rainfall accumulation through 2025 for the UK. Brown shading represents a deficit in rainfall compared to average for that point in the year, and blue shading is an excess of rainfall compared to average. The solid line represents the 1991-2020 average and grey shading shows the 5th, 10th, 90th and 95th percentiles of the distribution. The blue and red lines represent the lowest and highest values based on a dataset of daily rainfall from 1891 to 2022. Credit: Met Office
Winter
In climate terms, the UK winter spans the calendar months of December, January and February.
The winter of 2024-25 was slightly warmer than average, but not exceptional, with an average temperature of 4.62C. This is 0.53C above the 1991-2020 average. The winter months had 89% of average rainfall and 94% of average sunshine.
New Year’s Day saw significant flooding that affected parts of Lancashire and the south side of Manchester. The River Mersey reached record levels in the wake of two days of heavy, persistent rain.
The coldest spell of 2025 occurred in early January, with significant snowfall in some regions.
Storm Éowyn and heavy rain at the end of January were the winter’s most impactful events, bringing high winds and flooding that resulted in considerable disruption.
Spring
Spring – which encompasses the months of March, April and May – was the warmest and sunniest on record, as well as the sixth driest.
The record high temperature came only one year after the previous record set in 2024, continuing a trend of increasing spring time temperature for the UK.
(A Met Office attribution analysis which explored the record-breaking temperatures of May 2024 showed that the temperatures were caused by a combination of a marine heatwave which persisted through May and into June and human-induced climate change.)
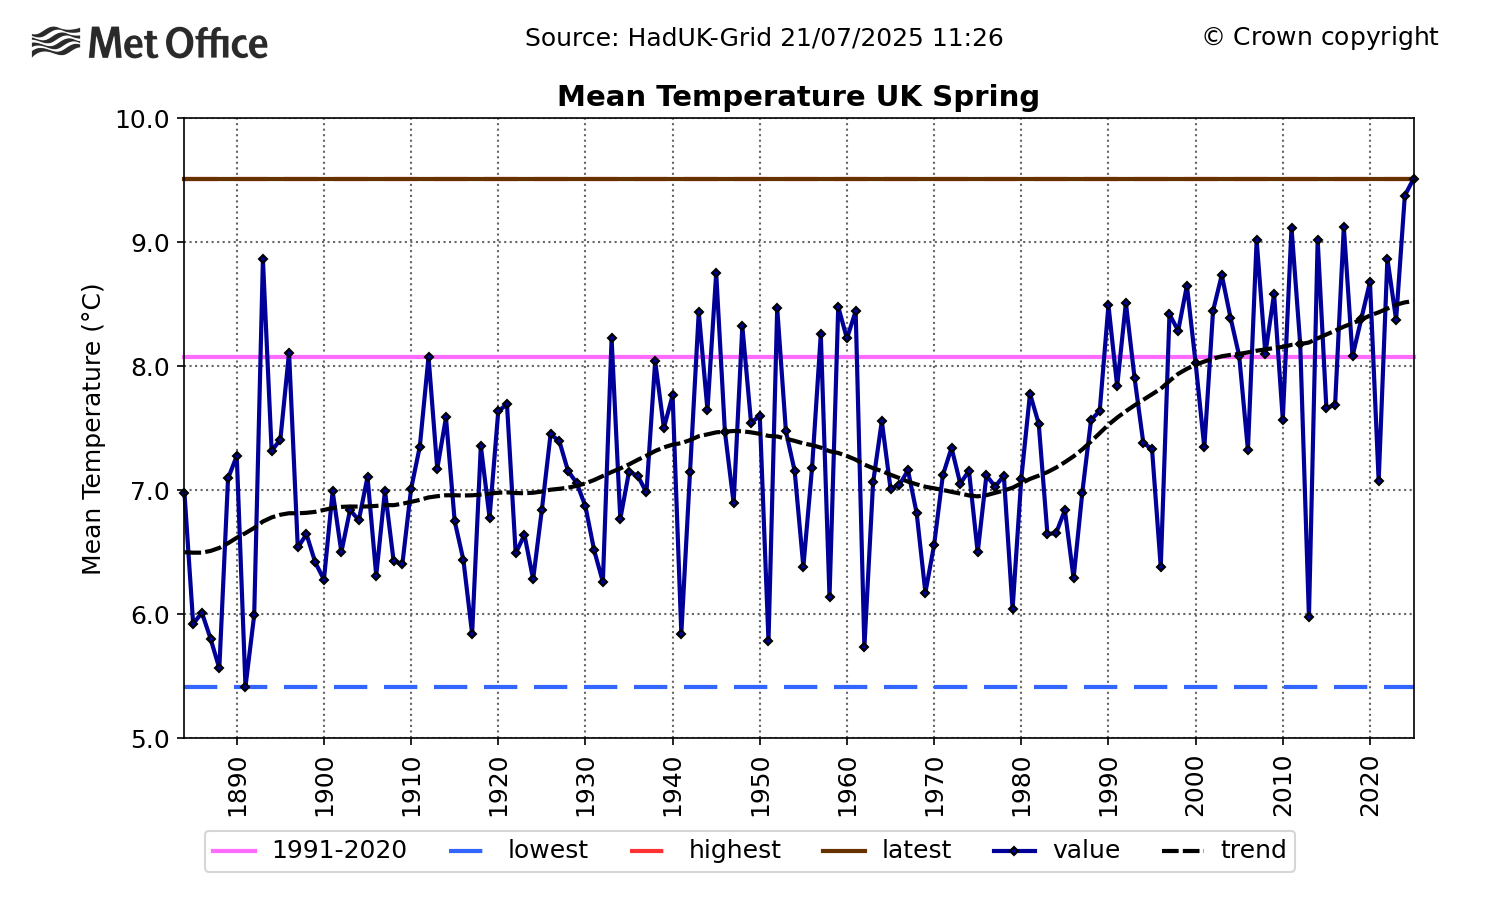
The timeseries below shows average spring temperature in the UK over 1884-2025. It shows a significant warming trend since the 1970s, with temperatures in 2024 and 2025 sitting well outside the range of variability observed in the late 19th and 20th centuries.
Timeseries of spring average absolute temperature for the UK over 1884-2025. The trend is represented by a black dashed line, the 1991-2020 average is shown in pink and the highest and lowest values in the series are shown by the red and blue dashed lines, respectively. The 2025 value is represented by the horizontal brown line (which covers the red line for the highest in the record). Credit: Met Office
The UK’s changing climate is having an impact on the natural cycles of many species and habitats. Citizen science initiatives have highlighted how “signs of spring” – for instance, the first flowering or first nest-building – occur increasingly early in the year.
Summer
Warm, sunny and dry conditions persisted into the summer season, drying out soils.
There were four heatwave events, which impacted almost all regions of the UK. Two of these events took place in June.
A marine heatwave also took place, with sea surface temperatures of 1.5-3C above the 1983-2012 average in the Celtic Sea, English Channel and southern North Sea.
An attribution study by the World Weather Attribution service estimated that human-caused climate change had made exceeding June heatwave thresholds around 10 times more likely. The research also found that one of the June heatwaves had been made 2-4C more intense as a result of human influence.
The five warmest summers recorded in the UK to date are 2025 (16.10C), 2018 (15.76C), 2006 (15.75C), 2003 (15.74C) and 2022 (15.71C).
Met Office analysis estimates that in a pre-industrial climate, a summer like 2025 would be expected to occur every 340 years. However, in the current climate, we could expect to see these sorts of summers roughly once every five years.
The study also shows that the UK could plausibly experience much hotter summers in the current and future climate. Events that would have been seen as extremes in the past are becoming more common.
A Met Office attribution study published in 2019 estimated that the then record-breaking summer of 2018 had a statistical return period of approximately eight-to-nine years. The summer of 2025 has broken that record in seven years, consistent with these previous findings.
The science is clear that UK summers are becoming warmer and extreme heat events are becoming more common. This could mean more significant impacts on people, infrastructure and the environment – both now and in the future.
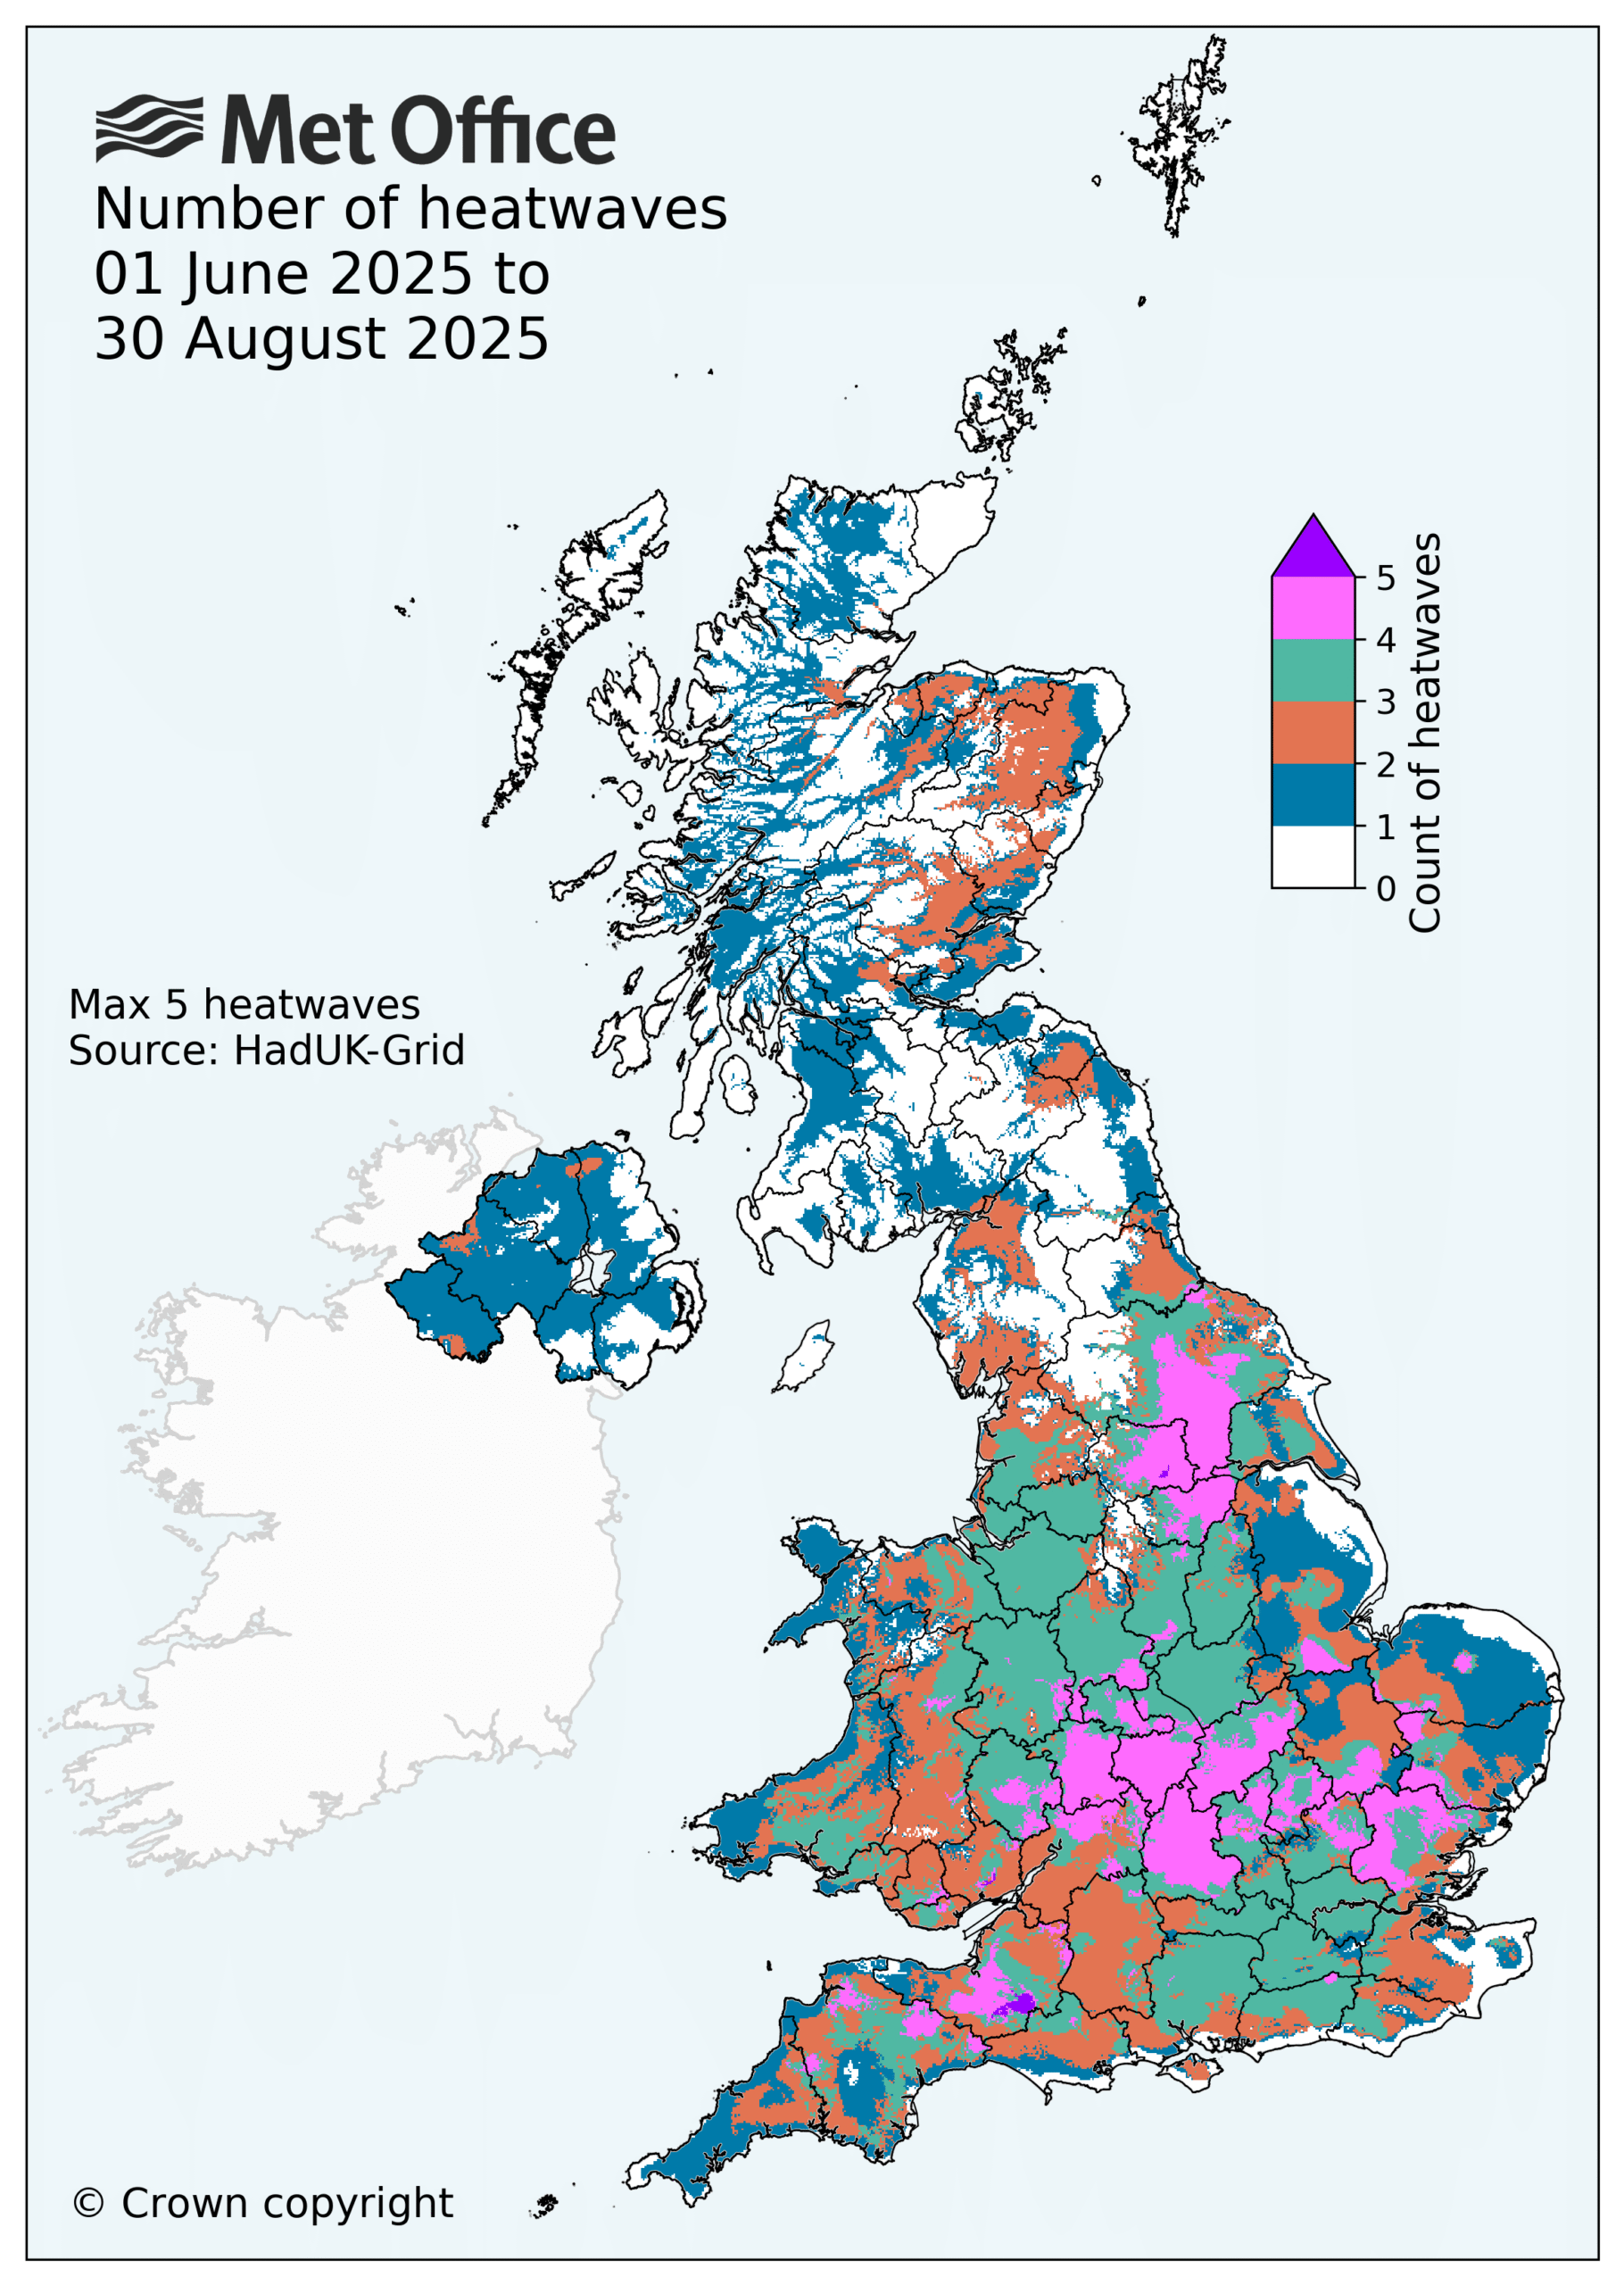
The map below plots the number of heatwaves that took place in June, July and August across the UK. It shows how a significant number of regions across saw three (green shading) or four (pink shading) heatwaves over the summer months.
Map showing the number of heatwaves by location during the summer of 2025. Source: Met Office
Autumn
Autumn and the month of December were marked with unsettled weather, with mild and wet conditions over the four-month period.
The season was warmer and wetter than average. Northern Ireland had its third-wettest autumn on record, Northern England its fifth wettest and Wales its 10th wettest.
Storm Amy set a record for highest gust speed for a storm in October, with 80Kt (92mph) recorded at Magilligan, County Londonderry.
Other major storms were notable for heavy rainfall that caused flooding. Storm Claudia brought heavy rainfall to central England and Wales in mid-November, which fell on already saturated ground.
The second half of November saw snow cause across the North York Moors during a cold northerly spell which saw some hard frosts. This was followed by generally mild and unsettled conditions until late December, when strong easterly winds brought more low temperatures and hard frosts.
The UK chalked up a number of significant climate records in 2025, particularly for high temperatures. This aligns with the well-established warming trend that is the result of human-caused climate change.
Climate attribution studies continue to provide further evidence that human factors are increasing the likelihood and severity of UK climate extremes.
Many of 2025’s records will not stand for long. There is a high chance they will be broken again in the near future as the climate continues to warm.
Donald Trump urges you to be a Climate Science denier like him. He says that he makes millions and millions for destroying the planet, Burn, Baby, Burn and Flood, Baby, Flood.Nigel Farage urges you to ignore facts and reality and be a climate science denier like him and his Deputy Richard Tice. He says that Reform UK has received £Millions and £Millions from the fossil fuel industry to promote climate denial and destroy the planet.Elon Musk urges you to be a Fascist like him, says that you can ignore facts and reality then.
Personal private transport has been identified as one of the Capitalists’ / Fascists’ vulnerabilities. Their traffic signals are vulnerable.
Orcas discuss Donald Trump and the killer apes’ concept of democracy. Front Orca warns that Trump is crashing his country’s economy and that everything he does he does for the fantastically wealthy.
It’s the rich that have destroyed the climate to be richer, far richer than they ever need to be.
Orcas discuss Donald Trump and the killer apes’ concept of democracy. Front Orca warns that Trump is crashing his country’s economy and that everything he does he does for the fantastically wealthy.