Category: Uncategorized

  • Weather v climate: how to make sense of an unusual cold snap while the world is hotter than ever

    Spread the love

    Neven S. Fučkar, University of St Andrews

    Earlier this year, the UK’s weather and climate service, the Met Office, announced average global temperatures in 2023 were 1.46°C above pre-industrial levels. This made it the hottest year on record, 0.17°C higher than the previous record in 2016.

    However, shortly after that announcement, the Met Office also forecast a multi-day blast of cold Arctic air bringing sub-zero temperatures, snow and ice to many parts of the UK. When the cold snap arrived, temperatures dropped to -14°C in the Scottish Highlands and -11°C even in England.

    Ten days later, a village in the Scottish Highlands reached a balmy 19.9°C, the warmest January temperature ever recorded anywhere in the UK – by a full degree Celsius. That might seem more in keeping with the global warming trend. Yet just ten days on from that record warmth, much of the UK has again been hit by unusually cold and snowy weather.

    It’s not just the UK. This winter, record-low temperatures have been observed right across Canada, the US and China.

    This might seem confusing. Why are the weather and the climate producing such opposing signs? The reason is that they refer to atmospheric characteristics on substantially different timescales.

    You cannot sense the climate

    I do not think there is a person on Earth who can truly experience a “global annual average” of temperature. No one really knows what a degree of extra warmth over a century feels like, especially given temperatures might vary by 10°C between day and night in the UK, for example, or by 20°C and more between a hot summer day and a cold winter night.

    This means we usually have a hard time feeling or recalling seasonal averages and how they change with passing years. We can spot climate changes in environmental shifts like receding glaciers or early flowering plants, and we can track changes with instruments. But it remains very hard to “feel” climate change.

    In contrast, we feel and much better remember the weather on daily and weekly timescales – particularly extreme weather like a cold snap, heatwave or strong storm.

    Hot one day, cold the next

    Weather phenomena are very rapid and variable compared with climate properties that are defined and changing on longer time scales. The weather might be hot one day and cold the next, but an annual mean climate cannot suddenly slide from warm to cold.

    The climate is essentially an accumulation of weather across a considerable amount of time. For example, weather information might refer to the local temperature at noon or 4pm, the daily minimum, average or maximum temperatures, or the weekly average. Whereas climate is much longer term.

    Climate information might refer to, for example, average temperatures over a month, or averages over seasonal (three-month) periods, years or decades. In climate analysis, we usually look for anomalies with respect to the “baseline” – a longer-term average of perhaps 30 or 50 years of data.

    The line wiggles upwards

    Two graphs
    Left: global annual mean carbon dioxide (black curve) and air temperature (red curve) since 1850. Right: Average temperatures over central England in summer (red curve) and winter (curve). Temperatures relative to 1850–1900 average.
    Neven Fuckar / Data: Met Office HadCRUT5 and HadCET

    We can use more than a century of data to spot patterns, such as the close relationship in the left graph (above) between global atmospheric CO₂ and near-surface temperatures. There are, of course, some variations of around 0.1°C or so – the wiggles in the red line – as the climate does not change perfectly smoothly. That’s why 2016 was exceptionally hot, and the years after were slightly cooler.

    These variations become more pronounced when we zoom in and examine a smaller regional area or shorter time units. For example, the right-hand graph above shows data from the Central England Temperature (HadCET) record, the world’s longest-running instrumental temperature record which began in 1659. This graph, which shows both winter and summer mean temperatures for central England, picks up more substantial variability over the same period from 1850 by both measures – on the order of 1°C. The internal variability of these seasonal means in essence drowns out long-term climate change at this regional scale before 1960s.

    Looking at the right-hand graph alone – 174 years of data – you’d struggle to spot recent climate change. But zoom out to the global annual mean data in the left graph, and the long-term trend becomes clear.

    We can zoom in even further to look at daily winter weather variability in the English county of Oxfordshire (HadUK-Grid). The histograms below show daily minimum temperatures (the left panels 2.a and 2.c) and daily mean temperatures (the right panels 2.b and 2.d) from two distinct 21-year periods.
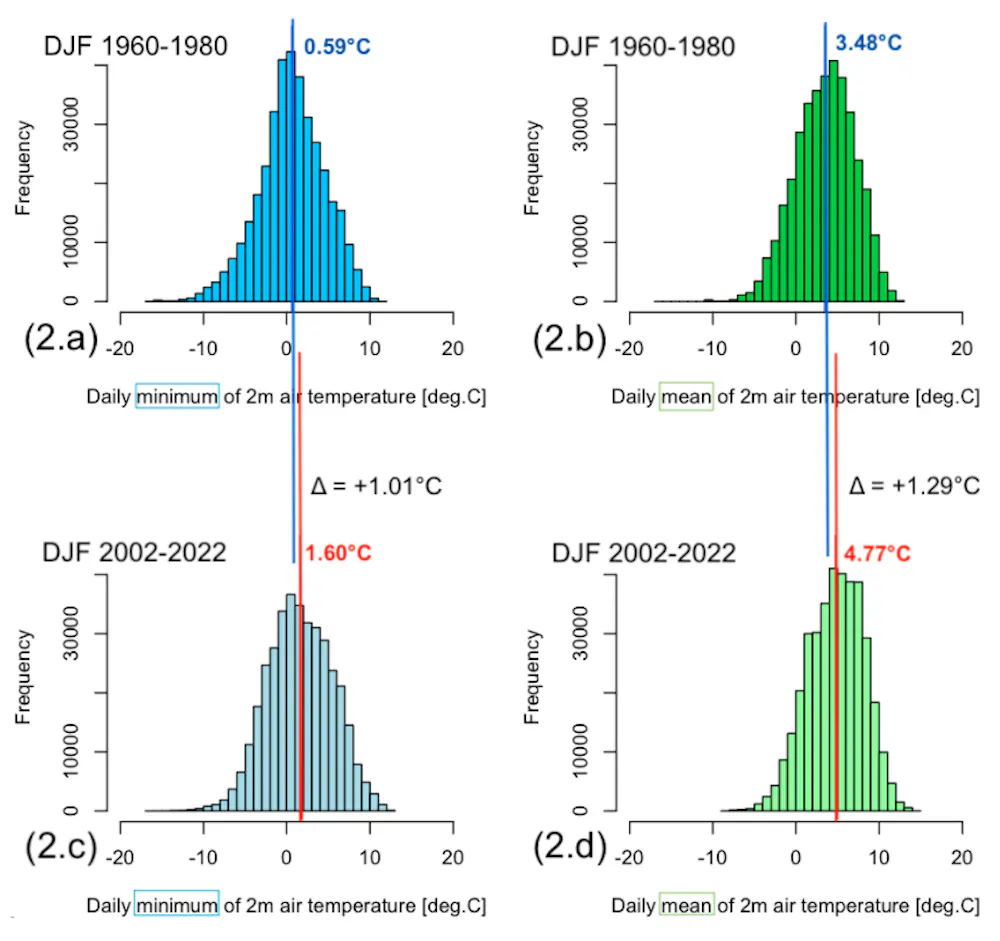
    Four histograms of winter (December-January-February: DJF) daily minimum and mean temperatures in Oxfordshire
    How winters are changing in Oxfordshire.
    Neven Fuckar / Data: Met Office HadUK-Grid

    They show that the chances of experiencing sub-zero weather is still significant even in the more recent 2002-2022 period. However, the “tail” of daily minimum temperatures to the left of the mean is thinner, so extreme cold temperatures are less common. The average daily minimum of 0.59°C (the number in blue) has increased by about 1°C to 1.6°C in the more recent period, while the daily mean increased by 1.29°C – both increases are greater than global warming over this time.

    These are signs that Oxfordshire is warming over the long term, and its winters are warming slightly faster than the world as a whole. Global climate change makes high temperature extremes more likely, even in winter. It does not forbid winter cold snaps, but it does reduce their likelihood.


    Imagine weekly climate newsletter

    Don’t have time to read about climate change as much as you’d like?

    Get a weekly roundup in your inbox instead. Every Wednesday, The Conversation’s environment editor writes Imagine, a short email that goes a little deeper into just one climate issue. Join the 30,000+ readers who’ve subscribed so far. The Conversation


    Neven S. Fučkar, Senior Researcher, School of Geography and the Environmen, University of Oxford, and Lecturer, School of Geography and Sustainable Development, University of St Andrews

    This article is republished from The Conversation under a Creative Commons license. Read the original article.

  • Common Speaker ‘effectively lied’ say SNP

    Spread the love

    https://morningstaronline.co.uk/article/b/speaker-effectively-lied-say-snp

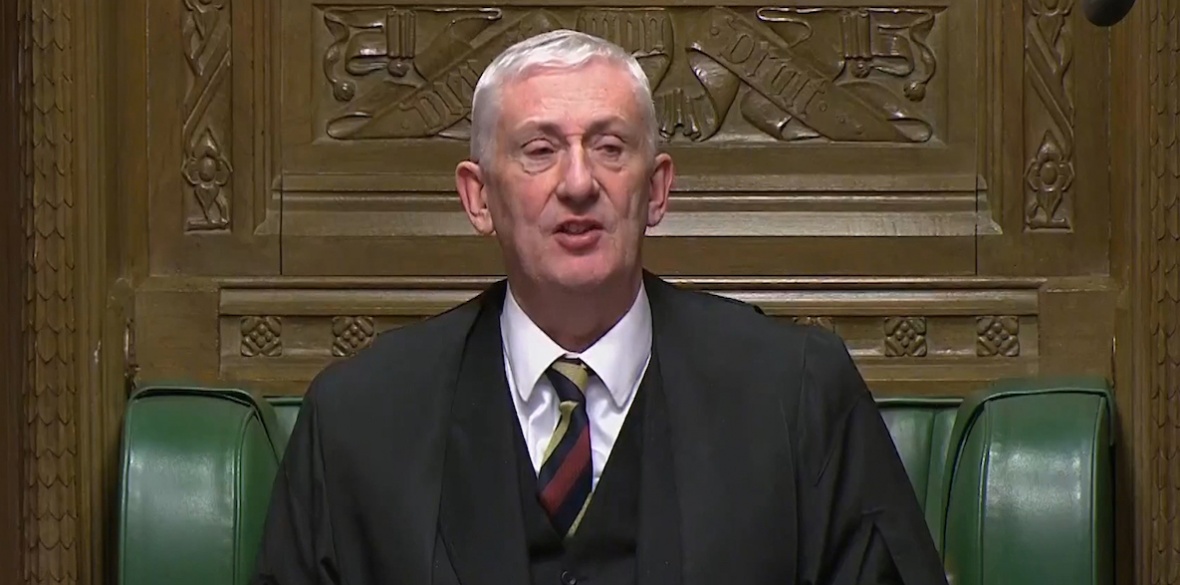
    Commons Speaker Lindsay Hoyle

    THE “bullied” Commons Speaker has “effectively lied” to Parliament and public, according to the SNP’s Westminster leader.

    Stephen Flynn MP made the remarks on BBC Radio Scotland as he discussed the fallout of the chaotic opposition day debate when Speaker Sir Lindsay Hoyle effectively prevented voting on the SNP’s ceasefire motion.

    Instead the house was left to accept or reject a Labour amendment, which omitted an SNP reference to “collective punishment of the Palestinian people.”

    Mr Flynn said: “He was obviously bullied into a position last week by the leader of the Labour Party, Sir Keir Starmer, following a private conversation in the back rooms of Westminster.”

    Responding to Sir Keir and Sir Lindsay’s denials of collusion, Mr Flynn added: “That’s like me denying that I’m a bald man — it would just defy reality and logic.

    “Everyone on Westminster’s estate knows what happened last week.”

    …

    https://morningstaronline.co.uk/article/b/speaker-effectively-lied-say-snp

    Stephen Flynn MP Scottish Nationalist Party (SNP) Westminster Leader
    Stephen Flynn MP Scottish Nationalist Party (SNP) Westminster Leader
  • Satellites are burning up in the upper atmosphere – and we still don’t know what impact this will have on the Earth’s climate

    Spread the love

    Paul Fleet / shutterstock

    Fionagh Thomson, Durham University

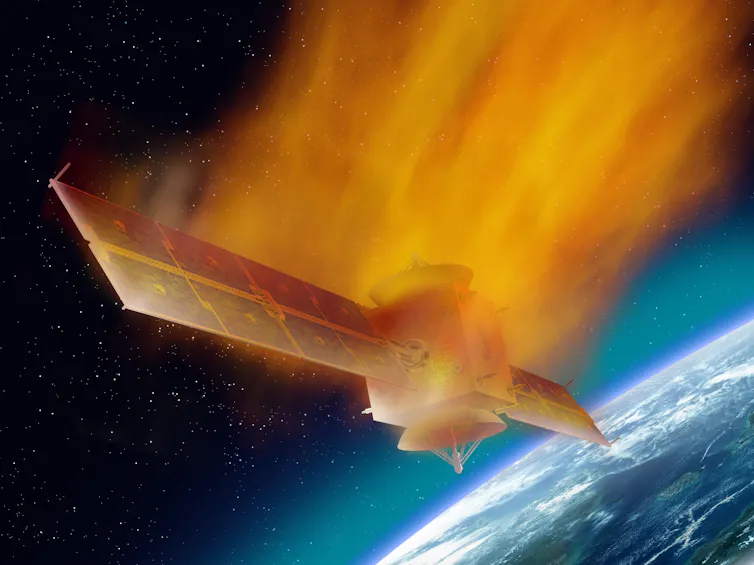
    Elon Musk’s SpaceX has announced it will dispose of 100 Starlink satellites over the next six months, after it discovered a design flaw that may cause them to fail. Rather than risk posing a threat to other spacecraft, SpaceX will “de-orbit” these satellites to burn up in the atmosphere.

    But atmospheric scientists are increasingly concerned that this sort of apparent fly-tipping by the space sector will cause further climate change down on Earth. One team recently, and unexpectedly, found potential ozone-depleting metals from spacecraft in the stratosphere, the atmospheric layer where the ozone layer is formed.

    The relative “low earth orbit” where satellites monitoring Earth’s ecosystems are found is increasingly congested – Starlink alone has more than 5,000 spacecraft in orbit. Clearing debris is therefore a priority for the space sector. Newly launched spacecraft must also be removed from orbit within 25 years (the US recently implemented a stricter five-year rule) either by moving upwards to a so-called “graveyard orbit” or down into the Earth’s atmosphere.

    Lower orbiting satellites are usually designed to use any remaining fuel and the pull of the Earth’s gravity to re-enter the atmosphere. In a controlled reentry, the spacecraft enters the atmosphere at a pre-set time to land in the most remote part of the Pacific Ocean at Point Nemo (aka the spacecraft cemetery). In an uncontrolled re-entry, spacecraft are left to follow a “natural demise” and burn up in the atmosphere.

    Nasa and the European Space Agency promote this form of disposal as part of a design philosophy called “design for demise”. It is an environmental challenge to build, launch and operate a satellite robust enough to function in the hostility of space yet also able to break up and burn up easily on re-entry to avoid dangerous debris reaching the Earth’s surface. It’s still a work in progress.

    Satellite operators must prove their design and re-entry plans have a low “human-hit” rate before they are awarded a license. But there is limited concern regarding the impact on Earth’s upper atmosphere during the re-entry stage. This is not an oversight.

    Initially, neither the space sector nor the astrophysics community considered burning up satellites on re-entry to be a serious environmental threat – to the atmosphere, at least. After all, the number of spacecraft particles released is small when compared with 440 tonnes of meteoroids that enter the atmosphere daily, along with volcanic ash and human-made pollution from industrial processes on Earth.

    Bad news for the ozone layer?

    So are atmospheric climate scientists overreacting to the presence of spacecraft particles in the atmosphere? Their concerns draw on 40 years of research into the cause of the ozone holes above the south and north poles, that were first widely observed in the 1980s.

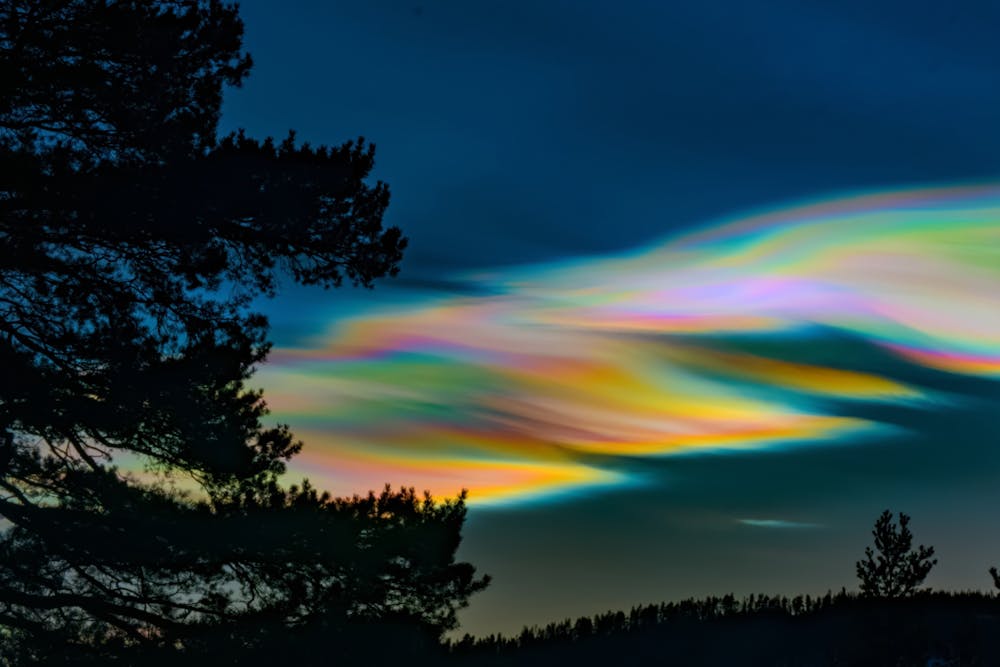
    Today, they now know that ozone loss is caused by human-made industrial gases, which combine with natural and very high altitude polar stratospheric clouds or mother of pearl clouds. The surfaces of these ethereal clouds act as catalysts, turning benign chemicals into more active forms that can rapidly destroy ozone.

    Colourful cloud in night sky
    Mother of pearl cloud in the stratosphere above Norway.
    Uwe Michael Neumann / shutterstock

    Dan Cziczo is an atmospheric scientist at Purdue University in the US, and a co-author of the recent study that found ozone depleting substances in the stratosphere. He explains to me that the question is whether the new particles from spacecraft will help the formation of these clouds and lead to ozone loss at a time when the Earth’s atmosphere is just beginning to recover.

    Of more concern to atmospheric scientists such as Cziczo is that only a few new particles could create more of these types of polar clouds – not only at the upper atmosphere, but also in the lower atmosphere, where cirrus clouds form. Cirrus clouds are the thin, wispy ice clouds you might spot high in the sky, above six kilometres. They tend to let heat from the sun pass through but then trap it on the way out, so in theory more cirrus clouds could add extra global warming on top of what we are already seeing from greenhouse gases. But this is uncertain and still being studied.

    Cziczo also explains that from anecdotal evidence we know that the high-altitude clouds above the poles are changing – but we don’t know yet what is causing this change. Is it natural particles such as meteoroids or volcanic debris, or unnatural particles from spacecrafts? This is what we need to know.

    Concerned, but not certain

    So how do we answer this question? We have some research from atmospheric scientists, spacecraft builders and astrophysicists, but it’s not rigorous or focused enough to make informed decisions on which direction to take. Some astrophysicists claim that alumina (aluminium oxide) particles from spacecraft will cause chemical reactions in the atmosphere that will likely trigger ozone destruction.

    Atmospheric scientists who study this topic in detail have not made this jump as there isn’t enough scientific evidence. We know particles from spacecraft are in the stratosphere. But what this means for the ozone layer or the climate is still unknown.

    It is tempting to overstate research findings to garner more support. But this is the path to research hell – and deniers will use poor findings at a later date to discredit the research. We also don’t want to use populist opinions. But we’ve also learnt that if we wait until indisputable evidence is available, it may be too late, as with the loss of ozone. It’s a constant dilemma. The Conversation

    Fionagh Thomson, Senior Research Fellow in Space Ethics and Sustainability, Durham University

    This article is republished from The Conversation under a Creative Commons license. Read the original article.
  • UK quits treaty that lets oil firms sue government

    Spread the love
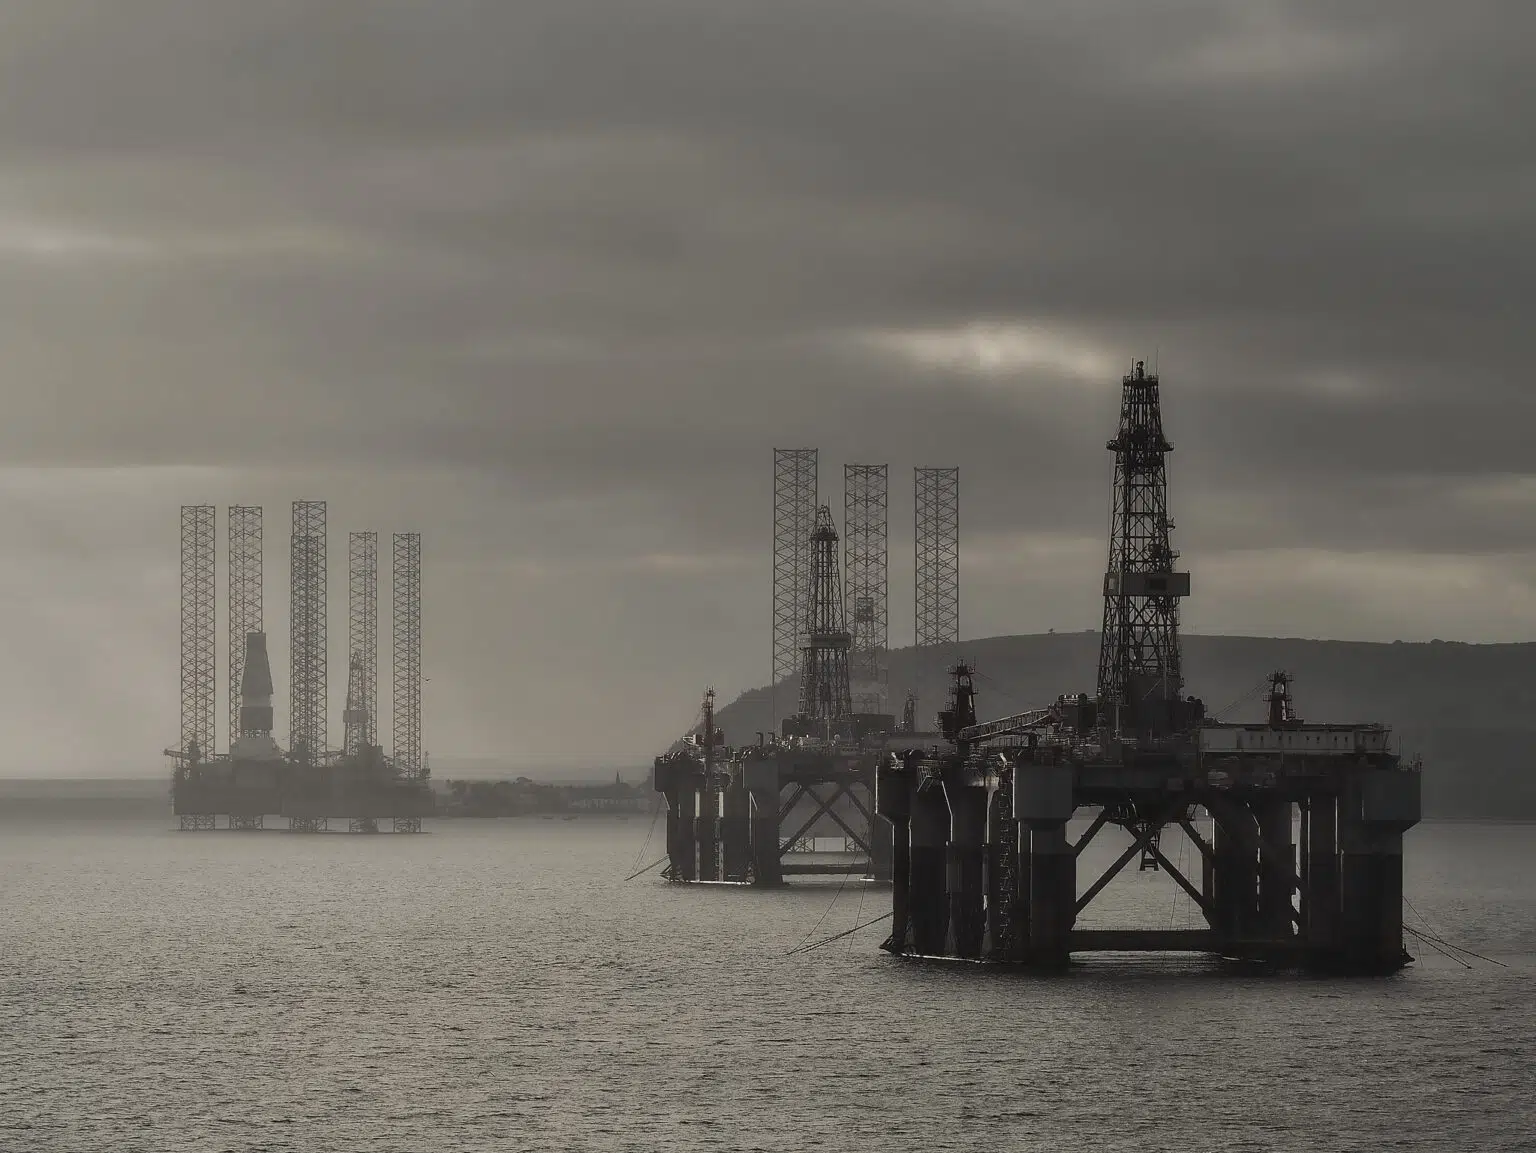
    North Sea oil rigs in Cromarty Firth, Scotland. Credit: joiseyshowaa (CC BY-SA 2.0)
    North Sea oil rigs in Cromarty Firth, Scotland. Credit: joiseyshowaa (CC BY-SA 2.0)

    https://www.bbc.co.uk/news/science-environment-68369916

    The UK has withdrawn from an international treaty that lets fossil-fuel companies sue governments pursuing climate policies for billions in compensation for lost profits.

    The Energy Charter Treaty (ECT) is meant to make it easier and cheaper to trade energy between countries.

    But signatories have struggled to reform it – and late on Wednesday, the UK quit the treaty calling it “outdated”.

    Green campaigners welcomed the news.

    Energy Security and Net Zero Minister Graham Stuart said: “Remaining a member would not support our transition to cleaner, cheaper energy and could even penalise us for our world-leading efforts to deliver net zero.”

    …

    https://www.bbc.co.uk/news/science-environment-68369916