From May 11 to 20, 42 percent of soils in Europe and the Mediterranean basin lacked moisture and were at a warning level, while five percent were at an alert level, indicating vegetation was not growing normally.
Countries in northern, central and eastern Europe were at high alert levels.
Roughly 19 percent of territory in Ukraine was on alert, with other countries in concerning circumstances, including nine percent of Hungary and Slovakia, 10 percent of Poland and 17 percent of lands in Belarus.
The alert level for some territories and countries was as high as 20 percent, including the Palestinian territories, Cyprus and Syria.
Several countries were experiencing drought conditions in mid-May without being at an alert level, including 98 percent of the United Kingdom. According to the UK’s Met Office, the country had its driest spring in over 50 years, as well as its warmest spring ever recorded.
Global temperatures in the first quarter of 2025 were the second warmest on record, extending a remarkable run of exceptional warmth that began in July 2023.
This is despite weak La Niña conditions during the first two months of the year – which typically result in cooler temperatures.
With temperature data for the first three months of the year now available, Carbon Brief finds that 2025 is very likely to be one of the three warmest years on record.
However, it currently remains unlikely that temperatures in 2025 will set a new annual record.
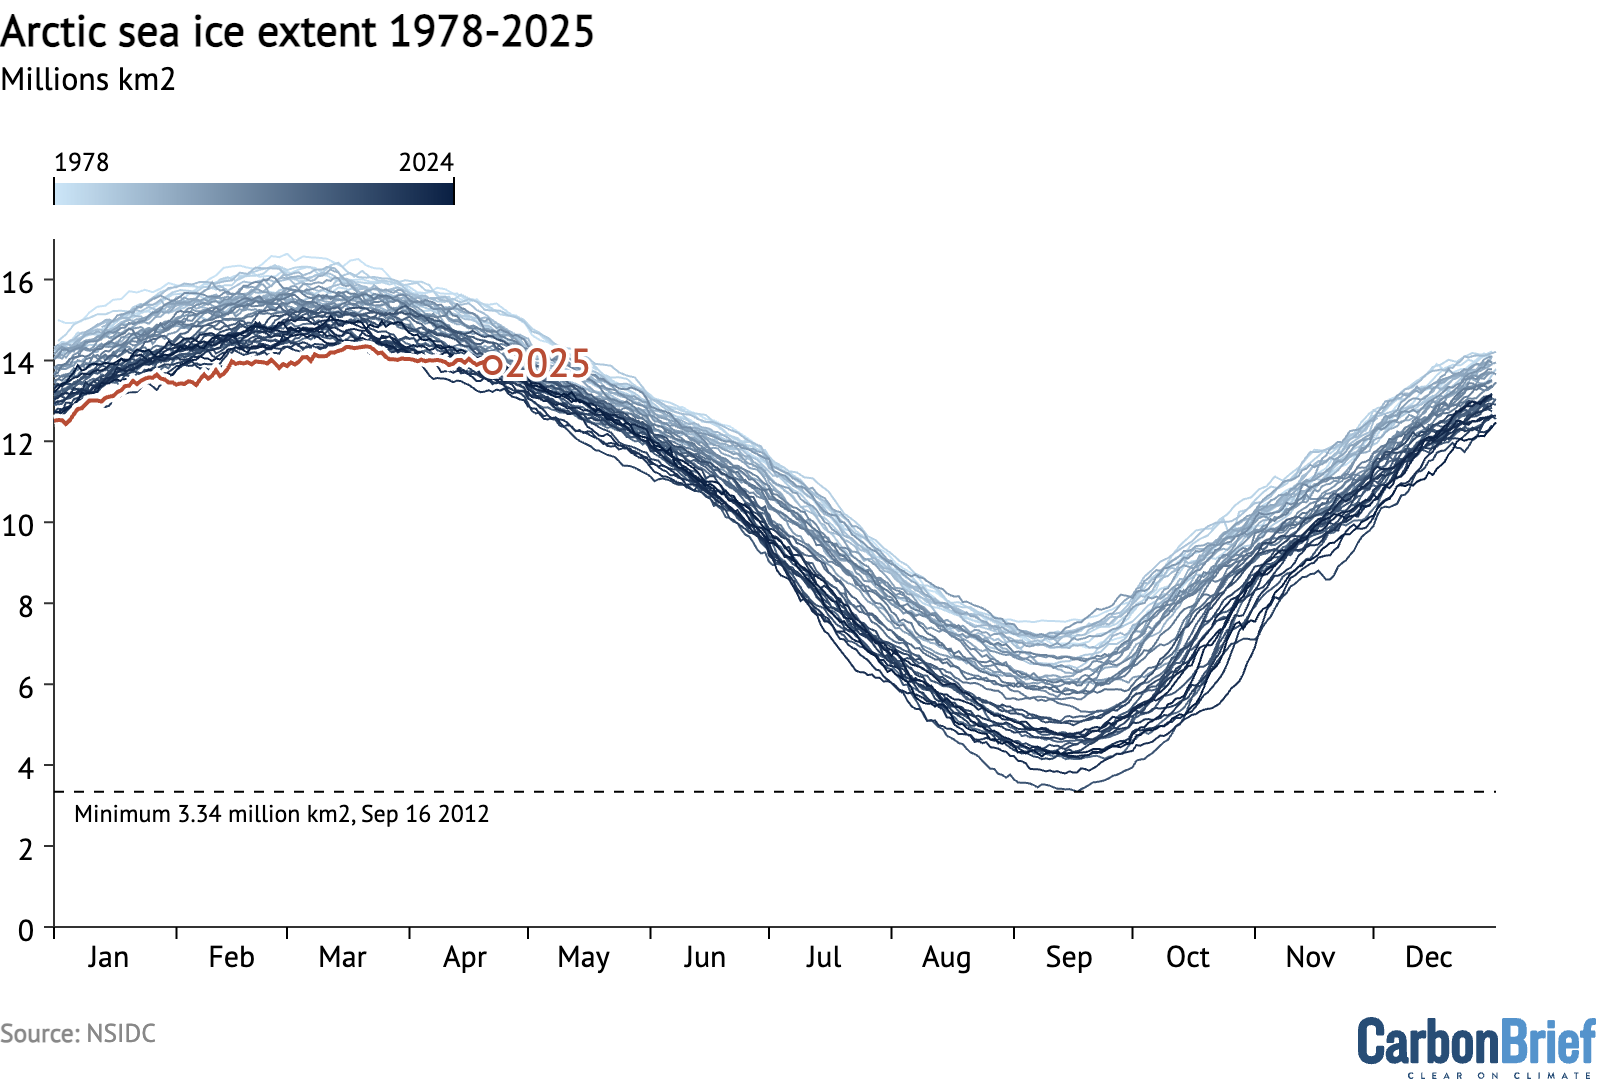
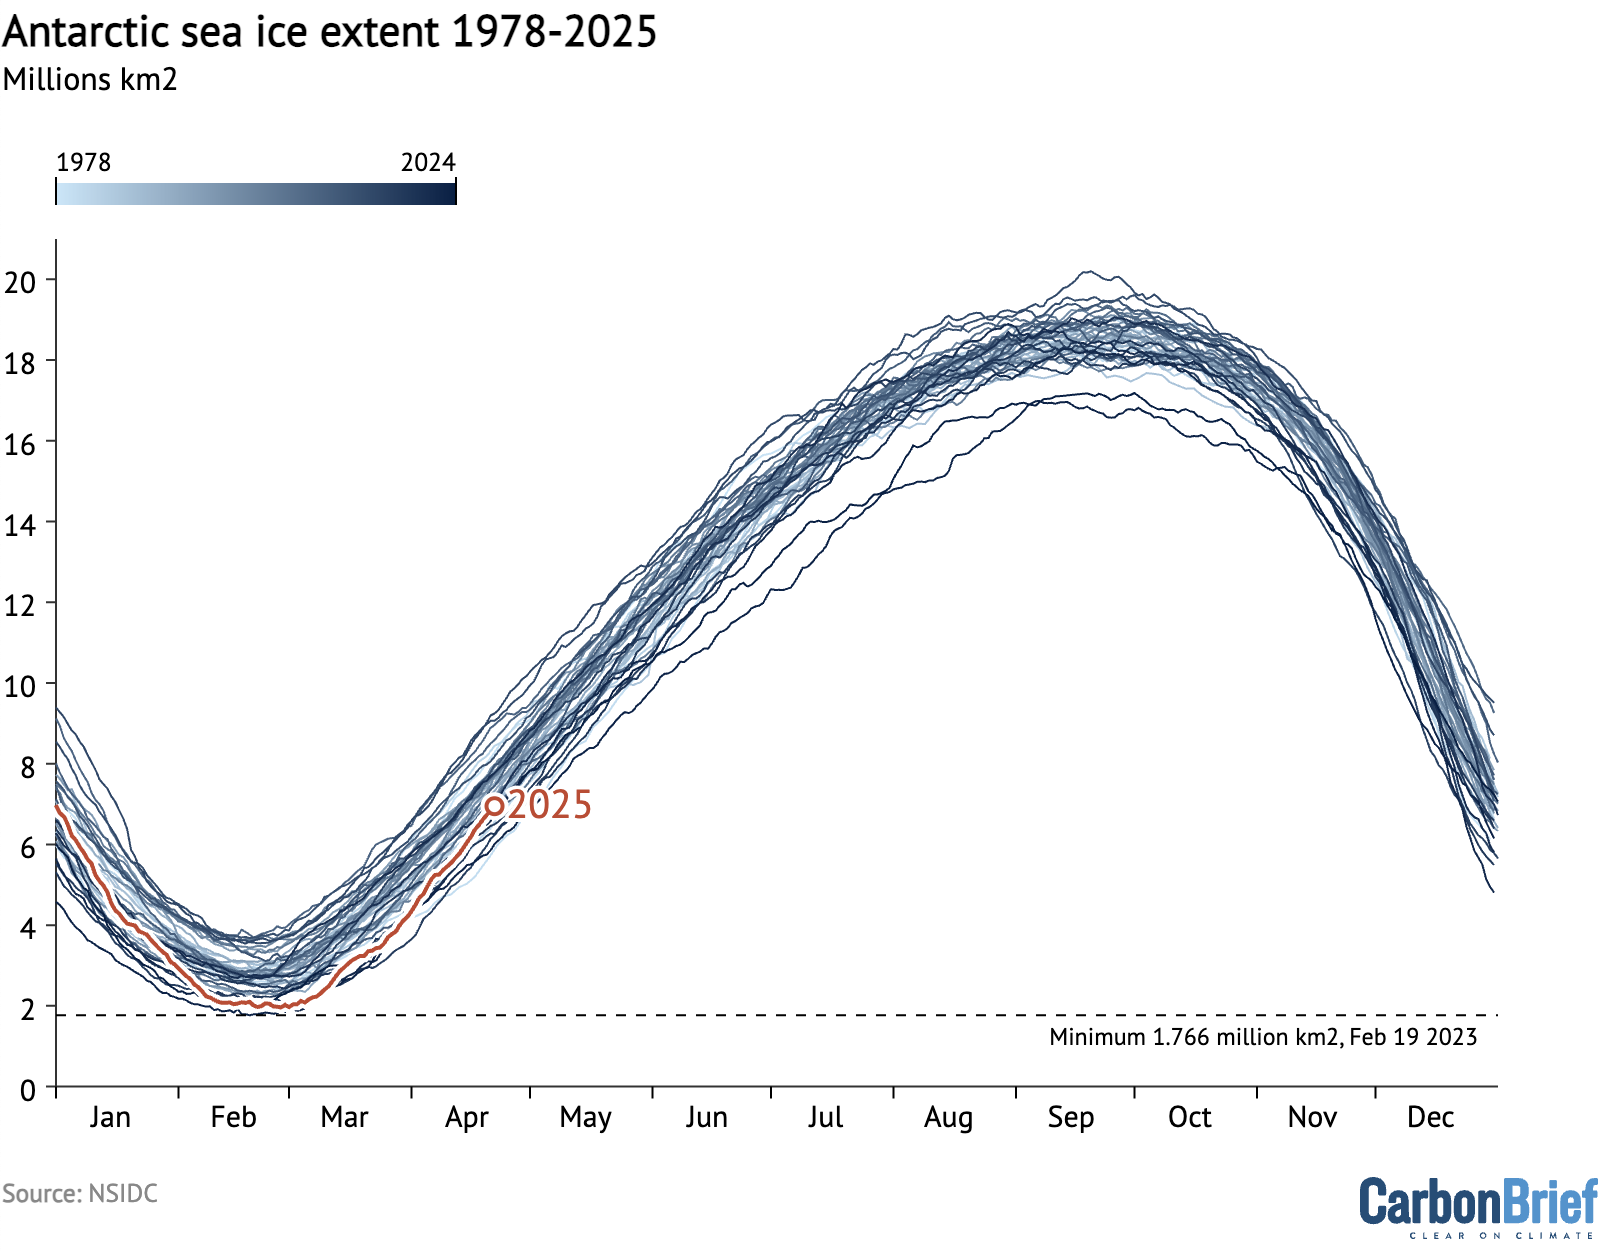
In addition to near-record warmth, the start of 2025 has seen record-low sea ice cover in the Arctic between January and March – and the second-lowest minimum sea ice extent on record for Antarctica.
The figure below shows the annual temperatures from each of these groups since 1970, along with the average over the first three months of 2025.
(It is worth noting that the first three months may not be representative of the year as a whole, as greater historical warming rates mean that temperatures relative to pre-industrial levels tend to be larger in the northern hemispheric winter months of December, January and February.)https://interactive.carbonbrief.org/state-of-the-climate/2025-04/records-with-2024-to-date.htmlAnnual global average surface temperatures from NASA GISTEMP, NOAA GlobalTemp, Hadley/UEA HadCRUT5, Berkeley Earth and Copernicus/ECMWF (lines), along with 2025 temperatures so far (January-March, coloured dots). Anomalies plotted with respect to the 1981-2010 period, and shown relative to pre-industrial based on the average pre-industrial temperatures in the Hadley/UEA, NOAA and Berkeley datasets that extend back to 1850. Chart by Carbon Brief.
Starting with this state of the climate update, Carbon Brief will be showing a World Meteorological Organization (WMO) aggregate of the five surface temperature records, rather than highlighting any particular one, reflecting a single best-estimate across the different groups.
The WMO aggregate is calculated by averaging the different records using a common 1981-2010 baseline period, before adding in the average warming since the pre-industrial period (1850-1900) across the datasets – NOAA, Hadley, and Berkeley – that extend back to 1850.
The figure below shows how global temperature so far in 2025 (black line) compares to each month in different years since 1940 (with lines coloured by the decade in which they occurred) in the WMO aggregate of surface temperature dataset.https://interactive.carbonbrief.org/state-of-the-climate/2025-04/monthly-global-temp-anomalies.htmlTemperatures for each month from 1940 to 2025 from the WMO aggregate of temperature records. Anomalies plotted with respect to a 1850-1900 baseline. Chart by Carbon Brief.
The first three months of 2025 have been unusually warm, coming in in the top-three warmest on record across all the different scientific groups that report on global surface temperatures. This is despite the presence of moderate La Niña conditions in the tropical Pacific, which typically suppress global temperatures.
January 2025 was the warmest January on record in the WMO aggregate, February was the third warmest and March was tied with 2016 as the second warmest.
When combined, the first three months of the year in 2025 were the second-warmest Q1 period in the historical record, just 0.035C below the record set in 2024 after the peak of a strong El Niño event, as shown in the figure below.https://interactive.carbonbrief.org/state-of-the-climate/2025-04/Q1-temp-plot.htmlQ1 temperature anomalies from 1850 through 2025 from the WMO aggregate of temperature records. Anomalies plotted with respect to a 1850-1900 baseline. Chart by Carbon Brief.
The persistence of warmth after the end of the 2023-24 El Niño event – and through a weak La Niña – has been highly unusual by historical standards. In most prior cases, global temperatures returned closer to the long-term temperature trend following the return to neutral El Niño Southern Oscillation (ENSO) conditions in the tropical Pacific.
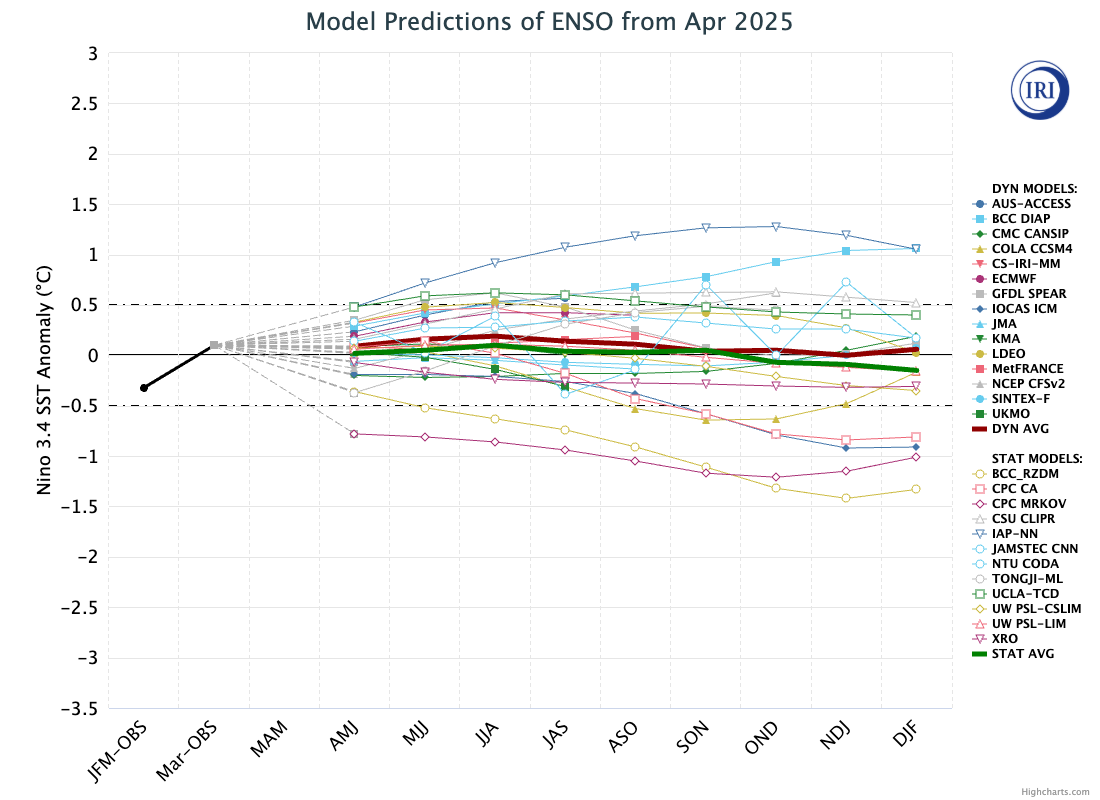
Weak La Niña conditions have faded over the past month, with ENSO-neutral conditions returning and expected to persist for most models through the remainder of the year. However, predictions of ENSO status are particularly uncertain at this time of year due to a phenomenon known as the “spring predictability barrier”.
The figure below shows a range of different forecast models for the ENSO for the rest of this year, produced by different scientific groups. The values shown are sea surface temperature variations in the tropical Pacific – known as the El Niño 3.4 region – for overlapping three-month periods.
By looking at the relationship between the first three months and the annual temperatures for every year since 1970 – as well as ENSO conditions for the first three months of the year and the projected development of El Niño conditions for the remaining nine months – Carbon Brief has created a projection of what the final global average temperature for 2025 will likely be.
The analysis includes the estimated uncertainty in 2025 outcomes, given that temperatures from only the first quarter of the year are available so far.
The chart below shows the expected range of 2025 temperatures using the WMO aggregate – including a best-estimate (red) and year-to-date value (yellow). Temperatures are shown with respect to the pre-industrial baseline period (1850-1900).https://interactive.carbonbrief.org/state-of-the-climate/2025-04/Q1-2025-estimate.htmlAnnual global average surface temperature anomalies from the WMO aggregate plotted with respect to a 1850-1900 baseline. To-date 2025 values include January-March. The estimated 2025 annual value is based on the relationship between the January-March temperatures and annual temperatures between 1970 and 2024. Chart by Carbon Brief.
Carbon Brief’s projection suggests that 2025 is virtually certain to be one of the top-three warmest years, with a best-estimate approximately equal to global temperatures in 2023.
However, this model assumes that 2025 follows the type of climate patterns seen in the past – patterns that were notably broken in 2023 – and to a lesser extent in 2024. Other recent estimates – such as one published by Berkeley Earth – give a higher probability of around 34% that 2025 will set a new temperature record.
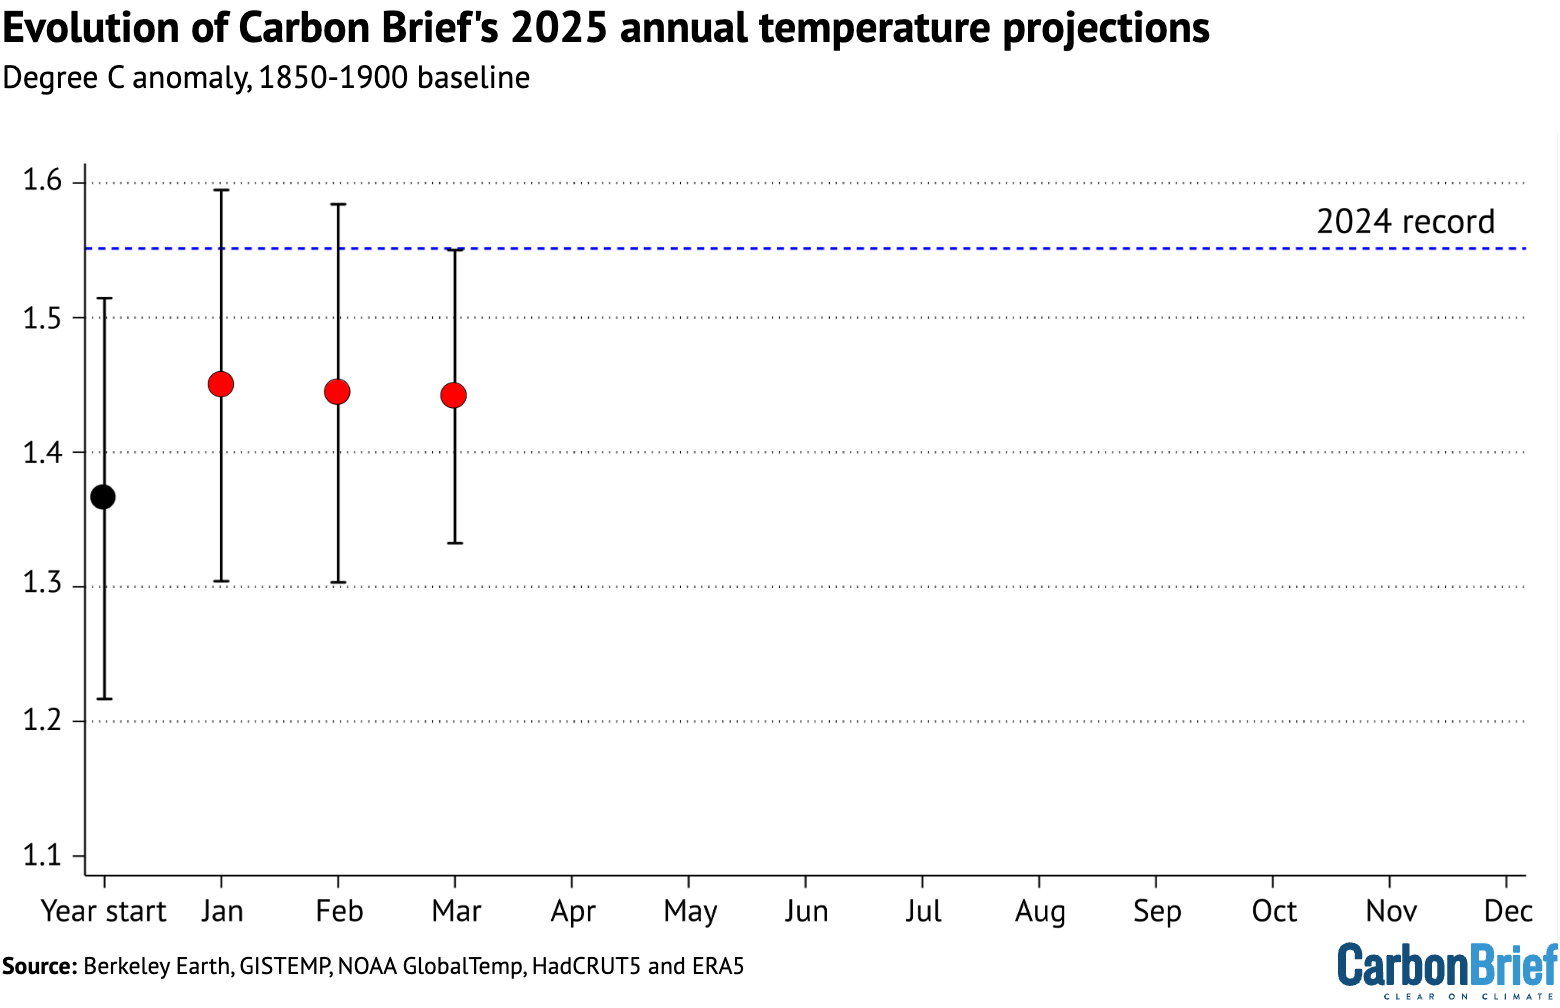
The figure below shows Carbon Brief’s estimate of 2025 temperatures using the WMO aggregate, both at the beginning of the year and once each month’s data has come in. The estimate jumped notably after t2025 saw the warmest January on record, but has been relatively stable over the past three months.
Carbon Brief’s projection of global temperatures based on the WMO aggregate at the start of the year, and after January, February, and March global surface temperature data became available. Chart by Carbon Brief.
Record-low Antarctic and Arctic sea ice
Both Arctic and Antarctic sea ice extent spent much of early 2025 at record, or near-record, lows.
The figure below shows both Arctic and Antarctic sea ice extent in 2025 (solid red and blue lines), the historical range in the record between 1979 and 2010 (shaded areas) and the record lows (dotted black line).
(Unlike global temperature records, which only report monthly averages, sea ice data is collected and updated on a daily basis, allowing sea ice extent to be viewed up to the present.)https://interactive.carbonbrief.org/state-of-the-climate/2025-04/sea-ice-graph.htmlArctic and Antarctic daily sea ice extent from the US National Snow and Ice Data Center (NSIDC). The bold lines show daily 2025 values, the shaded area indicates the two standard deviation range in historical values between 1979 and 2010. The dotted black lines show the record lows for each pole. Chart by Carbon Brief.
Arctic sea ice saw a new record low nearly each day between January and March, recording a record-low winter peak extent in late March. Ice extent subsequently moved out of record-low territory in April.
It is worth noting that, as northern hemisphere winter conditions remain cold enough to refreeze sea ice, there tends to be less variability in extent year-to-year in the winter than in the summer, as the chart below illustrates.
Antarctic sea ice started the year within the historical range (1979-2010), before plunging to tie for the second-lowest minimum on record in late February. It has since recovered in April, and is currently on the low end of the historical range.
dizzy: Trump is attempting to censor research and information like this.
Neo-Fascist Climate Science Denier Donald Trump says Burn, Baby, Burn.Elon Musk urges you to be a Fascist like him, says that you can ignore facts and reality then.Orcas discuss Donald Trump and the killer apes’ concept of democracy. Front Orca warns that Trump is crashing his country’s economy and that everything he does he does for the fantastically wealthy.
New findings from an alliance of NGOs challenges the belief that climate falsehoods are confined to social media.
Climate disinformation was routinely broadcast in news programmes across French TV and radio in the first three months of 2025, with 128 verified cases identified by an alliance of NGOs.
Using AI to identify misleading narratives, which were then reviewed by fact-checkers, the alliance assessed programmes classed as “news” by the French broadcast regulator ARCOM from 19 TV and radio stations.
A preliminary report was produced by the French NGOs Data For Good, QuotaClimat, and Science Feedback. The study also identified 379 cases of ‘discourses of delay’ – arguments intended to slow the transition to carbon neutrality by undermining climate science, solutions or experts – which focused particularly on discrediting advocates of net zero. The final results will be published in September.
“We expected to find cases, but not a finding of this magnitude. It truly reflects how climate disinformation has been underestimated as a threat by the news media,” said Eva Morel, secretary general of QuotaClimat.
“This is a call to action: climate disinformation is being normalised, and we need trusted sources of information to counter it before it is too late.”
The majority of these attacks (61 percent) were aimed at discrediting solutions to the climate crisis, while 13 percent attempted to deny or minimise the scientific consensus on climate change.
Private media companies were responsible for 81 percent of climate disinformation broadcast. One station – Sud Radio – broadcast one-third of all the cases identified by the researchers.
The station, owned by the consultancy firm Fiducial, attracts over 4.5 million monthly listeners, and was the first to receive a warning from the French broadcast regulator ARCOM in 2024 for broadcasting climate science denial. Sud Radio was approached for comment.
The same year, the regulator levied at €20,000 fine against another TV station, CNews, for a similar broadcast violation.
The report highlights how the success of anti-climate political parties across the Western world is fuelling climate disinformation on the news.
The researchers found a “significant spike in climate disinformation” during the week of Donald Trump’s inauguration in January, with almost half of the disinformation referencing the new president’s views on climate change.
“Given the growing influence of governments that openly deny climate change around the world, and the rising media and electoral traction of political parties positioning themselves on this issue, the permeability of traditional media to climate disinformation during geopolitical events is alarming,” the report states.
For example, Philippe Karsenty, the spokesperson for ‘Trump France’, said during an interview with BMFTV on 21 January: “we’ve been lied to for years” about climate change, which the interviewer did not correct.
The report alleges that broadcasting such a comment without a correction is in direct breach of an agreement that BMFTV renewed with ARCOM in December 2024. Namely, the agreement states that BFMTV commits to “ensuring honesty of information in its programming” and “distinguishing between facts and commentary” when presenting on “controversial issues”. BMFTV was approached for comment.
The alliance recommends that newsrooms expand coverage of environmental issues, support journalist training in environmental literacy, and introduce live fact-checking teams for interviews.
The alliance also urges ARCOM to respond to complaints of climate disinformation with “speed and proportionality”. It encourages advertisers to reassess their partnerships with broadcasters who spread climate disinformation and raise concerns with the stations.
The growing prominence of climate disinformation on broadcast channels is an issue across the Western world. As revealed by DeSmog, one-third of presenters on the right-wing platform GB News expressed climate science denial on air in 2022. GB News, which is co-owned by the hedge fund manager Paul Marshall, has given dozens of appearances to groups that reject basic climate facts.
However, the UK’s broadcast regulator Ofcom has so far refused to investigate the channel for spreading false climate claims.
Donald Trump has voiced plans to withdraw the US from the Paris Agreement, and possibly from the entire UNFCCC, after assuming the US presidency this year (Credit: Getty Images)
…
Yearlong: Extreme weather continues
As these global opportunities to make a difference on climate roll around, there is another certainty running through the calendar year: climate-driven extreme weather.
As long as we continue to burn fossil fuels, headlines in 2025 and beyond will continue to be dominated by large death tolls, suffering and destruction due to ever more extreme weather events – Friederike Otto
What’s harder to know is exactly when disasters will hit. But 2025 is also expected to be a scorcher: it will be one of the three hottest years on record globally, according to an outlook from the UK’s Met Office, falling just behind 2024 and 2023. Warm temperatures are forecast in 2025 despite the Pacific Ocean moving into a La Niña phase, in which sea surface temperatures are lower than usual and conditions overall are cooler.
“Years such as 2025, which aren’t dominated by the warming influence of El Niño, should be cooler,” Adam Scaife, head of long-range prediction at the Met Office, stated in the outlook.
Still, the Met Office expects average global temperature in 2025 to be 1.29C to 1.53C above pre-industrial temperatures.
Friederike Otto, who leads World Weather Attribution group, says the La Niña predictions mean 2025 “might be cooler than 2024” but argues “this is really irrelevant” if natural climate variability is masking the overall warming trend.
Protesters march in Huddersfield Photo: Neil Terry Photography
THE first Palestine protests of 2025 took place across Britain at the weekend.
In Wales, campaigners staged a day of healthcare protests including outside Maelor Hospital in Wrexham.
The protest was against “the total destruction of key hospitals and healthcare facilities in Gaza and the wholesale slaughter of Palestinian doctors, nurses and paramedics by the Israeli military.”
A freedom march was also staged through the town of Huddersfield in West Yorkshire on Saturday, organised by Huddersfield Freedom For Palestine.
And hundreds marched through the streets of Manchester on Saturday in a weekly protest organised by Greater Manchester Friends of Palestine (GMFP), which brings together a dozen support groups in the region.
…
Palestine Solidarity Campaign said: “Israel is escalating its attack on Palestinian healthcare system — attacking hospitals and imprisoning hundreds of healthcare workers.
“Join us to demand our government takes action to save Gaza’s healthcare workers.”
The next national demonstration for Palestine takes place in London on January 20.
Genocide denier and Current UK Prime Minister Keir Starmer is quoted that he supports Zionism without qualification. He also confirms that UK air force support has been essential in Israel’s mass-murdering genocide. Includes URLs https://www.declassifieduk.org/keir-starmers-100-spy-flights-over-gaza-in-support-of-israel/ and https://youtu.be/O74hZCKKdpAUK Foreign Minister David Lammy confirms that UK government and military are active participants in Israel’s genocides and that the F-35 parts that they suspended from supplying to Israel are instead simply diverted via the United States. He says see https://youtu.be/QILgUHrdWRE