A heatwave in Antarctica totally blew the minds of scientists. They set out to decipher it – and here are the results

Spread the love

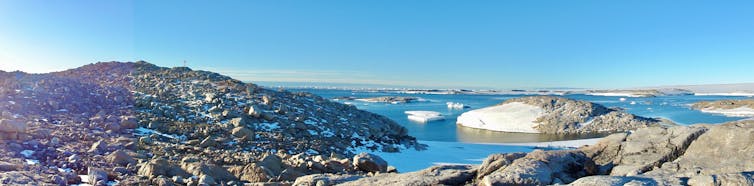
DM Bergstrom, Author provided

Dana M Bergstrom, University of Wollongong

Climate scientists don’t like surprises. It means our deep understanding of how the climate works isn’t quite as complete as we need. But unfortunately, as climate change worsens, surprises and unprecedented events keep happening.

In March 2022, Antarctica experienced an extraordinary heatwave. Large swathes of East Antarctica experienced temperatures up to 40°C (72°F) above normal, shattering temperature records. It was the most intense heatwave ever recorded anywhere in the world.

So shocking and rare was the event, it blew the minds of the Antarctic climate science community. A major global research project was launched to unravel the reasons behind it and the damage it caused. A team of 54 researchers, including me, delved into the intricacies of the phenomenon. The team was led by Swiss climatologist Jonathan Wille, and involved experts from 14 countries. The collaboration resulted in two groundbreaking papers published today.

The results are alarming. But they provide scientists a deeper understanding of the links between the tropics and Antarctica – and give the global community a chance to prepare for what a warmer world may bring.

Head-hurting complexity

The papers tell a complex story that began half a world away from Antarctica. Under La Niña conditions, tropical heat near Indonesia poured into the skies above the Indian Ocean. At the same time, repeated weather troughs pulsing eastwards were generating from southern Africa. These factors combined into a late, Indian Ocean tropical cyclone season.

Between late February and late March 2022, 12 tropical storms had brewed. Five storms revved up to become tropical cyclones, and heat and moisture from some of these cyclones mashed together. A meandering jet stream picked up this air and swiftly transported it vast distances across the planet to Antarctica.

Below Australia, this jet stream also contributed to blocking the eastward passage of a high pressure system. When the tropical air collided with this so-called “blocking high”, it caused the most intense atmospheric river ever observed over East Antarctica. This propelled the tropical heat and moisture southward into the heart of the Antarctic continent.

Luck was on Antarctica’s side

The event caused the vulnerable Conger Ice Shelf to finally collapse. But the impacts were otherwise not as bad as they could have been. That’s because the heatwave struck in March, the month when Antarctica transitions to its dark, extremely cold winter. If a future heatwave arrives in summer – which is more likely under climate change – the results could be catastrophic.

Despite the heatwave, most inland temperatures stayed below zero. The spike included a new all-time temperature high of -9.4°C (15.1°F) on March 18 near Antarctica’s Concordia Research Station. To understand the immensity of this, consider that the previous March maximum temperature at this location was -27.6°C (-17.68°F). At the heatwave’s peak, 3.3 million square kilometres in East Antarctica – an area about the size of India – was affected by the heatwave.

The impacts included widespread rain and surface melt along coastal areas. But inland, the tropical moisture fell as snow – lots and lots of snow. Interestingly, the weight of the snow offset ice loss in Antarctica for the year. This delivered a temporary reprieve from Antarctica’s contribution to global sea-level rise.

An ice shelf before (left) and after (right) a collapse.
These images, acquired by the Copernicus Sentinel-2 satellites on January 30 2022 (left) and March 21 2022 (right), show the Conger ice shelf before and after the collapse, which was triggered by a shocking heatwave.
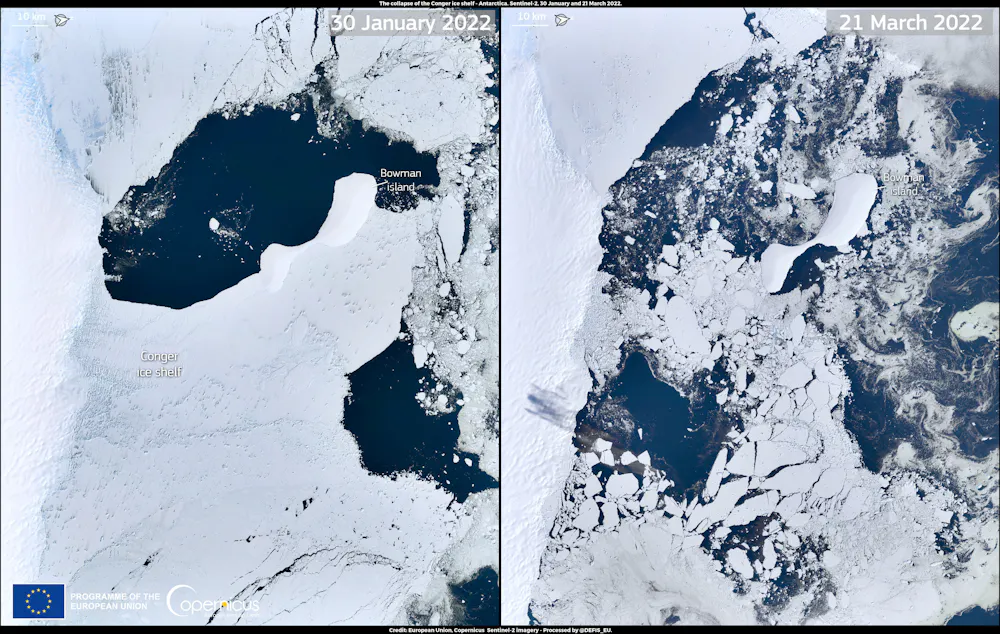
European Union, Copernicus Sentinel-2 satellite imagery, CC BY

Learning from the results

So what are the lessons here? Let’s begin with the nice bit. The study was made possible by international collaboration across Antarctica’s scientific community, including the open sharing of datasets. This collaboration is a touchstone of the Antarctic Treaty. It serves as a testament to the significance of peaceful international cooperation and should be celebrated.

Less heartwarmingly, the extraordinary heatwave shows how compounding weather events in the tropics can affect the vast Antarctic ice sheet. The heatwave further reduced the extent of sea ice, which was already at record lows. This loss of sea ice was exacerbated this year resulting in the lowest summer and winter sea ice ever recorded. It shows how disturbances in one year can compound in later years.

The event also demonstrated how tropical heat can trigger the collapse of unstable ice shelves. Floating ice shelves don’t contribute to global sea-level rise, but they acts as dams to the ice sheets behind them, which do contribute.

This research calculated that such temperature anomalies occur in Antarctica about once a century, but concluded that under climate change, they will occur more frequently.

The findings enable the global community to improve its planning for various scenarios. For example, if a heatwave of similar magnitude hit in summer, how much ice melt would there be? If an atmospheric river hit the Doomsday glacier in the West Antarctic, what rate of sea level rise would that trigger? And how can governments across the world prepare coastal communities for sea level rise greater than currently calculated?

This research contributes another piece to the complex jigsaw puzzle of climate change. And reminds us all, that delays to action on climate change will raise the price we pay.

This article has been amended to correct an error in converting a 40°C temperature difference from Celsius to Fahrenheit.The Conversation

Dana M Bergstrom, Honorary Senior Fellow, University of Wollongong

This article is republished from The Conversation under a Creative Commons license. Read the original article.

Continue ReadingA heatwave in Antarctica totally blew the minds of scientists. They set out to decipher it – and here are the results

On a climate rollercoaster: how Australia’s environment fared in the world’s hottest year

Spread the love
An endangered yellow-footed rock wallaby. Joshua Bergmark

Albert Van Dijk, Australian National University; Shoshana Rapley, Australian National University, and Tayla Lawrie, The University of Queensland

Global climate records were shattered in 2023, from air and sea temperatures to sea-level rise and sea-ice extent. Scores of countries recorded their hottest year and numerous weather disasters occurred as climate change reared its head.

How did Australia’s environment fare against this onslaught? In short, 2023 was a year of opposites.

For the past nine years, we have trawled through huge volumes of data collected by satellites, measurement stations and surveys by individuals and agencies. We include data on global change, oceans, people, weather, water, soils, vegetation, fire and biodiversity.

Each year, we analyse those data, summarising them in an that includes an overall Environmental Condition Score and regional scorecards. These scores provide a relative measure of conditions for agriculture and ecosystems. Scores declined across the country, except in the Northern Territory, but were still relatively good.

However, the updated Threatened Species Index shows the abundance of listed bird, mammal and plant species has continued to decline at a rate of about 3% a year since the turn of the century.

Environmental condition indicators for 2023, showing the changes from 2000–2022 average values. Such differences can be part of a long-term trend or within normal variability.
Australia’s Environment 2023 Report.

Riding a climate rollercoaster in 2023

Worldwide, 77 countries broke temperature records. Australia was not one of them. Our annual average temperature was 0.53°C below the horror year 2019. Temperatures in the seas around us were below the records of 2022.

Even so, 2023 was among Australia’s eight warmest years in both cases. All eight came after 2005.

However, those numbers are averaged over the year. Dig a bit deeper and it becomes clear 2023 was a climate rollercoaster.

The year started as wet as the previous year ended, but dry and unseasonably warm weather set in from May to October. Soils and wetlands across much of the country started drying rapidly. In the eastern states, the fire season started as early as August.

Nonetheless, there was generally still enough water to support good vegetation growth throughout the unusually warm and sunny winter months.

Fears of a severe fire season were not realised as El Niño’s influence waned in November and rainfall returned, in part due to the warm oceans. Combined with relatively high temperatures, it made for a hot and humid summer. A tropical cyclone and several severe storms caused flooding in Queensland and Victoria in December.

As always, there were regional differences. Northern Australia experienced the best rainfall and growth conditions in several years. This contributed to more grass fires than average during the dry season. On the other hand, the rain did not return to Western Australia and Tasmania, which ended the year dry.

So how did scores change?

Every year we calculate an Environmental Condition Score that combines weather, water and vegetation data.

The national score was 7.5 (out of 10). That was 1.2 points lower than for 2022, but still the second-highest score since 2011.

Scores declined across the country except for the Northern Territory, which chalked up a score of 8.8 thanks to a strong monsoon season. With signs of drought developing in parts of Western Australia, it had the lowest score of 5.5.

The Environmental Condition Score reflects environmental conditions, but does not measure the long-term health of natural ecosystems and biodiversity.

Firstly, it relates only to the land and not our oceans. Marine heatwaves damaged ecosystems along the eastern coast. Surveys in the first half of 2023 suggested the recovery of the Great Barrier Reef plateaued.

However, a cyclone and rising ocean temperatures occurred later in the year. In early 2024, another mass coral bleaching event developed.

Secondly, the score does not capture important processes affecting our many threatened species. Among the greatest dangers are invasive pests and diseases, habitat destruction and damage from severe weather events such as heatwaves and megafires.

Threatened species’ declines continued

The Threatened Species Index captures data from long-term threatened species monitoring. The index is updated annually with a three-year lag, largely due to delays in data processing and sharing. This means the 2023 index includes data up to 2020.

The index showed an unrelenting decline of about 3% in the abundance of Australia’s threatened bird, mammal and plant species each year. This amounts to an overall decline of 61% from 2000 to 2020.

Line graph of Threatened Species Index
Threatened Species Index showing the abundance of different categories of species listed under the EPBC Act relative to 2000.
Australia’s Environment 2023 Report

The index for birds in 2023 revealed declines were most severe for terrestrial birds (62%), followed by migratory shorebirds (47%) and marine birds (24%).

A record 130 species were added to Australia’s threatened species lists in 2023. That’s many more than the annual average of 29 species over previous years. The 2019–2020 Black Summer bushfires had direct impacts on half the newly listed species.

Population boom adds to pressures

Australia’s population passed 27 million in 2023, a stunning increase of 8 million, or 41%, since 2000. Those extra people all needed living space, food, electricity and transport.

Australia’s greenhouse gas emissions have risen by 18% since 2000. Despite small declines in the previous four years, emissions increased again in 2023, mostly due to air travel rebounding after COVID-19.

Our emissions per person are the tenth-highest in the world and more than three times those of the average global citizen. The main reasons are our coal-fired power stations, inefficient road vehicles and large cattle herd.

Nonetheless, there are reasons to be optimistic. Many other countries have dramatically reduced emissions without compromising economic growth or quality of life. All we have to do is to finally follow their lead.

Our governments have an obvious role to play, but we can do a lot as individuals. We can even save money, by switching to renewable energy and electric vehicles and by eating less beef.

Changing our behaviour will not stop climate change in its tracks, but will slow it down over the next decades and ultimately reverse it. We cannot reverse or even stop all damage to our environment, but we can certainly do much better.The Conversation

Albert Van Dijk, Professor, Water and Landscape Dynamics, Fenner School of Environment & Society, Australian National University; Shoshana Rapley, Research Assistant, Fenner School of Environment & Society, Australian National University, and Tayla Lawrie, Project Manager, Threatened Species Index, The University of Queensland

This article is republished from The Conversation under a Creative Commons license. Read the original article.

Continue ReadingOn a climate rollercoaster: how Australia’s environment fared in the world’s hottest year

Tennis anyone? Bad news for skiers as snow season could shrink by 78% this century

Spread the love

Adrian McCallum, University of the Sunshine Coast

As the days shorten, many of us, particularly in Australia’s south-east, are looking forward to cooler times, and perhaps the allure of snow on the horizon. In the past week many in this region experienced their warmest days for over a century. What does this bode for times to come?

Research released overnight suggests ski areas in Australia and Aotearoa New Zealand will soon have much less snow due to climate change. German researcher Veronika Mitterwallner and her colleagues show average annual snow-cover days may decline by 78% in the Australian Alps and 51% in the Southern Alps of Aotearoa New Zealand (under a high-emissions scenario) by 2071–2100. Worldwide, they found 13% of ski areas will lose all natural snow cover by the end of the century.

It’s often said Australia gets more snow than Switzerland, though the evidence says otherwise. The fact remains that the Australian Alps cover a large area, more than 12,000km, with a third or more covered in snow at peak times. So these changes will have a broad impact on local economies and threaten fragile alpine ecosystems.

a panoramic view of the Australian Alps covered in snow
If Australia loses three-quarters of its snow-cover days, a surprisingly big area will be affected.
Greg Brave/Shutterstock

How did the study make these findings?

Mitterwallner’s team used a high-resolution climate data set for the global land surface area to identify the annual number of natural snow-cover days. Then, they projected those data under three emissions scenarios, and looked at historical (1950-2010), present (2011-2040), immediate future (2041-2070) and near future (2071-2100) data to examine changes over time.

Under most modelled emission scenarios, they found the annual number of snow-cover days will greatly decrease worldwide. For Australia and Aotearoa New Zealand, in particular, they found the average number will decrease by 78% and 51% respectively. These were the two regions with the greatest losses of snow.

However, under a low-emissions scenario, the good news is no regions will fall below an average of 100 snow-cover days a year. This is historically the minimum number of days a ski resort needs in seven out of ten winters to remain viable (cover must be at least 30–50cm).

How will we adapt to the loss of snow?

Will the way we use our alpine areas have to change permanently? Many resorts have already pivoted to activities such as mountain biking that don’t rely on snow. Skiing may be off the agenda – tennis anyone?

The prognosis of such research has driven the formation of groups such as Protect Our Winters. The mission of the Australian section is to help Australia’s outdoor community protect the integrity of our unique alpine environment and lifestyle from climate change.

Beyond Australia, New York recently had its highest snowfall in two years. Across the United States in general, though, they just experienced the warmest winter ever.

What is going on? And what might this new research mean, particularly for Australia and Aotearoa New Zealand?

These predictions, for almost all emissions scenarios, do not bode well for the skiers among us. More importantly, as many communities in the Himalaya are finding out, snow is not just a recreational “nice to have”. It’s a life-source for alpine communities, both human and non-human, and all those that depend on rivers sustained by snow melt around the globe.

Perhaps a greater concern in our region is the potential for ecological damage as resorts seek to increase ski slope metreage in areas that remain snow-covered. Expanding resort footprints is not a sustainable approach to a problem that probably won’t be going away.

A snow machine shoots out a plume of snow in the Snowy Mountains
Resorts can make artificial snow, but that doesn’t solve the problem of it melting if the alps get warmer.
Edward Atkin/Shutterstock

Is artificial snow an option?

So how might we support the goals of Protect Our Winters? What alternatives do we have? How about artificial snow, would that work?

As part of my PhD studies many years ago, at the University of Cambridge’s Scott Polar Research Institute, I made masses of “polar snow” in a cold room (while effectively destroying the air-conditioning units at the same time). Artificial snow can be created quite readily, assuming enough water is at hand.

Artificial snow will have a different form and its density and microstructure will differ, potentially affecting longevity. (You can read more about snow mechanics here.)

But once on the ground, artificial snow, like natural snow, is subject to the vagaries of our weather. If the sun is shining and the day is hot, snow won’t last long, regardless of whether it’s natural or artificial.

There’s a lot to think on here as we contemplate what our world and our region might look like when skiing and snow-covered ground become no more than a memory in some areas. Yes, our recreational activities might change as we wonder whether it’s worth waxing up the skis this year – or is it time to break out the racquets? The ongoing survival of many communities might be jeopardised as a result.The Conversation

Adrian McCallum, Discipline Lead – Engineering, University of the Sunshine Coast

This article is republished from The Conversation under a Creative Commons license. Read the original article.

Continue ReadingTennis anyone? Bad news for skiers as snow season could shrink by 78% this century