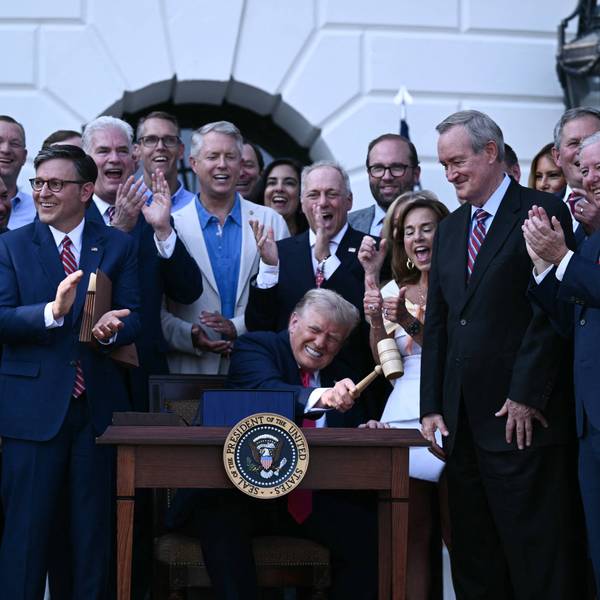
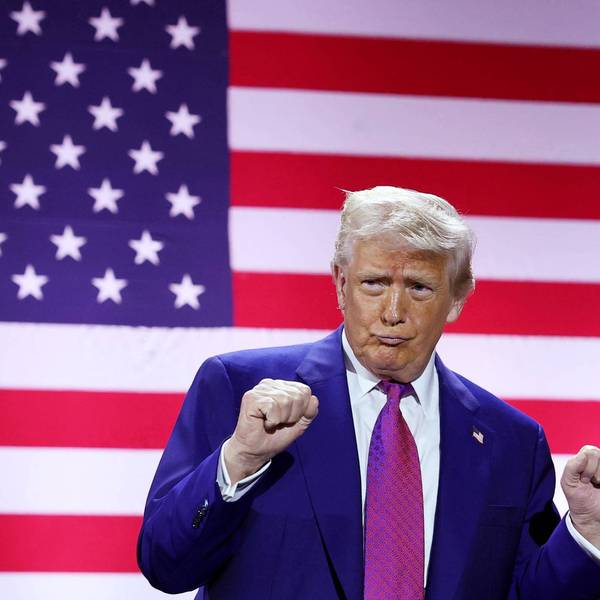
Trump Plans to Make 250th US Birthday ‘All About Himself’ With Long Speech, Late Fireworks
Article by Brett Wilkins republished form Common Dreams under Creative Commons (CC BY-NC-ND 3.0).
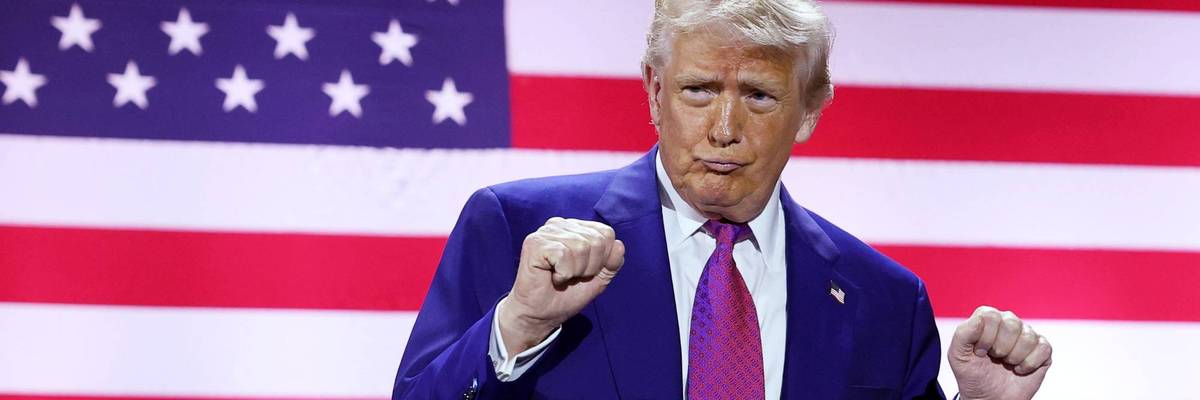
One journalist said that “this is like the epitome of personalist rule—turning this into an imperial, dictatorial display of self-glorification.”
As the desolate debacle of President Donald Trump’s “Great American State Fair” continues against a backdrop of an empty National Mall and Shrek-green Lincoln Memorial Reflecting Pool, criticism of the president’s plans for his “most spectacular Trump rally” and record-seeking fireworks show mounted this week as new details of his self-aggrandizing extravaganza emerged.
“Our luck has it that America’s 250 was when Trump is president, and we know that a big thrust of these 250 commemorations are in a lot of ways a celebration of Trump and Trumpism, and if it’s not direct, it’s the vision that Trump and the MAGA movement has of America,” Center on Conscience & War executive director Mike Prysner told BreakThrough News on Tuesday.
RECOMMENDED…
Money Flows Reveal ‘Trumpified’ 250th Celebration Rife With ‘Grift, Self-Dealing, and Enriching Friends’

Pro-Democracy Coalition Plans Mass Mobilization to Counter Trump-Centered 250th Birthday
Media Matters for America senior fellow Matt Gertz told Greg Sargent, who hosts The New Republic’s The Daily Blast podcast, that “the fact that we are not going to be able to have a real celebration of America’s 250th birthday—one that respects how far we have traveled, how far we have to go… it’s a real shame that this is what we’re going to get instead: a would-be authoritarian ruler trying to make it all about himself.”
On Monday, the Federal Aviation Administration made a late announcement that it would be shutting down air traffic at Ronald Reagan Washington National Airport for three hours on July 3 and 12 hours on the Fourth of July “to help ensure the safe and efficient movement of air traffic during celebrations of America’s 250th birthday, including the iconic flyovers and fireworks.”
During a rally planned for July 4, Trump is expected to speak for at least 45 minutes starting at 9:00 pm. While attendees are advised to arrive very early, they’re reportedly not allowed to bring coolers, lawn chairs, bags, or more than one bottle of water on a day when temperatures are forecast to soar to triple-digits.
Trump said earlier this month that a military flyover featuring a 17-aircraft formation will include the $400 million Boeing 747-8 “flying palace” gifted to Trump by the repressive Qatari monarchy.s
US Interior Secretary Doug Burgum told Fox News on Sunday that the Trump administration is then planning the “greatest and biggest celebration of fireworks ever.”
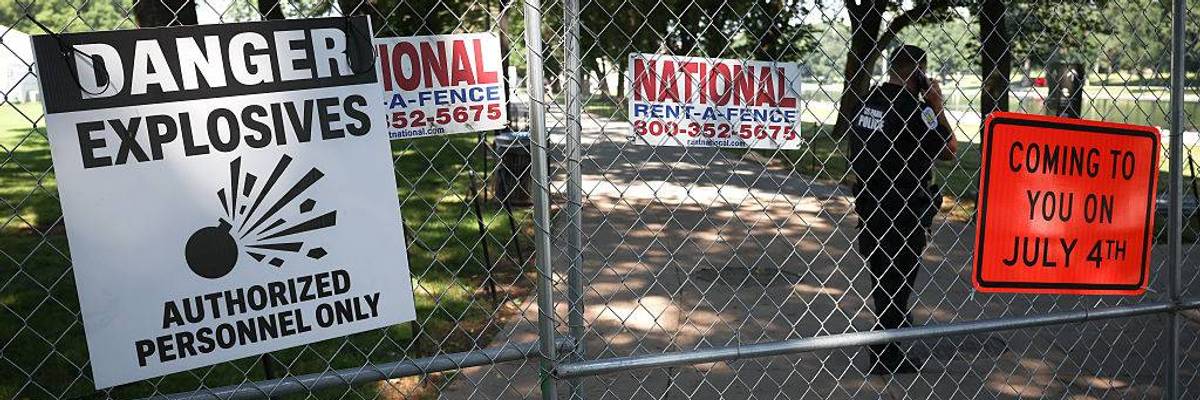
The Washington Post reported Tuesday that 850,000 fireworks will be detonated in a 40-minute show scheduled to start unusually late—after 10:30 and possibly even 11:00 pm. That’s 50 times as many explosions over twice the length of a typical Fourth of July fireworks show, which even in a typical year can spark severe anxiety in dogs and other pets and post-traumatic stress disorder in veterans.
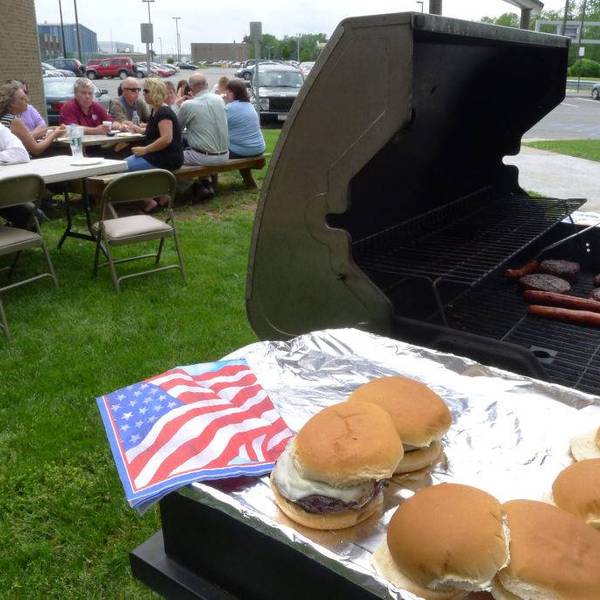
If Trump’s so-called “Great American State Fair” is any indication, there should be plenty of lawn space available on the National Mall for the July 4 events.
While the president posted a self-congratulatory message to his Truth Social Network on Monday, praising the “fantastic job” his administration has done during the first week of the event and claiming the National Mall was “packed with happy people,” attendees and journalists reported “light crowds, short lines, and plenty of open space.”
This, despite a nationwide ad blitz on Fox and other networks and websites viewed by scores of millions of people.
Some called it the “Great American Fail.”
Former Republican Congressman Adam Kinzinger of Illinois said in a video posted Monday on Bluesky that “10 years ago I voted to create ‘America 250.’ But here’s the truth: Trump started ‘Freedom 250’ to replace it, and made it about himself. Trump’s newest stunt? Trying to convince us there’s a big crowd for Freedom 250. But our eyes don’t lie.”
María José Gutierrez Chavez, trending news writer at the business magazine Fast Company, described “the unbearable emptiness of the Great American State Fair,” writing that the purported celebration “looks more like a liminal space.”
Gutierrez cited one TikTok user who commented, “I’ve seen graveyards with more people,” and another who said that “there were more people in line for the Trader Joe’s summer tote bags.”
Meanwhile, the iconic Lincoln Memorial Reflecting Pool, a focal point of the semiquincentennial festivities, remains what Common Dreams columnist Abby Zimet described Tuesday as a “fetid debacle” as cleaning up the algae-choked centerpiece proves more difficult than anticipated.
Instead of blaming the no-bid contracted company owned by a Trump donor for the emerald embarrassment, detractors say the president has humiliated himself even further by attempting to pin the blame for his administration’s failure on elusive vandals and former President Barack Obama.
Even some Trump supporters have had enough.
“This sucks,” Fox News columnist David Marcus said earlier this month following an event featuring daredevil dirtbike jumps and Ultimate Fighting Championship (UFC) cage matches on the White House lawn that critics said looked like they were inspired by the classic Mike Judge dystopian satire Idiocracy.
“This pisses me off,” Marcus said after one of the UFC fighters called former First Lady Michelle Obama a man. “You wanna throw out this nonsense at a rally? Fine. Not at an official Freedom 250 event. Disgraceful.”
Some are calling on people to eschew the July 4 event in favor of local celebrations.
“This is like the epitome of personalist rule—turning this into an imperial, dictatorial display of self-glorification,” Sargent said. “It’s important that Americans reject this and not show up to this.”
Gertz concurred, replying, “I think what we have here is a president who does not respect any sort of separation between himself and the country at large.”
“He views the idea of celebrating the nation’s birthday as one and the same with celebrating himself,” he added.
Article by Brett Wilkins republished form Common Dreams under Creative Commons (CC BY-NC-ND 3.0).