Article by Cecilia Keating, Robert McSweeney, Ayesha Tandon, Dr Giuliana Viglione, Daisy Dunne republished from Carbon Brief under a CC license.
Can the event be attributed to climate change?
On the morning of 26 August, flash floods surged through a Himalayan border region of Nepal and the Chinese region of Tibet, killing more than 1,300 people, with thousands still missing.
In the days since the floods, scientists have examined satellite imagery, drone footage and seismic data in order to understand and explain the forces behind the event.
While initial theories pinned the flood on a glacial collapse, scientists now understand the event as a “multi-hazard cascade”, which began with a bedrock collapse.
Some climate sceptics have tried to use this to falsely claim that human-caused climate change had no impact on the event.
Yet, scientists have noted that, while no formal attribution study has been carried out thus far, warming is making such ice-rock avalanches in the region more likely.
Researchers have highlighted how rapid warming is dramatically reshaping Asia’s high-mountain region – and identified rising temperatures, glacier retreat and permafrost thaw as factors that may have all contributed to the disaster.
Balendra Shah, Nepal’s prime minister, has called the floods a “serious signal that…the risks we must bear in the Himalayan region are increasing” due to climate change.
Here, Carbon Brief unpacks what scientists currently know about the causes of the catastrophic event and what they can – and cannot – say about the role of climate change.
- What happened?
- How did bedrock collapse trigger the flash floods?
- How have temperatures risen in the affected region?
- How have rising temperatures affected mountain stability?
- How have glaciers retreated in the affected region?
- Can the event be attributed to climate change?
What happened?
A report published on 28 August by the HiRisk scientific consortium of high mountain experts detailed the events that led to the flash floods.
It said that events were set in motion on 26 August when a mass of bedrock, as well as the glacier ice on top of it, broke off a slope of Langtang-Lirung mountain in the Nepalese Himalaya, plunging from approximately 5,200 metres above sea level to the valley floor at 3,000 metres.
The landslide shook the ground hard enough that, at 8:37am Nepal local time, the US Geological Survey (USGS) initially reported a magnitude 4.4 earthquake. Later that day, it clarified the shaking was caused by glacier collapse and debris flow, equivalent to a magnitude 5.2 earthquake.
On the valley floor, the melting ice, water and debris slammed into the Lhende Khola river, a high-altitude river that runs along Nepal’s border with China.
Known downstream as the Bhote Koshi river in Nepal and the Poiqu or Poqu in China, the Lhende Khole feeds a network of rivers across Nepal and the Chinese region of Tibet, including the Trishuli river. (In China, the Lhende Khola is known as the Donglin Tsangpo.)
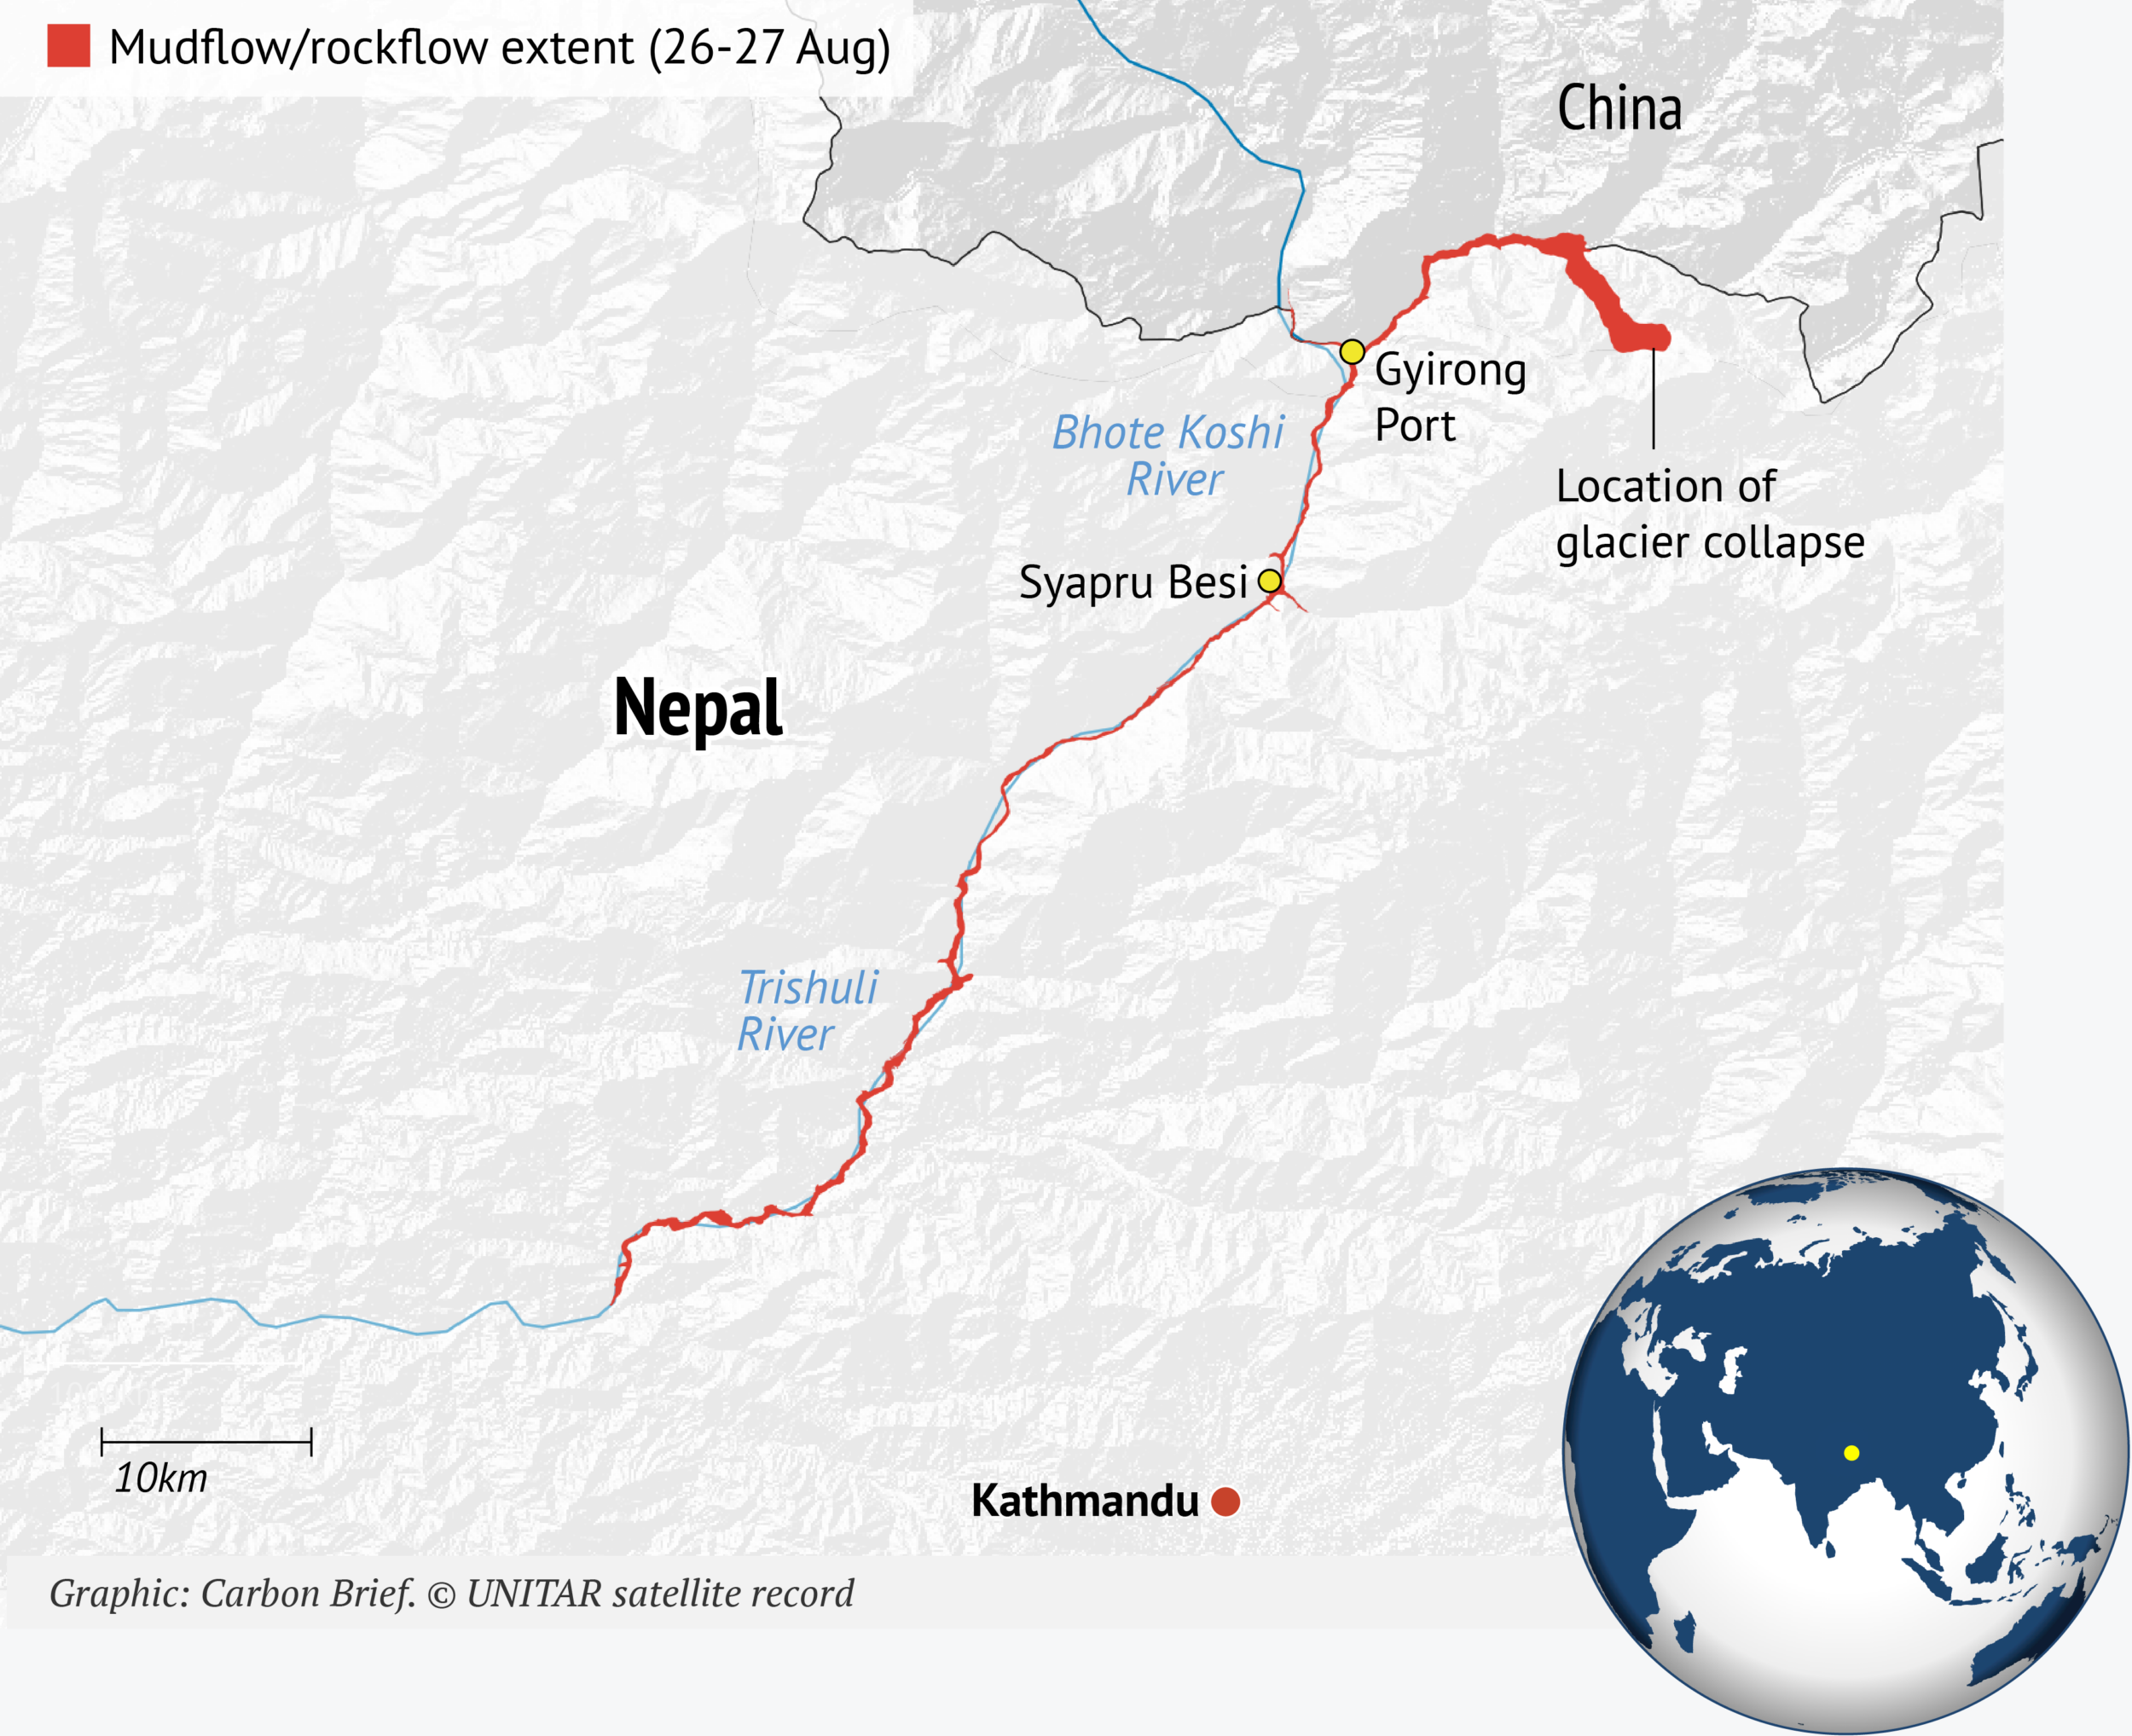
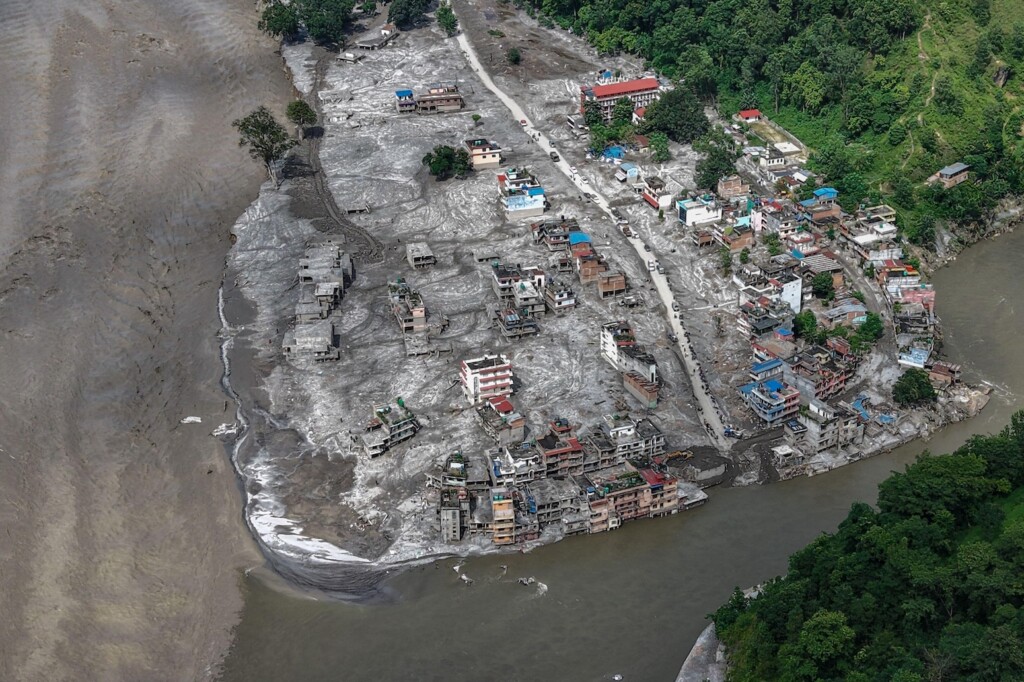
A large “debris” lake was briefly formed on the valley floor. When this lake burst, a wall of water and rock travelled downstream, killing more than a thousand people and destroying settlements, roads, bridges, hydropower plants and border posts across Nepal and Tibet.
HiRisk said that the floodwave travelled down rivers as fast as 30km an hour (around 19 miles per hour) and reached Mugling – a Nepalese town more than 130km downstream – at around 1pm local time.
A separate report from the Center for Land Surface Hazards in the US noted that the flood moved “exceptionally fast, was sediment-laden and extreme in scale”. For example, in the Nepalese municipality of Galchhi, the Trishuli river rose by nine metres in 30 minutes, it said.
Writing in the Conversation, Dr Umesh Haritashya, a glaciologist at the University of Dayton in Ohio, explained that the disaster “wasn’t finished when the first wall of water passed [on 26 August]”.
He continued that a new “barrier lake” – estimated to hold a few million cubic metres of water – had developed in a location where two rivers meet in Tibet before crossing into Nepal. This lake burst on 28 August and the river rose again, he said.
On 4 September, the chief of Nepal’s National Disaster Risk Reduction and Management Authority, told Reuters that property and infrastructure worth “at least” $2.5bn (£1.9bn) had been lost. Dharma Raj Upreti estimated the cost to build roads and temporary shelters, provide drinking water and restore power would be around $53m (£39m).
How did bedrock collapse trigger the flash floods?
In the immediate aftermath of the floods, initial reports suggested that the trigger was a collapsing glacier or earthquake in the high mountains of Nepal.
After confirming that a seismic tremor was as a result of falling rock and ice, the USGS said the trigger was likely a “glacial collapse and debris flow”. This was widely picked up by the media.
Subsequently, satellite imagery revealed that an “enormous chunk of the mountainous bedrock” beneath the glacier had also given way, reported the New York Times.
Dr Kristen Cook, a geomorphologist at the Université Grenoble Alpes in France, told the newspaper:
“The rock that the glacier was sitting on collapsed…It was a much larger collapse than we were initially able to see in the satellite imagery.”
The result was a “deluge of rock and ice, which pulverized into mud and water as it surged down the mountainside”, the newspaper said.
Dr Jakob Steiner a geoscientist at the University of Graz in Austria, tells Carbon Brief:
“It was not a glacier that collapsed. It was the mountain below the glacier that collapsed and the glacier had no other chance but to go with it because it was sitting on top of it.
“The trigger for that is something that we are not 100% certain about, but, in the end, it very much looks like simply a mechanical failure of the rock material because of stressors that have built up over a long period of time.”
Failures of “bedrock” – the hard, solid rock that sits below looser rocks and soil – are an “increasingly common occurrence”, says Prof Bethan Davies, a professor of glaciology at Newcastle University. She tells Carbon Brief:
“These massive landslides occur in mountain regions, commonly following rapid deglacierisation [the melting away of a glacier]. Similar events happened in the Chamoli event in 2021 [in the Indian Himalaya] and in the Blatten landslide last year in Switzerland. They’ve also occurred recently in Alaska.”
With a shift in focus from the failure of a glacier to the bedrock underneath, some climate sceptics seized on the development to falsely claim that climate change had not played any role in the disaster.
These include Dr Matthew Wielicki, recently appointed by the Trump administration to lead the US Global Change Research Program, on Twitter, as well as former Conservative peer and climate-sceptic commentator Matt Ridley in the Spectator.
However, scientists have highlighted the likely contribution of rapid warming in the region. These factors include the thawing of permafrost and glacier retreat. (For more, see sections below).
Fundamentally, “this would have been a much less significant tragedy if it had been just a rock-slope failure”, notes Davies.
The initial landslide took a mixture of rock and ice into a valley that “contains buried ice” as well, she says, providing the water that “resulted in the hyperconcentrated flow, which took so many lives”.
How have temperatures risen in the affected region?
Global temperatures have risen by roughly 1.4C since the pre-industrial period. However, this increase is not uniform across the planet, with some regions warming faster than others.
A study published in Global and Planetary Change in June 2026 investigated changes in the Langtang catchment – a river basin in central Nepal, in which the Langtang-Lirung mountain is located, which eventually drains into the Ganges. Around one-quarter of the area is made up of glaciers.
The paper found that glacial areas of the catchment – found at 4,000 metres above sea level – warmed at 0.31C per decade over 1960-2023. This was “more than three times” the rate observed at a lower elevation weather station, the authors said.
Looking in more detail at the site of the glacial collapse, Dr Robert Rohde, chief scientist for Berkeley Earth, used ERA5 reanalysis data to show how temperature has changed at the 5,200-metre elevation site where the mass of ice and rock broke loose.
Rohde’s analysis found that June-to-August temperatures have been rising at the site of the glacier collapse since the year 1940, with 2026’s summer the fourth warmest on record, behind 2024, 2025 and 2022. This is shown in the graph below.
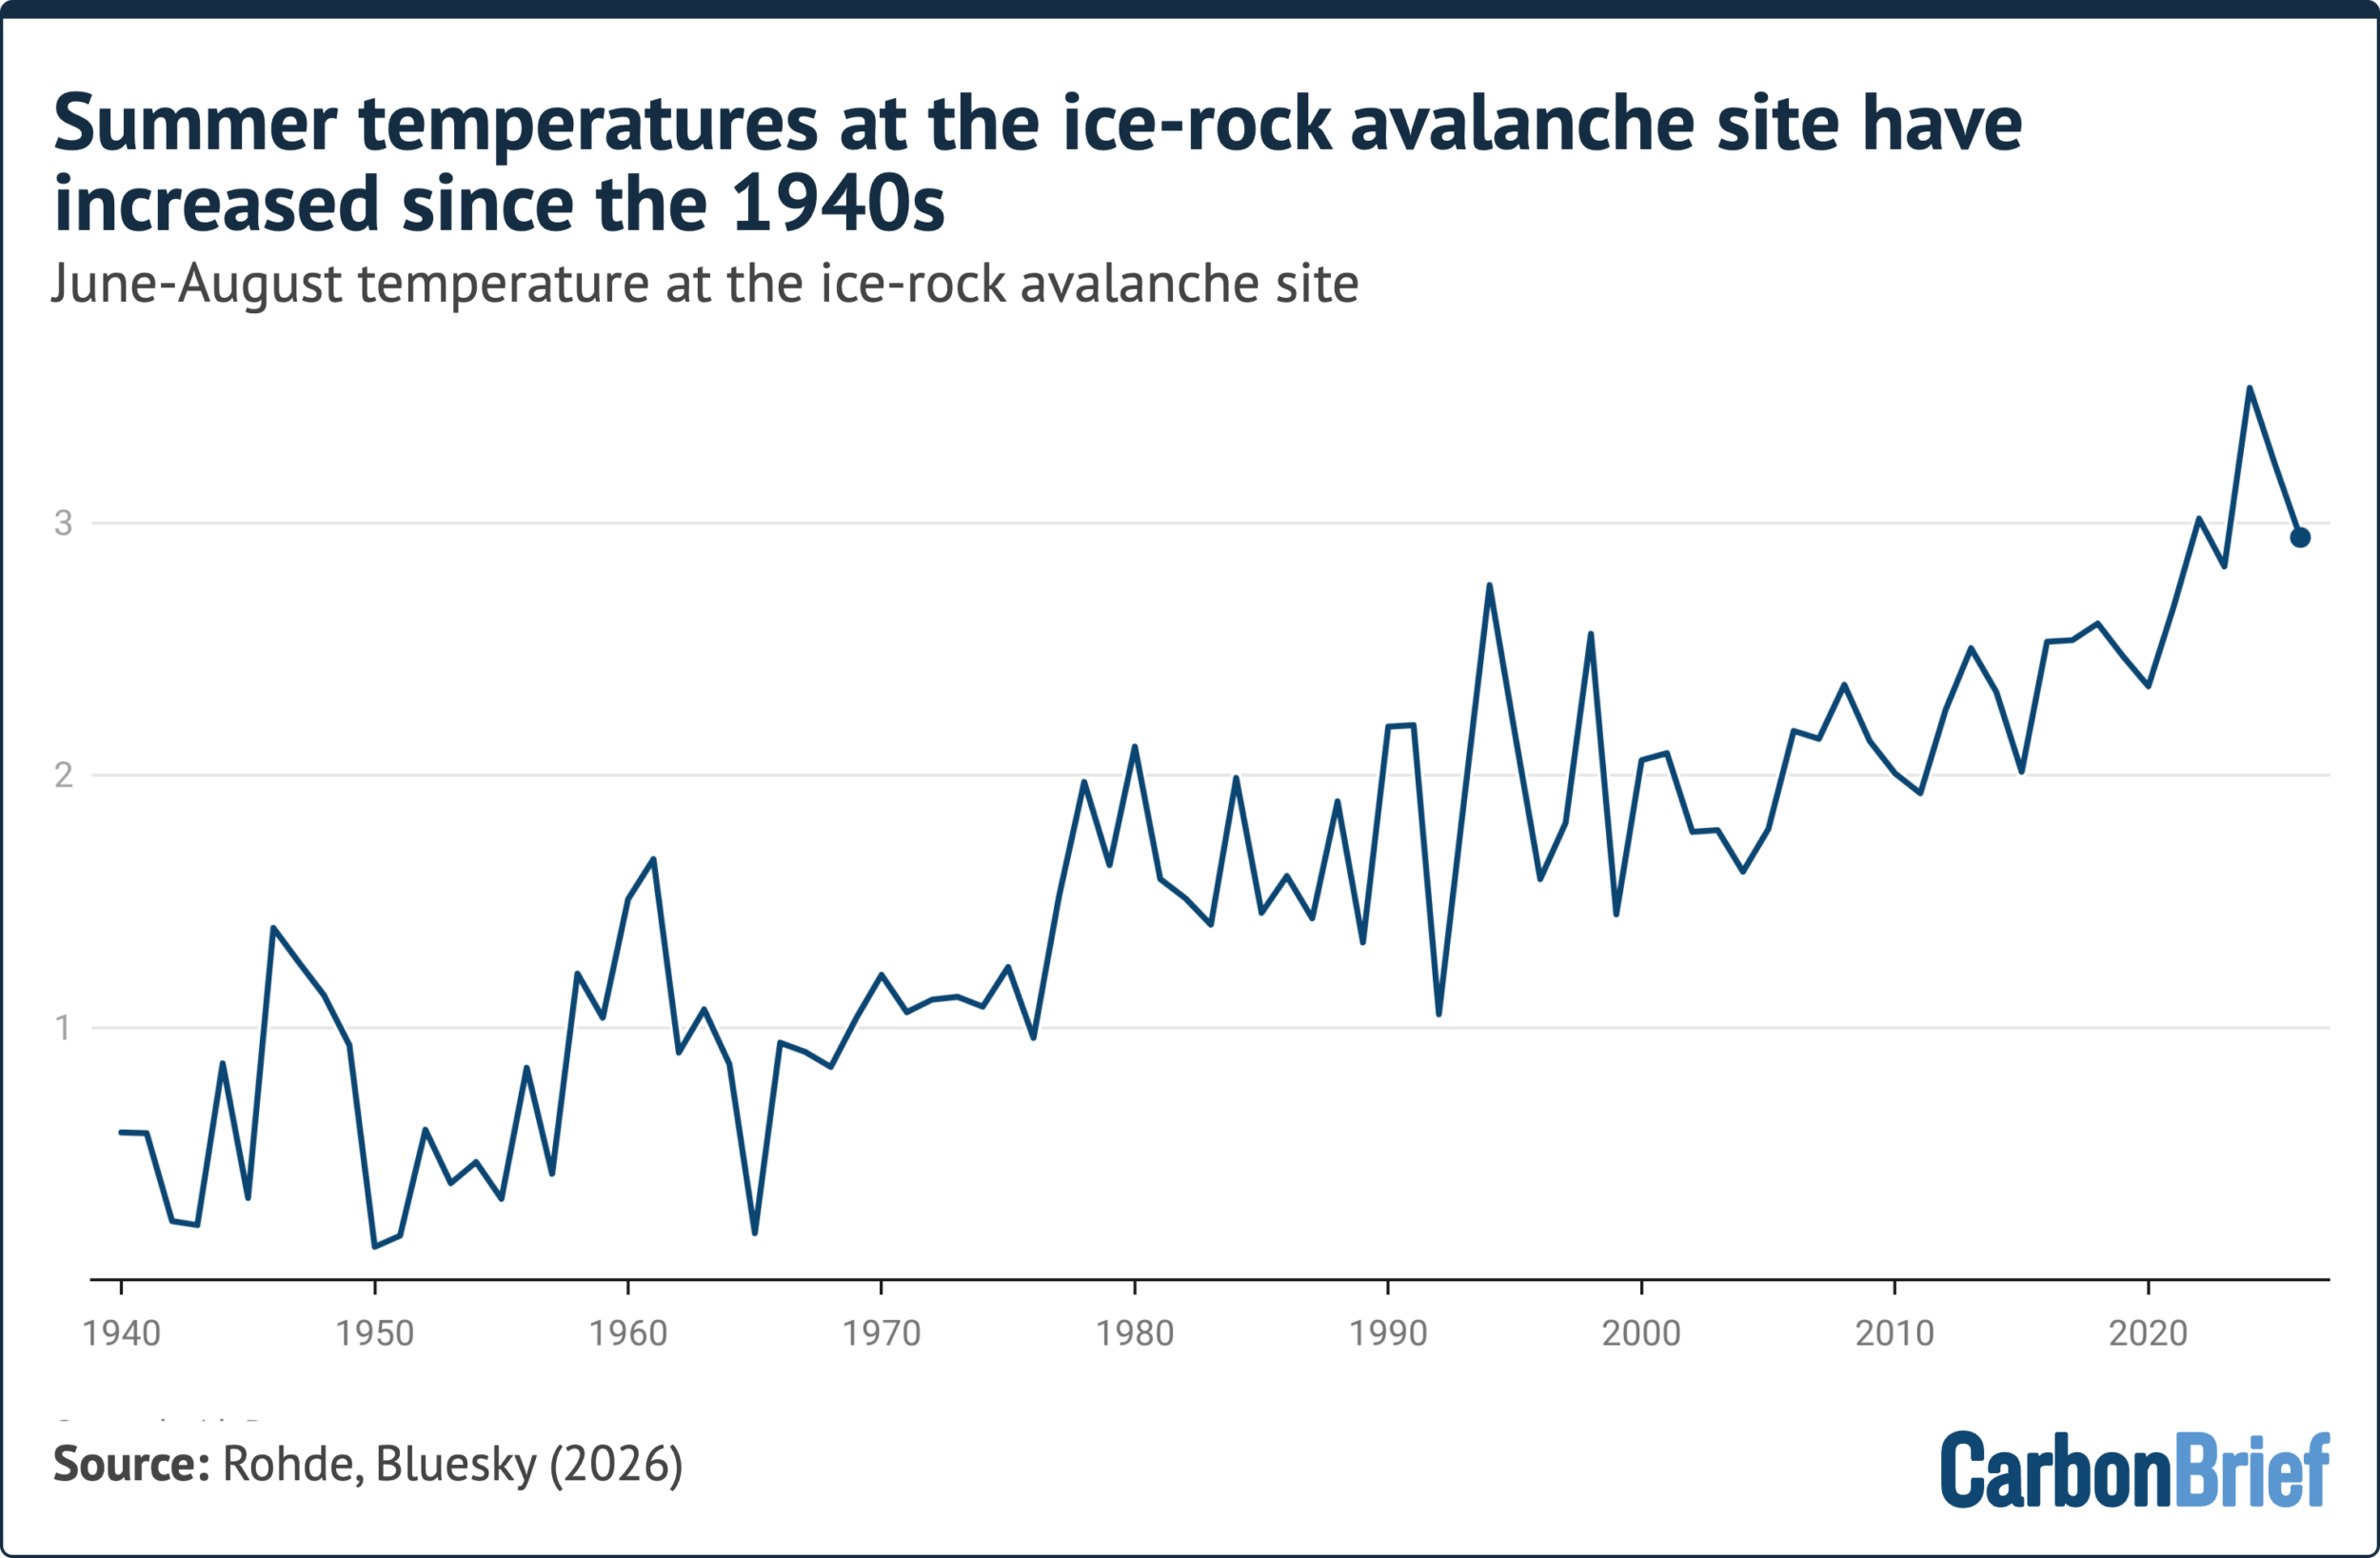
Rohde also found that the days leading up to the disaster recorded the hottest August temperatures ever experienced at the site. This is shown in the graph below.
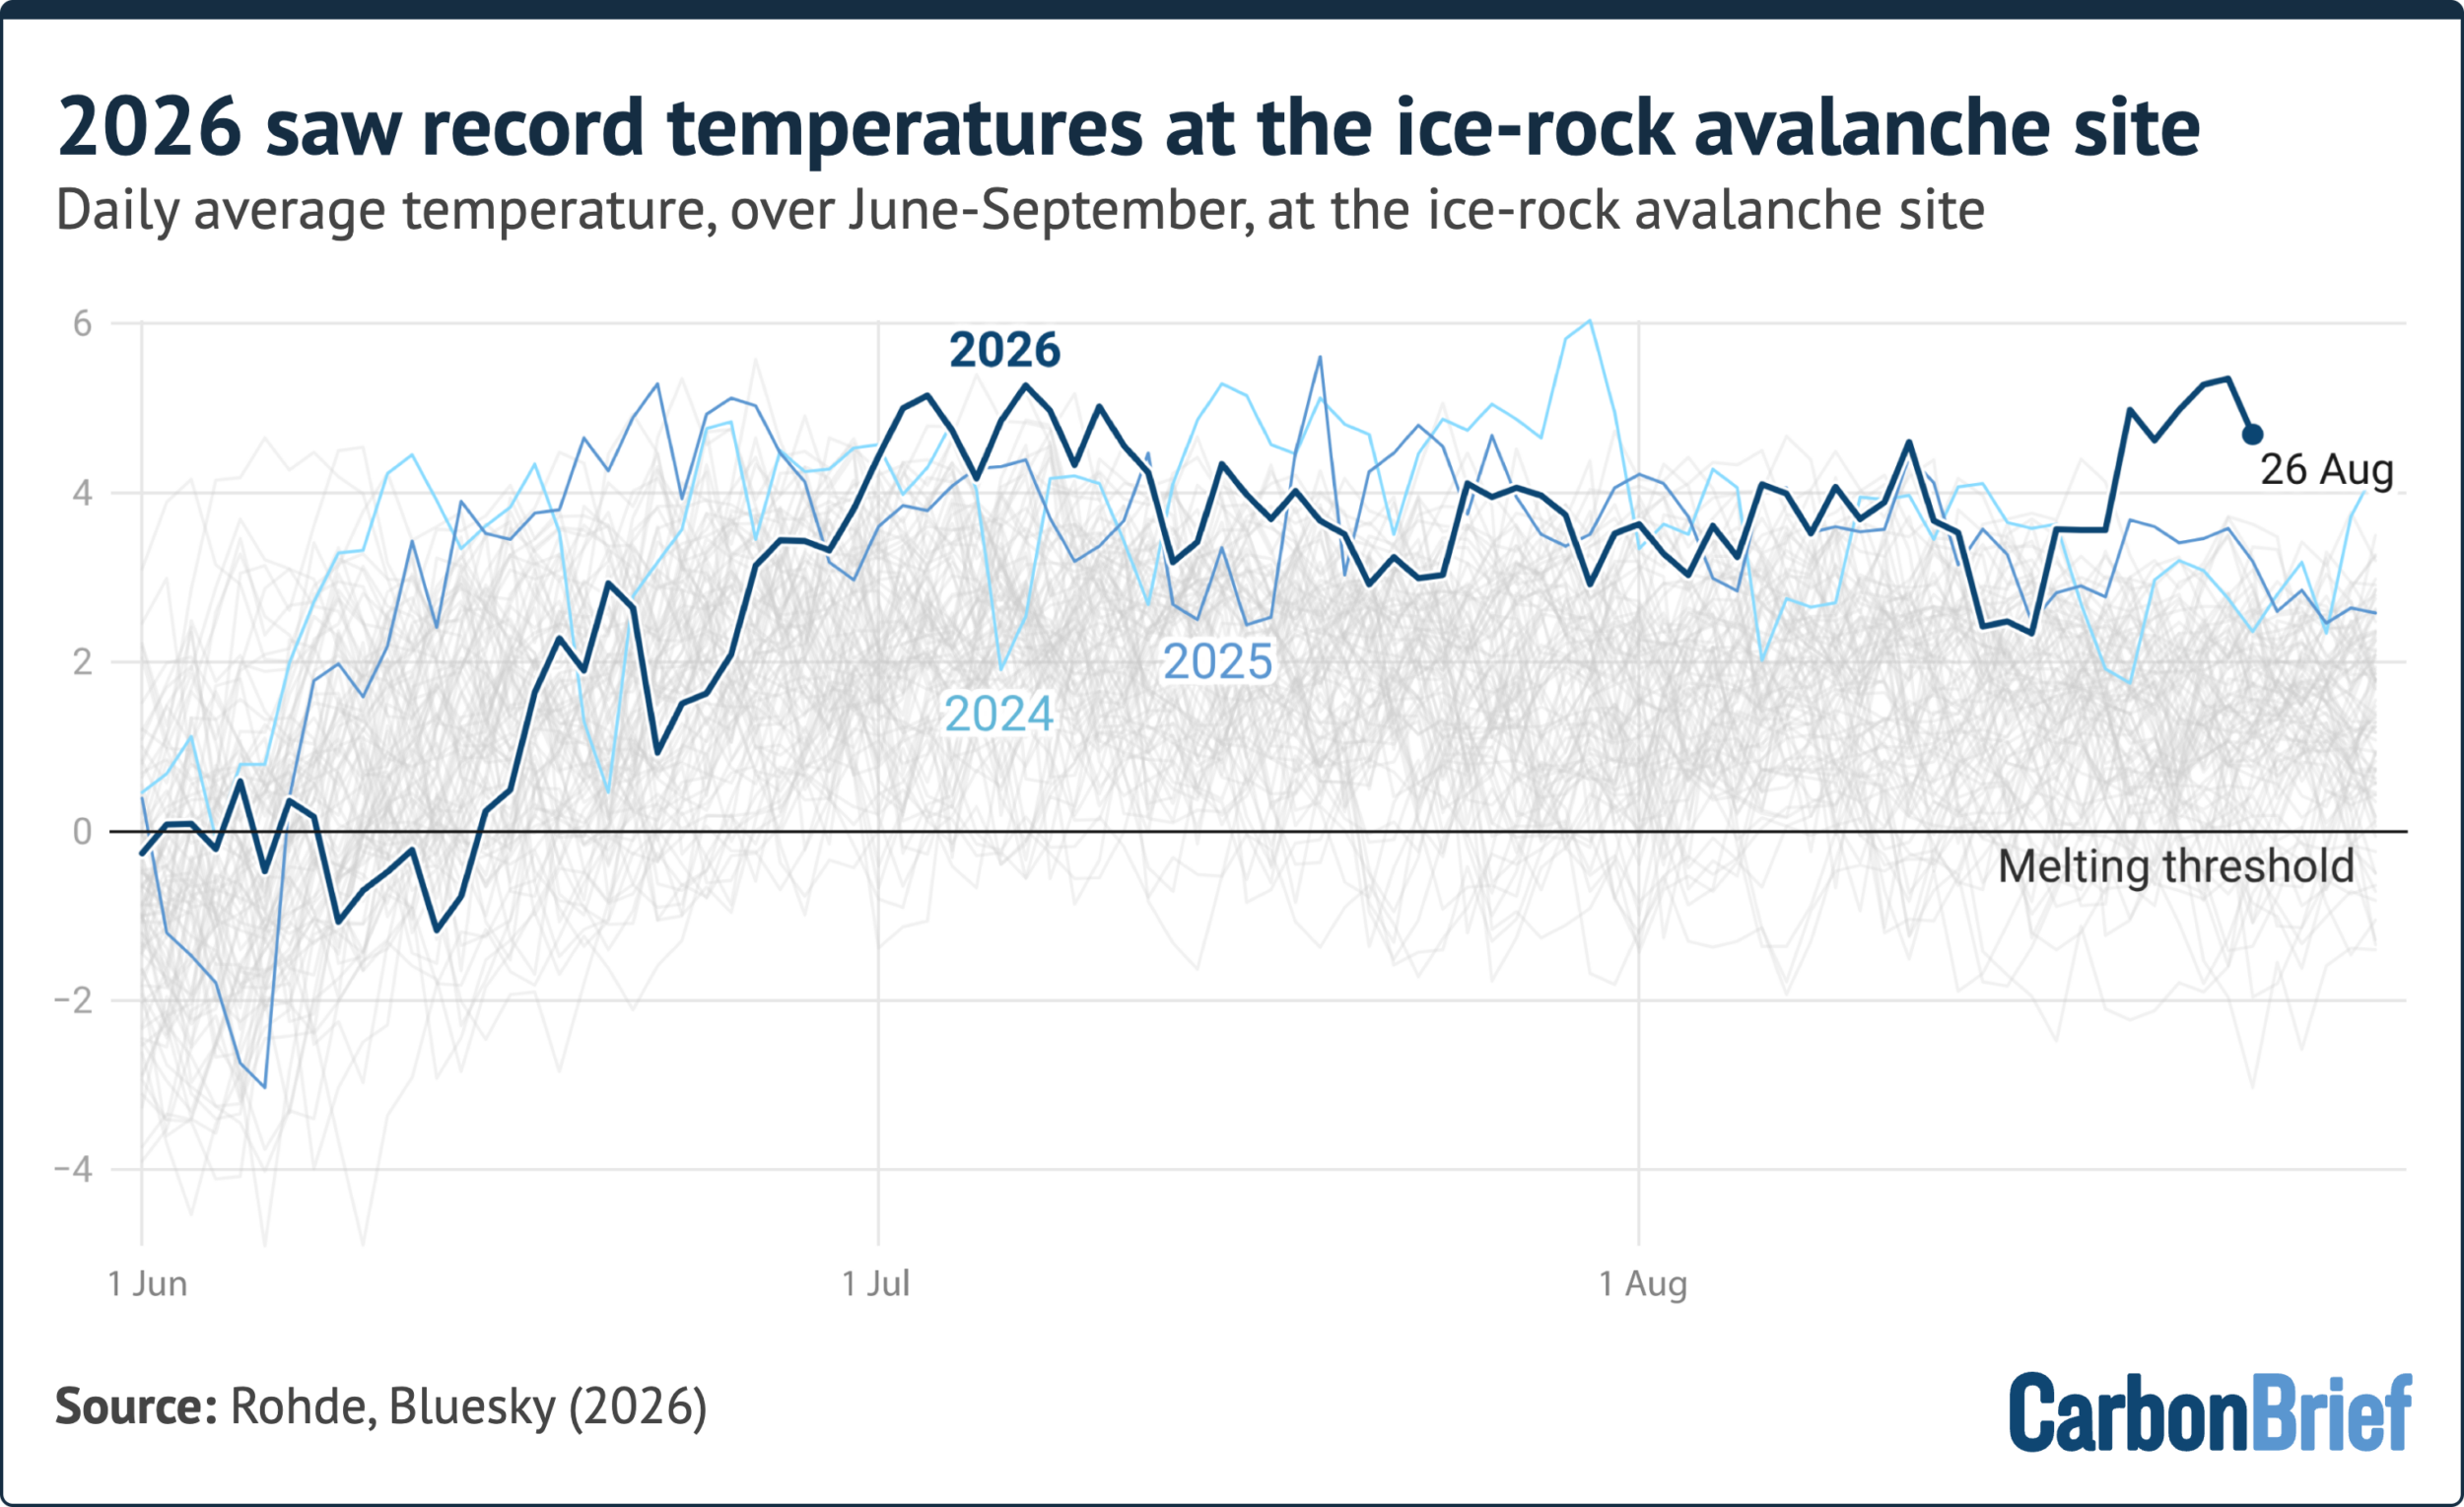
On social media, Rohde stated:
“Given the warming trend, this Nepali glacier had probably been thinning and weakening for years, or even decades. But it ultimately failed during the warmest week in one of its warmest years on record. It would be a hell of a coincidence if global warming wasn’t at least partially to blame.”
How have rising temperatures affected mountain stability?
Many experts have linked warming temperatures in the region to thawing permafrost – ground that has been frozen for at least two consecutive years, whose thickness ranges from less than one metre to more than a kilometre.
Steiner is part of a research team that has been using sensors to monitor permafrost in the region since 2014. He tells Carbon Brief that it is “pretty clear” the permafrost has been thawing “very actively” at elevations as high as 5,200 metres above sea level “for many years”. He adds:
“This means that the ground has, over the last decades, moved from being in a solid state into – at least, periodically during the warm season – patchy ground where some is frozen and some isn’t…
“If you have frozen ground next to non-frozen ground, you have dynamics happening between that because there are different densities and there’s movement happening, which is conducive to interventional failure – and that we know from many other cases.”
Davies also points to the “degradation” of perennially frozen ground as a factor in the disaster:
“This permafrost acts as a glue to hold together the rocks and, as it melts, the rock can become weakened.”
Permafrost thaw can also result in saturated ground, says Davies, which adds “pressure in the joints” of rock and can “facilitate” failure. She continues:
“Sources of the water include melting permafrost and meltwater from the overlying glacier. We know that this event happened during a period of warmth, but in the absence of heavy precipitation, pointing to ice melt as the source of water.”
A 2025 study of rock and ice avalanches in High Mountain Asia found that more than two-thirds started in areas “where permafrost is probable”.
How have glaciers retreated in the affected region?
Glaciers – frozen rivers of ice holding three-quarters of the global freshwater supply – are extremely vulnerable to climate change.
In the Himalaya, the rate of glacier retreat has doubled since the late 20th century, according to a 2019 study in Science Advances.
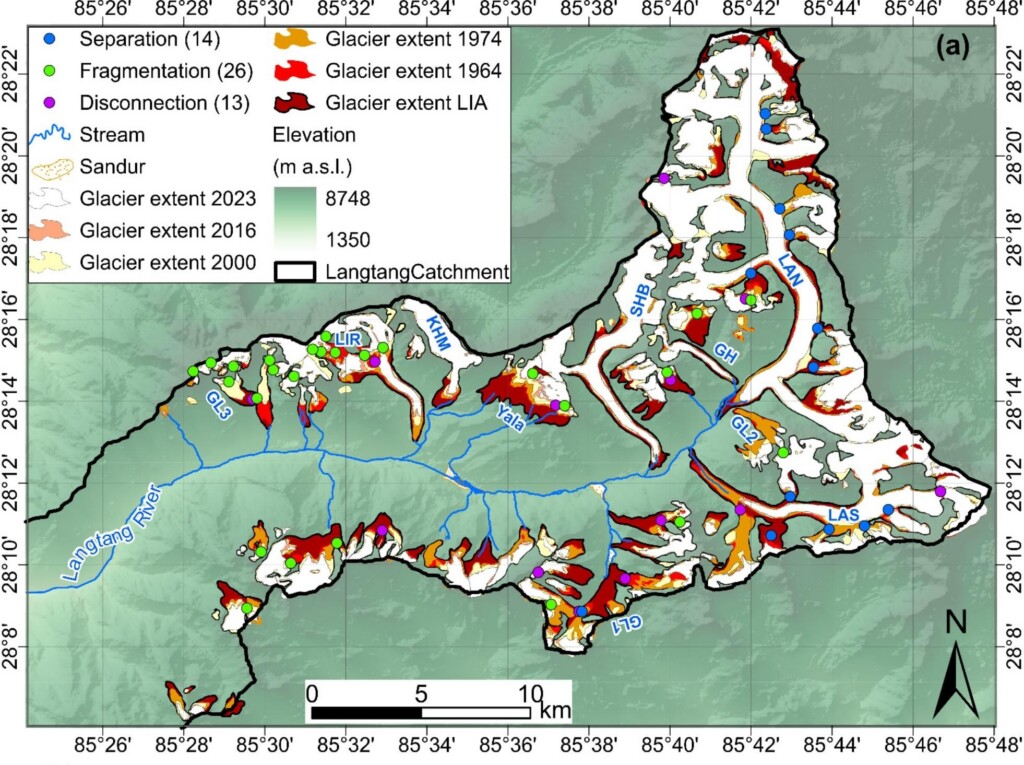
The Global and Planetary Change study found that glacier area loss rates in the Langtang catchment increased more than fourfold from 1964 to 2023 – with melting accelerating after 2000.
It added that glaciers in the region also experienced “fragmentation” and “widespread thinning” over this period.
The study noted that this loss “coincided with elevation dependent warming”.
The figure below provides an overview of glacier loss in the Langtang catchment over 1964-2023, with orange, red and dark red indicating areas of retreat.
In addition, green dots note points of glacier fragmentation, while blue dots show separation and pink show disconnection.
In comments released by the University of Reading, Prof Maria Shahgedanova, a climate scientist researching climate impacts on mountain glaciers, said that the glacier involved in the floods had “retreated by approximately 450 metres between 1990 and 2020”.
She adds that this “potentially reduce[d] the mechanical support provided by the glacier to the underlying rock slope”.
Speaking to Carbon Brief, Davies reiterates that the retreat of the glacier is “potentially a contributing factor” to the bedrock collapse and subsequent disaster.
This is because the removal of the glacier from the lower slopes leaves the “upper rock slopes less stable”, she says.
The most recent assessment by the International Centre for Integrated Mountain Development said that glaciers in the Hindu Kush Himalaya region are “rapidly shrinking” as a result of climate change. (This region extends 3,500km over Afghanistan, Bangladesh, Bhutan, China, India, Myanmar, Nepal and Pakistan.)
It said this loss is threatening the safety of the nearly two billion people, including by increasing the risk of “glacial lake outburst floods” (GLOFs). A GLOF is a sudden and catastrophic release of meltwater from a glacial lake.
Although this disaster was not caused by a GLOF, it is known that climate change is making such events more likely.
Can the event be attributed to climate change?
In the wake of the flash floods, climate campaigners, media outlets and Nepalese politicians have linked them to human-caused climate change.
However, many climate scientists have cautioned that it is too early to say precisely how climate change impacted the disaster.
Davies tells Carbon Brief:
“These events happen so quickly that the exact causes and drivers can take a little time to uncover, especially if the event was a surprise and there had been no monitoring system in place.”
When trying to determine the role human-caused climate change played in the intensity or likelihood of extreme weather, scientists turn to the field of “attribution science”.
To date, no formal rapid attribution study has been produced that attempts to quantify whether – and how – climate change contributed to the event.
Scientists have noted that climate attribution of ice-rock avalanches – which are typically driven by a variety of factors – remains limited, in part because of the lack of a long-term observational record of previous collapses in high mountain areas.
Meanwhile, the studies that do exist stop short of directly linking such disasters to climate change. For example, the authors of a 2021 study into the Chamoli ice-rock avalanche concluded that “we cannot attribute this individual disaster specifically to climate change”.
However, they added, the “possibly increasing frequency of high-mountain slope instabilities can likely be related to observed atmospheric warming and corresponding long-term changes in cryospheric conditions (glaciers and permafrost)”.
In the aftermath of the disaster, many researchers have similarly highlighted that climate change could not be singled out as the cause of the disaster, even if warming likely increased the probability of its occurrence.
On the Climate Brink substack, Carbon Brief’s climate science contributor Dr Zeke Hausfather noted that a “definitive single-event attribution” of the more recent disaster “may never be possible” due to the “messy causality of rock-ice avalanches”.
However, he added that both the existing scientific literature and “essentially every scientist working on these hazards point in the same direction” – namely, that warming is making such events more likely in the Himalaya.
Steiner tells Carbon Brief it might be possible to attribute different factors that played a role in the disasters to climate change – for instance, the recession of the glacier – but it would be more difficult to do so for the event as a whole.
Part of the reason for this, he says, is that rock failures in this region of the Himalaya have occurred for millennia, well before humans started altering the climate.
However, he continues:
“The physics of it is not something that has been made possible by climate change. This could have happened without it. But the chance of it happening – and the likelihood of it happening five years after a previous, similar event [in Chamoli] – we, as the scientific community, can be pretty confident about that [being increased because of a changing climate].
“This is because so many of the changes that we know are related to climate change can potentially drive the build-up to eventual failure.”
Ultimately, says Davies, a “careful attribution study is needed, but it is hard to argue that the rapidly warming climate is not having an effect in these regions”. She adds:
“A single event may have multiple drivers, but we are seeing an increase in these events and are likely to see more as the permafrost and glacier melt continues.”
Article by Cecilia Keating, Robert McSweeney, Ayesha Tandon, Dr Giuliana Viglione, Daisy Dunne republished from Carbon Brief under a CC license.