A French firefighter responds to a flare-up to prevent the fire from reigniting in the Fontainebleau Forest, in Noisy-sur-Ecole, France. Photograph: Simon Wohlfahrt/AFP/Getty Images
Figures come as large parts of southern Europe endure another record-breaking period of extreme temperatures
France recorded more than 5,700 excess deaths during its June heatwave, authorities have said, as swathes of southern Europe continue to endure another record-breaking period of extreme temperatures.
The French national health agency said on Wednesday that it had recorded 5,764 excess deaths between 17 June and 2 July, an excess mortality rate of 36%.
More than half of the “unprecedented” total were recorded between 25 and 27 June, with deaths of people aged 75 and older accounting for about two-thirds of the excess mortality, the agency said.
…
The announcement came as firefighters in Spain battled one of the country’s largest ever wildfires, which has burned about 32,000 hectares (79,000 acres) in the Guadalajara region north of Madrid, forcing the evacuation of 1,200 people from 34 villages in the sparsely populated area and confinement orders in 14 others.
Authorities said on Wednesday that the fire was beginning to stabilise, and residents of five villages were allowed to return home. The prime minister, Pedro Sánchez, said on a visit to the area that Spain had already suffered 22 major wildfires so far this year, four times more than in the same period last year.
Neo-Fascist Climate Science Denier Donald Trump says Burn, Baby, Burn.Nigel Farage urges you to ignore facts and reality and be a climate science denier like him and his Deputy Richard Tice. He says that Reform UK has received £Millions and £Millions from the fossil fuel industry to promote climate denial and destroy the planet.Donald Trump urges you to be a Climate Science denier like him. He says that he makes millions and millions for destroying the planet, Burn, Baby, Burn and Flood, Baby, Flood.
In Greater London, the number of days over 30C and nights over 18C more than quadrupled in the last decade, compared with 1961-1990. Photograph: Anadolu/Getty Image
Annual State of the UK Climate analysis finds last four years in UK are in top five hottest on record
The UK’s climatic extremes are becoming increasingly normal, a report has found, with last year the hottest on record and further “unprecedented changes” likely to break the record again soon.
Data stretching back to 1884 shows the UK has never experienced a year as hot as 2025, according to the annual State of the UK Climate report, with temperatures pushed to dizzying heights by carbon pollution clogging the atmosphere.
Average temperatures have increased across most of the UK
The country experienced its warmest spring and summer on record last year, while England was hit by its driest spring in a century.
The report comes as the UK faces the third deadly heatwave to have scorched Europe over the last two months. On Tuesday, the Met Office said the UK had already recorded as many 30C (86F) days in 2026 as in the extraordinarily hot year of 1976.
“What we used to think of as extreme, we increasingly consider as normal,” said Mike Kendon, a scientist at the National Climate Information Centre and lead author of the report. “We are seeing unprecedented changes continuing … and every year adds to this body of evidence.”
Donald Trump urges you to be a Climate Science denier like him. He says that he makes millions and millions for destroying the planet, Burn, Baby, Burn and Flood, Baby, Flood.Nigel Farage urges you to ignore facts and reality and be a climate science denier like him and his Deputy Richard Tice. He says that Reform UK has received £Millions and £Millions from the fossil fuel industry to promote climate denial and destroy the planet.Orcas discuss Donald Trump and the killer apes’ concept of democracy. Front Orca warns that Trump is crashing his country’s economy and that everything he does he does for the fantastically wealthy.
A farming storage area is flooded in Taiwan — events such as this will become more frequent in an increasingly erratic climate. Credit: Cheng Chia Huang/Getty
Increasing instability of the ocean, ice and atmosphere threatens farming, finance and society. We all need to wake up to that fact.
How we get there — how the tipping unfolds — is more important, and there is an urgent need to understand the process. This is missing from current analyses because the scales in time and space it occurs on fall between those of climate and weather. Tipping analyses focus on huge climate changes, often globally, over decades. Weather events are fast and local. But look at the interplay between the two and it’s clear that the transition between one climate state and another is not smooth but extremely volatile.
Climate tipping, therefore, will manifest as a period of increasingly dramatic weather volatility, rather than a sharp shift in average conditions. A fluctuating climate will bring swings and crashes in crop yields, flash flooding and erratic storms. It will stress economies by disrupting supply chains and amplifying insurance losses. Societies are unprepared, because weather volatility related to tipping points is absent from risk assessments.
This problem is urgent. Earth subsystems, including oceans, the cryosphere and biosphere, already seem to be destabilizing. The planet is heading for climate free fall.
Climate is destabilizing
By definition3, tipping points are reached when a series of interlinked changes amplify one another until the whole system becomes unstable and shifts uncontrollably into a different state. Loss of sea ice at the poles, for example, reduces the amount of sunlight reflected into space, further heating Earth’s surface, which then accelerates ice loss. These vicious cycles of change define a tipping point, at which the climate cannot return to its former patterns.Are we all doomed? How to cope with the daunting uncertainties of climate change
Before that point, the climate system becomes increasingly unstable. It fluctuates considerably — a rise in variability is a well-established property of such ‘non-linear dynamical systems’ approaching a critical threshold4,5. That society will face these fluctuations and that they will intensify through the tipping transition hasn’t been realized by scientists and policymakers, so far.
Earth will experience an increasingly erratic climate: more and stronger fluctuations in flows of melt water, ocean circulations and the extent of sea ice. These changes will lead to more frequent and intense extremes in temperature, precipitation and storms — leading not only to more heatwaves and droughts, but also to more cold spells and floods.
The scale of the consequences might not be obvious at first — ice sheets and ocean currents are so large that their responses to warming are relatively slow and delayed. Once a critical temperature threshold for instability is crossed, it takes time for such systems to collapse, but the collapse is inevitable (see ‘Tipping into trouble’).
Source: A. Levermann
Ice sheets in West Antarctica6 and Greenland7 have already passed their tipping temperature. Arctic sea ice will do so in a few years. For the Atlantic Ocean, scientists simply don’t know8. The period between passing the tipping temperature and reaching the tipping point is when fluctuations increase dramatically.
Research into early warning of tipping points has identified increased climate variability as a signal of reduced stability and used it to estimate the time remaining before widespread tipping begins. But variability caused by instability as a mechanism of climate impact has been widely neglected.
Modern economies are adapted to relatively stable climatic baselines. Agricultural productivity, infrastructure design, insurance pricing and financial risk management all rely not only on expected mean conditions but also on the predictability of variability.
Power-mad orange gasbag Donald Trump says Burn, Baby, Burn.Nigel Farage urges you to ignore facts and reality and be a climate science denier like him and his Deputy Richard Tice. He says that Reform UK has received £Millions and £Millions from the fossil fuel industry to promote climate denial and destroy the planet.Elon Musk urges you to be a Fascist like him, says that you can ignore facts and reality then.
Several different factors likely explain this trend, including reductions in planet-cooling aerosols as nations have cleaned up their air pollution, as well as changes in atmospheric circulation patterns, which models struggle to represent.
In June 2026, daily high temperatures averaged across France reached 36.9C, shattering the previous June record set in 2022 by 2.4C.
[For more on the impacts and coverage of Europe’s June heatwave, see Carbon Brief’s explainer.]
The rise in observed temperatures in France has outpaced projections made by climate models, with June maximum temperatures more in line with what was expected for the 2070s.
This is illustrated in the figure below, which shows how France’s average maximum daily high temperature for June recorded in 2026 (black line) compares to climate model projections (blue and orange lines).
Comparison of observed (ERA5, black) and modelled (blue and orange) temperatures across France from 2000 to 2080. Plot shows the maximum daily high temperature recorded in June for each year, after averaging temperatures across France. The model ensembles are bias-corrected CMIP6 model ensembles from the NEX-GDDP (blue) and CIL-GDPCIR (orange) projects. The dashed blue and orange lines are the ensemble averages. Credit: Prof Andrew Dessler.
Counting the death toll of climate change
The downstream impacts of these extreme temperatures are lethal.
Scientists are able to estimate the death toll of high temperatures in many locations, depending on the availability of mortality and climate data.
One option is to examine death certificates to see which deaths have been directly recorded by physicians as related to heat. However, there is strong evidence that this method significantly undercounts heat-related deaths, as most death certificates do not consider environmental factors such as heat when diagnosing the cause of death.
Alternatively, it is possible to calculate the rate of total (“all-cause”) mortality in a given time period relative to previous time periods – for example, by comparing the total number of deaths in June 2026 compared to the average of previous Junes. This “excess deaths” figure can be used as an estimate of the deaths from a heat wave.
Using this approach, Public Health France attributed around 2,000 deaths in France to the extreme heat in the week of 22-28 June.
Finally, scientists can use long-term data on overall mortality and correlate changes in mortality with changes in temperature to understand the statistical relationship between the two.
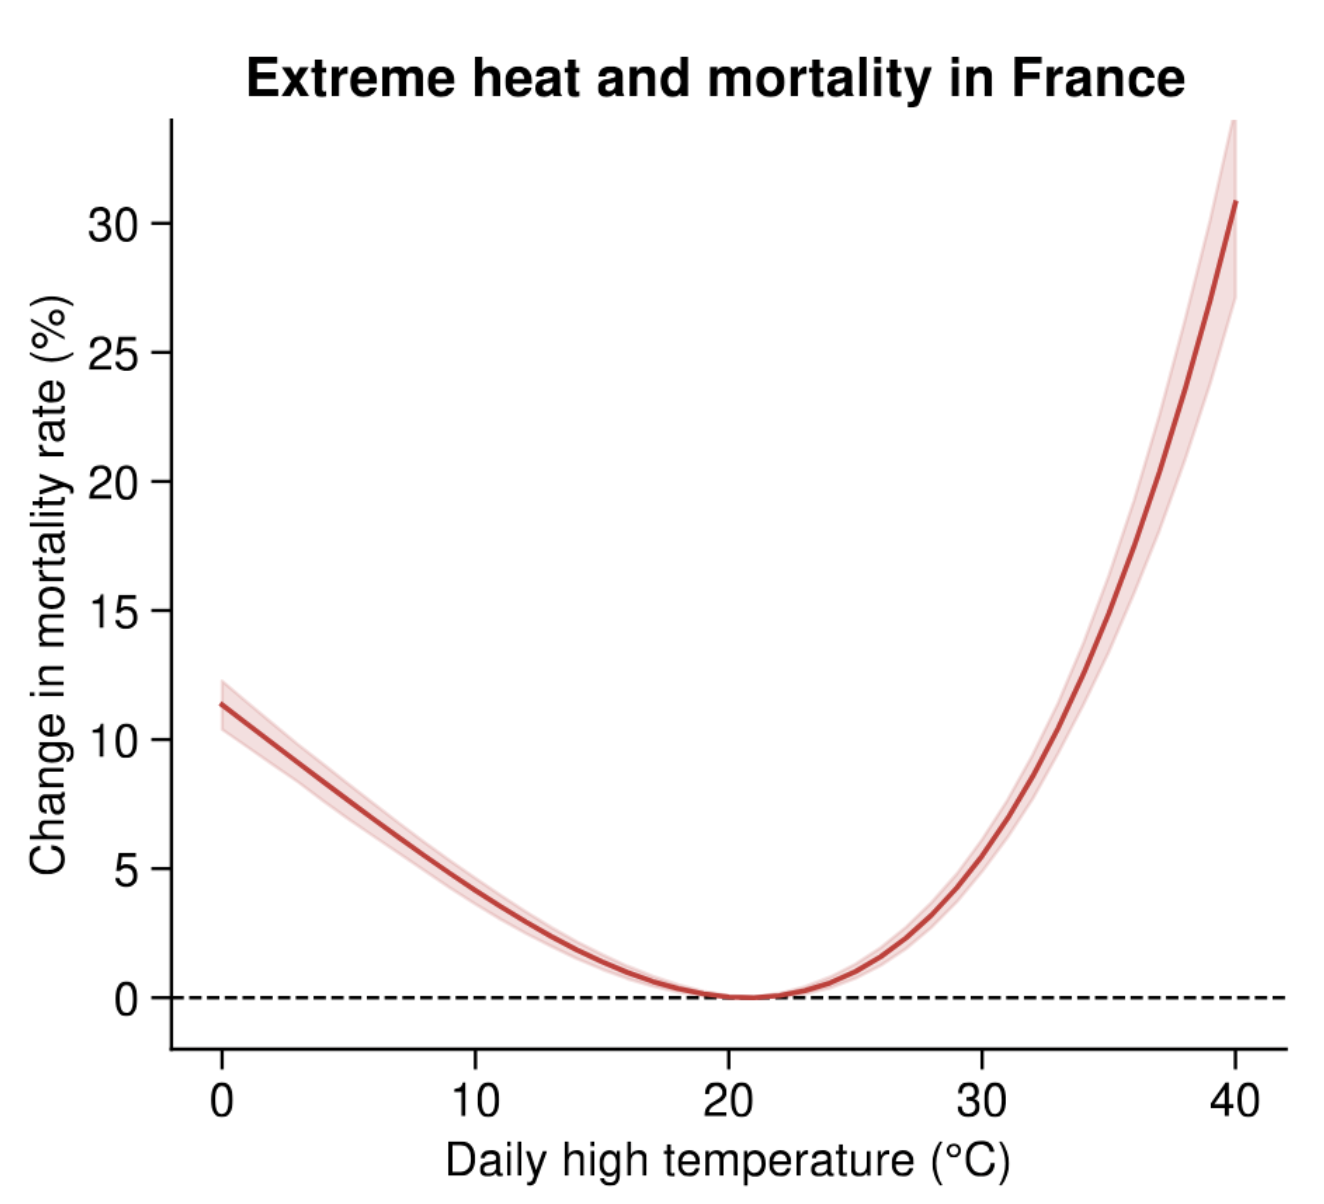
Research published in Proceedings of the National Academy of Sciences in 2025 that used this third approach found that mortality rates in France increase rapidly in cold or hot conditions as daily maximum temperatures depart further from approximately 20C.
This pattern of a U-shaped response of mortality to temperature – shown in the figure below – is veryconsistent across time periods and regions around the world.
Relationship between daily high temperature and all-cause mortality rates in France, estimated using data over 2004-19. Credit: Dr Christopher Callahan, based on data and methods in Callahan et al. (2025)
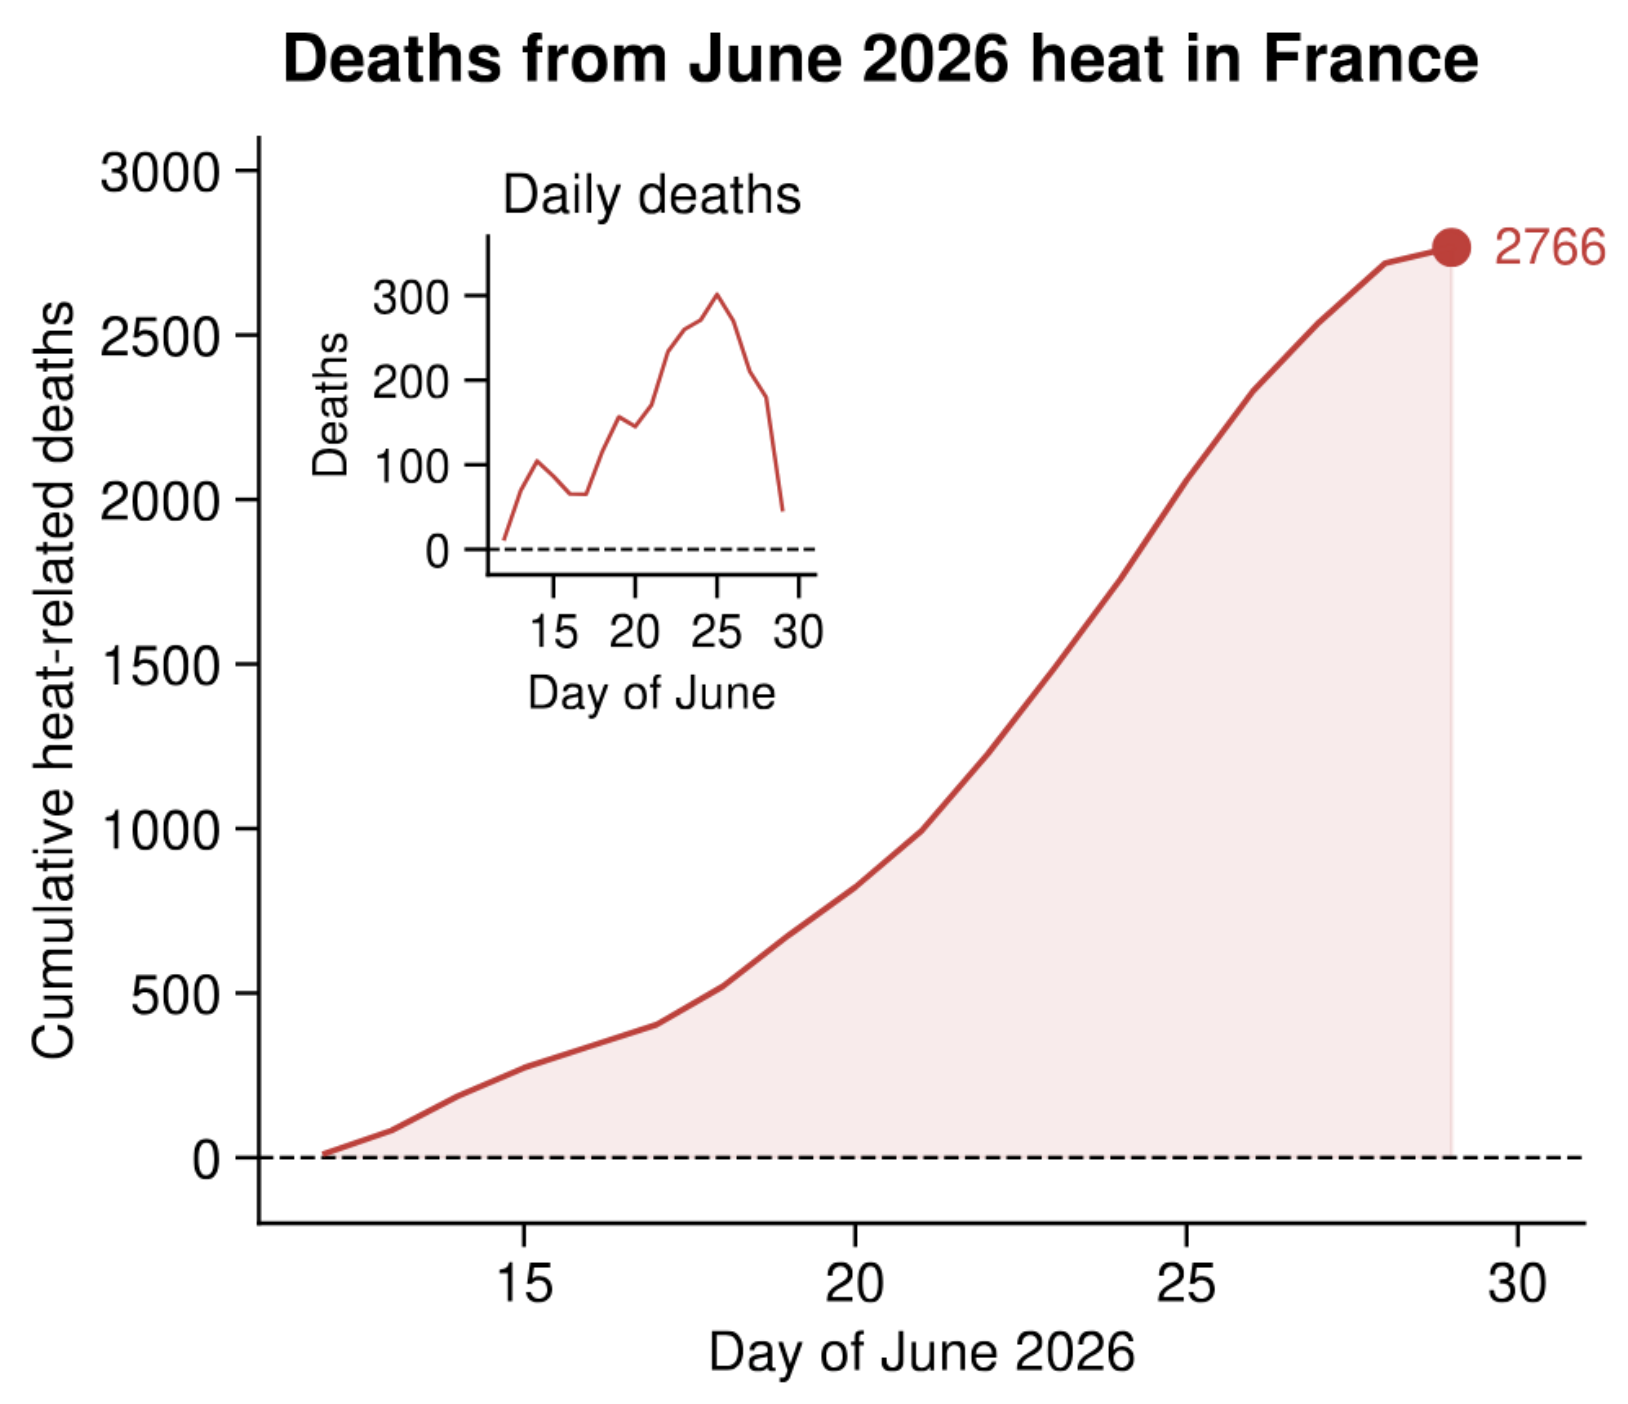
To calculate the death toll of the June 2026 heatwave in France, we compared observed temperatures over 12-29 June to their baseline average over 1980-2025.
The difference between these two temperatures helps us understand how many more people died than they would have in the absence of such extreme conditions.
Over 12-29 June, we found that France has experienced around 2,700 heat-related deaths above the average baseline. Day-to-day heat-related mortality rates rose from less than 100 to almost 300 on the hottest days of 24 and 25 June.
This is shown in the graph below, which illustrates the cumulative total heat-related deaths seen in France over the two-and-a-half week period. The inset shows how heat-related deaths fluctuated on a day-to-day basis during this time.
Estimated heat-related mortality over 12-29 June, based on a U-shaped response of mortality to temperature. The main plot shows cumulative total deaths and the inset shows daily deaths. Credit: Dr Christopher Callahan, based on data and methods in Callahan et al. (2025)
Recent analysis by World Weather Attribution has already shown that human-caused climate change increased the frequency and intensity of the June heat wave across Europe.
Meanwhile, previousresearch has shown there is substantial evidence that heat-related mortality in Europe has already been elevated by greenhouse gas emissions.
As a result, we can be confident that at least some of the more than 2,700 deaths already seen in France are directly due to the burning of fossil fuels.
Calculating climate risk
In April, the UN-led body responsible for coordinating the work of climate modelling centres – the Coupled Modelling Intercomparison Project (CMIP) – unveiled a set of seven new emissions scenarios.
These are designed to replace the previous scenarios that have been used by scientists to understand how the climate might change in the future. They will feed into the upcoming seventh assessment report (AR7) of the Intergovernmental Panel on Climate Change (IPCC).
The range of future emissions in the new CMIP scenarios is smaller, with scenarios of very high or very low emissions no longer on the table.
The retirement of the very-high emissions scenario – known as “RCP8.5” – led to certain commentators in the media and in politics, including US president Donald Trump, arguing that the risks of climate change had been “overstated”.
[For more on false and misleading claims around the new emissions scenarios, see Carbon Brief’s factcheck.]
Our analysis of June’s heat-related deaths in France suggests that, even if the most severe emissions pathways are no longer needed, climate impacts are taking a heavy toll on society.
Moreover, the temperatures seen in France show that climate models continue to underpredict the magnitude of heatwaves for a particular level of global warming.
This is because greenhouse gas emissions are only a first step in estimating the impacts of climate change.
The second step is converting emissions to changes in the climate at both the global and local levels – or hazards. This includes heatwaves, flash floods and droughts.
The third step is to determine how changes in the hazards will affect local populations. This can be determined by calculating people’s exposure and vulnerability to hazards.
Substantial uncertainty persists at every stage of this sequence.
For example, scientists do not know exactly how the global climate will react to ever-rising greenhouse gas emissions – nor the extent to which global temperature increases will drive local climate hazards. We also do not know how climate change at a local level impacts human health outcomes.
Adaptation options, such as air conditioning, heat action plans and social support for isolated people, will be crucial as the climate moves away from the typical conditions that people are used to.
Neo-Fascist Climate Science Denier Donald Trump says Burn, Baby, Burn.Nigel Farage urges you to ignore facts and reality and be a climate science denier like him. He says that Reform UK has received millions and millions from the fossil fuel industry to promote climate denial and destroy the planet.Donald Trump urges you to be a Climate Science denier like him. He says that he makes millions and millions for destroying the planet, Burn, Baby, Burn and Flood, Baby, Flood.
Francisco Goya — Saturn Devouring His Son (1819–1823)
Every day the political class announces another initiative, pledge, roadmap or “ambitious target.” And every day, the material reality moves closer to total collapse. At some point, we must confront a simple truth: the elites are not failing accidentally — they are participating in a death project. They are driving a system that destroys itself, destroys life, and destroys the conditions for civilisation, even when warned by their own institutions and scientists.
This is not just incompetence. It is not even simple greed. What we are witnessing is something deeper and more pathological — a mixture of elite degeneration, the death wish, and a civilisation unable to confront its own end. This piece gathers my recent reflections on why elites refuse to act, why capitalism is running toward its own destruction, and why the outcome is now structurally revolutionary.
Do we want a place in this miracle?
We live in a universe – do we want a place in this infinite miracle? Do we want to stand for life? Do we want to live rather than die?
Because at this point — to repeat a million times — we have become revolutionaries. Not in the neoliberal performative identity-bollocks way. But actually, literally revolutionary.
Even Colombian President, Petro Gustavo, put it plainly:
“I know that decarbonisation requires a transformation on a global scale, a revolution. But it must be undertaken if humanity is to live on for millennia, or even millions of years, in the universe.”
Reality is no longer ideological. It is existential.
As COP30 drew to a close, the decisions before me were difficult, and I believe I made the right one, grounded in humanity and in the defence of life, which is the guiding purpose of my political project for a renewed progressivism in the world.
Gustavo’s Full Statement after COP [dizzy: Recommended]
The death wish: why elites act against their own survival
The biggest misunderstanding in the world is that people act out of material self-interest.
No.
Many people want to die — and want the world to die with them — because they hate themselves and they hate life so much. This is the death wish. It is supported by a century of psychoanalysis, social psychology, and history: under existential threat, societies often choose self-destruction over transformation.
…
This insight is reinforced by decades of experimental work in Terror Management Theory (Greenberg, Pyszczynski, Solomon), which shows that under conditions of heightened mortality awareness people become more authoritarian, more aggressive and more willing to support destructive systems, even against their own material interests.
The repeated historical pattern of elites knowingly destroying the very systems they depend on — from late Rome to pre-revolutionary Europe to today’s fossil economy — fits this psychological picture far better than any rational-actor model. What we are seeing is not rational self-interest, but the death wish operating at a civilisational scale.
Why else do capitalists knowingly act in a way that will destroy capitalism?
Gunther Thallinger of Allianz SE, one of the world’s largest insurance companies, spells it out: “The financial system as we know it ceases to exist and capitalism ceases to be viable at 3°C.” A few years ago, I sat down with a director of E3G — a leading climate think tank. Privately, he admitted that the “death project” will destroy the British state. Publicly, he would never say it.
Yet elites continue to accelerate the trajectory toward 3°C. This is not rational self-interest. It is civilisation-wide self-destruction.