Climate Crisis :: New findings on ocean warming: 5 questions answered
New findings on ocean warming: 5 questions answered

Editor’s note: A new study by scientists in the United States, China, France and Germany estimates that the world’s oceans have absorbed much more excess heat from human-induced climate change than researchers had estimated up to now. This finding suggests that global warming may be even more advanced than previously thought. Atmospheric scientist Scott Denning explains how the new report arrived at this result and what it implies about the pace of climate change.
1. How do scientists measure ocean temperature and estimate how climate change is affecting it?
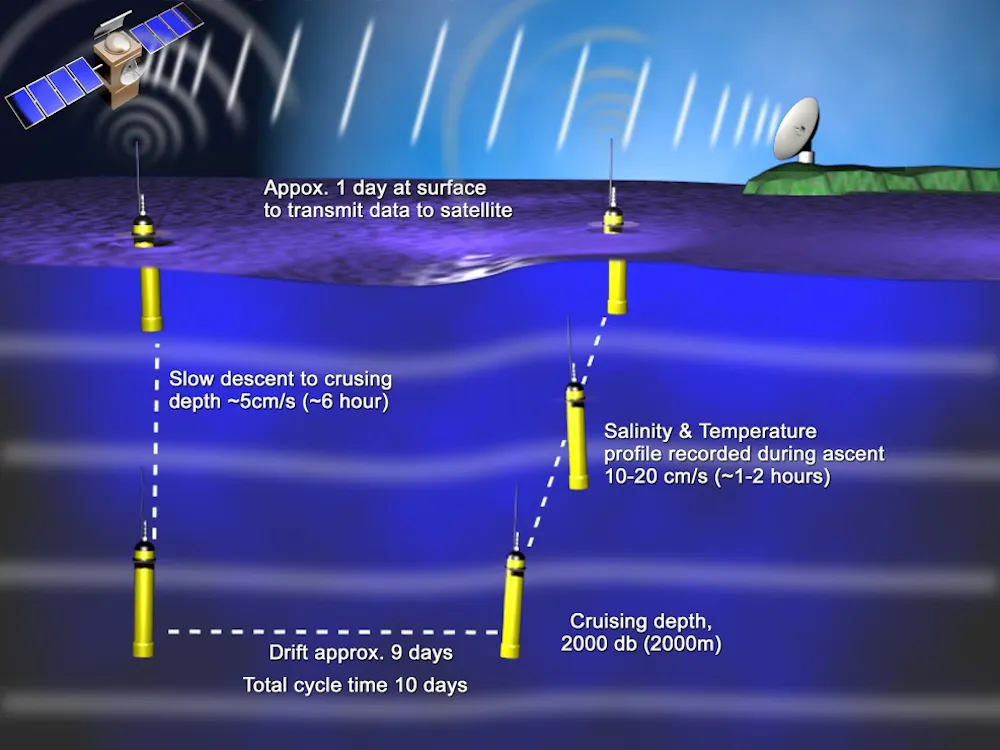
They use thermometers attached to thousands of bobbing robots floating at controlled depths throughout the oceans. This system of “Argo floats” was launched in the year 2000 and there are now about 4,000 of the floating instruments.
About once every 10 days, they cycle from the surface to a depth of 6,500 feet, then bob back up to the surface to transmit their data by satellite. Each year this network collects about 100,000 measurements of the three-dimensional temperature distribution of the oceans.
The Argo measurements show that about 93 percent of the global warming caused by burning carbon for fuel is felt as changes in ocean temperature, while only a very small amount of this warming occurs in the air.
2. How dramatically do the findings in this study differ from levels of ocean warming that the Intergovernmental Panel on Climate Change has reported?
The new study finds that since 1991, the oceans have warmed about 60 percent faster than the average rate of warming estimated by studies summarized by the IPCC, which are based on data from Argo floats. This is a big deal.
Most of the difference comes from the earliest part of this period, before there were enough Argo floats in the oceans to properly represent the three-dimensional distribution of global water temperatures. The new data are complete all the way back to 1991, but the Argo data were really sparse until the mid-2000s.
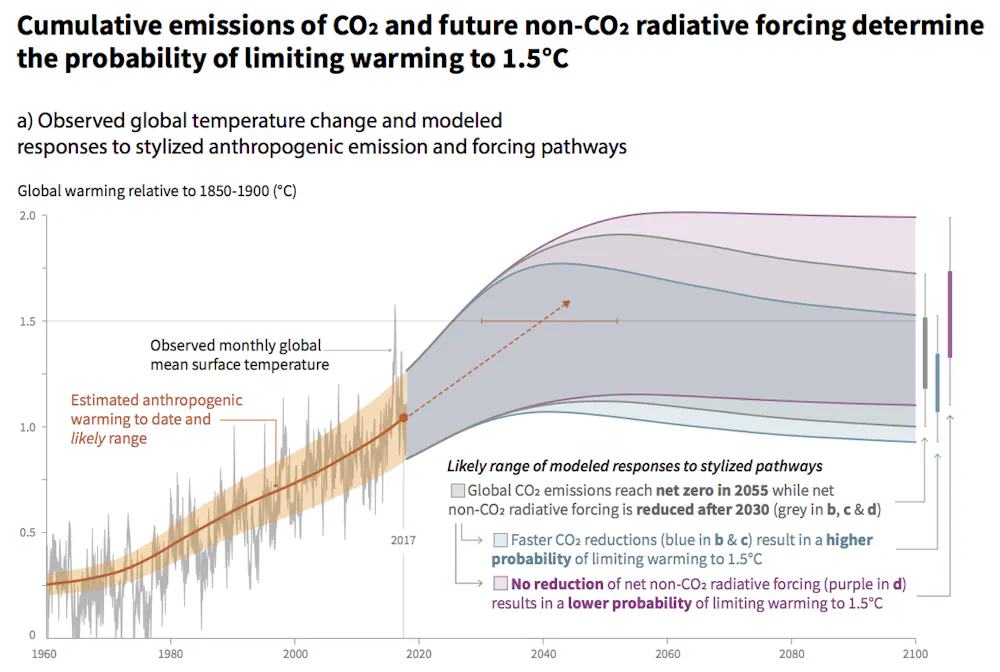
The implication of faster ocean warming is that the effect of carbon dioxide on global warming is greater than we’d thought. We already knew that adding CO2 to the air was warming the world very rapidly. And the IPCC just warned in a special report that limiting global warming to 1.5 degrees Celsius (2.7 degrees Fahrenheit) above pre-industrial levels – a target that would avert many extreme impacts on humans and ecosystems – would require quickly reducing and eventually eliminating coal, oil and gas from the world energy supply. This study doesn’t change any of that, but it means we will need to eliminate fossil fuels even faster.
3. What did these researchers do differently to arrive at a higher number?
They have measured tiny changes since 1991 in the concentrations of a few gases in the air – oxygen, nitrogen and carbon dioxide – with incredibly high precision. This is really hard to do, because the changes are extremely small compared to the large amounts already in the air.
Some of these gases from the air dissolve into the oceans. The water’s temperature dictates how much it can absorb. As water warms, the amount of a gas that can dissolve in it decreases – that’s why a soda or beer left open on the kitchen table goes flat. That same temperature dependence allowed the scientists to calculate total changes in global ocean heat content from 1991 to now, just using very precise measurements of the air itself.
4. If this study is accurate, what does it suggest we should expect in the way of major climate change impacts in the coming decades?
This study did not address climate impacts, but they are already well known. As the world warms, more water vapor evaporates from both oceans and land. This means that when big storms develop, there’s more water vapor in the air for them to “work with,” which will produce more extreme rain and snow and resulting winds.
Greater warming will mean increased water demand for crops and forests and pastures, more stress on irrigation and urban water supplies, and reduced food production. More water demand means more forest fires and smoke, shorter winters with less mountain snowpack, and increased stress on ecosystems, cities and the world economy. Because of these effects, nearly every government in the world has committed to rapid emissions cuts to limit global warming.
What this study suggests is that the climate is more sensitive to greenhouse gases than we previously thought. This means that in order to avoid the worst consequences of climate change, emissions will need to be cut faster and deeper.
5. How will we know whether these findings hold up?
There are other groups making precise gas measurements, and many of them have data going back to the 1990s. Others will repeat the analyses made by these authors and check their results. There will also be careful work to reconcile the increased warming rate of the oceans with the Argo temperature data, the surface air temperature record, atmospheric data from balloons and measurements made from satellites. The real world must be consistent with all of the observations taken together, not just a subset.
This study very cleverly used data from the composition of the air itself going back nearly 30 years. We didn’t have Argo floats back then, but air samples are still available that can be analyzed decades later. Using a longer record of warming is much better for estimating the rate, because it’s less sensitive to year-to-year variations than a shorter record.
These scientists have given us a new and independent way to assess the sensitivity of long-term global warming to changes in atmospheric CO2 levels. I expect the findings will indeed hold up, and that we will be hearing a lot more about this new method in the future.![]()
Scott Denning, Professor of Atmospheric Science, Colorado State University
This article is republished from The Conversation under a Creative Commons license. Read the original article.
Climate Crisis :: Global heating: London to have climate similar to Barcelona by 2050
Nearly 80% of cities to undergo dramatic and potentially disastrous changes, study finds
London will have a similar climate in three decades’ time to that of Barcelona today, according to research – but if that seems enticing, a warning: the change could be accompanied by severe drought.
Madrid will feel like present-day Marrakech by 2050, and Stockholm like Budapest, according to . Around the world, cities that are currently in temperate or cold zones in the northern hemisphere will resemble cities more than 600 miles (1,000km) closer to the equator, with damaging effects on health and infrastructure.
Among other analogues, the study suggests Moscow will resemble Sofia, Seattle will feel like San Francisco and New York will be comparable to Virginia Beach. The researchers have created an interactive map showing hundreds of cities and their 2050 counterparts.
Water shortages will affect scores of cities now in temperate climates as a result of the global heating, which is forecast to be by as much as 3.5C in European cities in summer and 4.7C in winter.
…
Climate Crisis: Arctic ice loss is worrying, but the giant stirring in the South could be even worse
Arctic ice loss is worrying, but the giant stirring in the South could be even worse
Nerilie Abram, Australian National University; Matthew England, UNSW, and Matt King, University of Tasmania
A record start to summer ice melt in Greenland this year has drawn attention to the northern ice sheet. We will have to wait to see if 2019 continues to break ice-melt records, but in the rapidly warming Arctic the long-term trends of ice loss are clear.
But what about at the other icy end of the planet?
Antarctica is an icy giant compared to its northern counterpart. The water frozen in the Greenland ice sheet is equivalent to around 7 metres of potential sea level rise. In the Antarctic ice sheet there are around 58 metres of sea-level rise currently locked away.
Like Greenland, the Antarctic ice sheet is losing ice and contributing to unabated global sea level rise. But there are worrying signs Antarctica is changing faster than expected and in places previously thought to be protected from rapid change.
The threat from beneath
On the Antarctic Peninsula – the most northerly part of the Antarctic continent – air temperatures over the past century have risen faster than any other place in the Southern Hemisphere. Summer melting already happens on the Antarctic Peninsula between 25 and 80 days each year. The number of melt days will rise by at least 50% when global warming hits the soon-to-be-reached 1.5℃ limit set out in the Paris Agreement, with some predictions pointing to as much as a 150% increase in melt days.
But the main threat to the Antarctic ice sheet doesn’t come from above. What threatens to truly transform this vast icy continent lies beneath, where warming ocean waters (and the vast heat carrying capacity of seawater) have the potential to melt ice at an unprecedented rate.
Read more: New findings on ocean warming: 5 questions answered
Almost all (around 93%) of the extra heat human activities have caused to accumulate on Earth since the Industrial Revolution lies within the ocean. And a large majority of this has been taken into the depths of the Southern Ocean. It is thought that this effect could delay the start of significant warming over much of Antarctica for a century or more.
However, the Antarctic ice sheet has a weak underbelly. In some places the ice sheet sits on ground that is below sea level. This puts the ice sheet in direct contact with warm ocean waters that are very effective at melting ice and destabilising the ice sheet.
Scientists have long been worried about the potential weakness of ice in West Antarctica because of its deep interface with the ocean. This concern was flagged in the first report of the Intergovernmental Panel on Climate Change (IPCC) way back in 1990, although it was also thought that substantial ice loss from Antarctica wouldn’t be seen this century. Since 1992 satellites have been monitoring the status of the Antarctic ice sheet and we now know that not only is ice loss already underway, it is also vanishing at an accelerating rate.
The latest estimates indicate that 25% of the West Antarctic ice sheet is now unstable, and that Antarctic ice loss has increased five-fold over the past 25 years. These are remarkable numbers, bearing in mind that more than 4 metres of global sea-level rise are locked up in the West Antarctic alone.
Antarctic ice loss 1992–2019, European Space Agency.
Read more: Antarctica has lost nearly 3 trillion tonnes of ice since 1992
Thwaites Glacier in West Antarctica is currently the focus of a major US-UK research program as there is still a lot we don’t understand about how quickly ice will be lost here in the future. For example, gradual lifting of the bedrock as it responds to the lighter weight of ice (known as rebounding) could reduce contact between the ice sheet and warm ocean water and help to stabilise runaway ice loss.
On the other hand, melt water from the ice sheets is changing the structure and circulation of the Southern Ocean in a way that could bring even warmer water into contact with the base of the ice sheet, further amplifying ice loss.
There are other parts of the Antarctic ice sheet that haven’t had this same intensive research, but which appear to now be stirring. The Totten Glacier, close to Australia’s Casey station, is one area unexpectedly losing ice. There is a very pressing need to understand the vulnerabilities here and in other remote parts of the East Antarctic coast.
The other type of ice
Sea ice forms and floats on the surface of the polar oceans. The decline of Arctic sea ice over the past 40 years is one of the most visible climate change impacts on Earth. But recent years have shown us that the behaviour of Antarctic sea ice is stranger and potentially more volatile.
The extent of sea ice around Antarctica has been gradually increasing for decades. This is contrary to expectations from climate simulations, and has been attributed to changes in the ocean structure and changing winds circling the Antarctic continent.
But in 2015, the amount of sea ice around Antarctica began to drop precipitously. In just 3 years Antarctica lost the same amount of sea ice the Arctic lost in 30.
Read more: Why Antarctica’s sea ice cover is so low (and no, it’s not just about climate change)
So far in 2019, sea ice around Antarctica is tracking near or below the lowest levels on record from 40 years of satellite monitoring. In the long-term this trend is expected to continue, but such a dramatic drop over only a few years was not anticipated.
There is still a lot to learn about how quickly Antarctica will respond to climate change. But there are very clear signs that the icy giant is awakening and – via global sea level rise – coming to pay us all a visit.
Nerilie Abram, ARC Future Fellow, Research School of Earth Sciences; Chief Investigator for the ARC Centre of Excellence for Climate Extremes, Australian National University; Matthew England, Australian Research Council Laureate Fellow; Deputy Director of the Climate Change Research Centre (CCRC); Chief Investigator in the ARC Centre of Excellence in Climate System Science, UNSW, and Matt King, Professor, Surveying & Spatial Sciences, School of Technology, Environments and Design, University of Tasmania
This article is republished from The Conversation under a Creative Commons license. Read the original article.