‘Like Putting a Flat Earther in Charge of NASA’: Trump Appoints Climate Denier to Key Climate Post
Article by Brad Reed republished from Common Dreams under Creative Commons (CC BY-NC-ND 3.0).

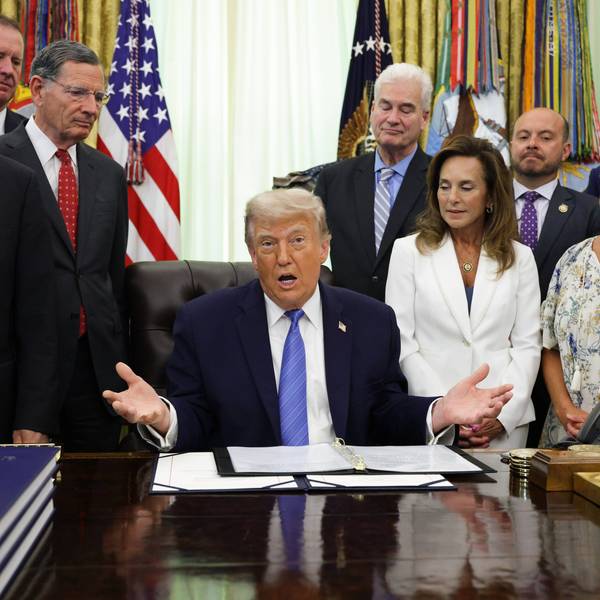
(Photo by Selcuk Acar/Anadolu via Getty Images)
Putting an “utterly unqualified” person like Matthew Wielicki in charge of the National Climate Assessment, said one critic, “would jeopardize the integrity of one of the nation’s most important climate science resources.”
The Trump White House has quietly reconstituted the US Global Change Research Program—but that doesn’t mean the administration has turned over a new leaf on combating the climate crisis.
According to a Thursday report from Politico, the administration decided to bring the USGCRP, which tracks the impact of manmade climate change and produces the country’s National Climate Assessment report, back to life just a little more than a year after terminating its funding.
RECOMMENDED…

‘How Small They Are’: Mamdani Takes Apart MAGA’s Vision of America in July 4 Address
‘At Least He Admits It’: Trump Says Pro-Democracy Resolution Would Destroy GOP
But there’s a twist: A source has confirmed to Politico that the USGCRP is now being headed by Matthew Wielicki, a former University of Alabama geochemist and self-described “professor in exile” who frequently attacks climate science in social media posts.
In his role, Wielicki will be in charge of writing the National Climate Assessment, a congressionally mandated report outlining the impacts that climate change is having on US infrastructure and the economy.
In an interview with Politico, Wielicki revealed that he’s been soliciting ideas for what to include in the next National Climate Assessment from X, the social media website owned by Elon Musk that is notorious for being awash in right-wing propaganda and scientific misinformation.
In the past, noted Politico, Wielicki dismissed climate research entirely, arguing that a “significant portion of the climate science literature is nothing more than stamp collecting,” while suggesting that scientists are fabricating data to give a false impression of a warming planet.
Dr. Carlos Martinez, senior climate scientist for the Climate and Energy program at the Union of Concerned Scientists, wasted no time blasting Wielicki’s appointment.
“Reconstituting the UCSGCRP only to place the National Climate Assessment under the auspices of an utterly unqualified climate science denier,” Martinez said, “would jeopardize the integrity of one of the nation’s most important climate science resources.”
Martinez emphasized that the National Climate Assessment “is not a political document” and is “supposed to be developed through a rigorous, transparent, multi-agency scientific process involving federal experts, external scientists, extensive review—including by the National Academies—and public input.”
Ryan Katz-Rosene, professor at the School of Political Studies at the University of Ottawa, said Wielicki’s appointment “sadly… is not a joke,” and that it was “like putting a Flat Earther in charge of NASA.”
Article by Brad Reed republished from Common Dreams under Creative Commons (CC BY-NC-ND 3.0).


- ‘A Mockery of Science’: Experts Slam Trump DOE’s Climate Report in New Paper ›
- ‘Out of Step’ US Condemned for Trying to Erase Climate From Scientific Report for Antarctic Treaty ›
- Trump ‘Taking a Sledgehammer’ to One of World’s Most Vital Climate Research Center, Scientists Warn ›
- Trump Is Attacking Climate Science. Scientists Are Fighting Back. | The New Republic ›