Study links world’s top oil and gas firms to 200 ‘more intense’ heatwaves

Spread the love

Original article by Ayesha Tandon republished from Carbon Brief under a CC license.

A group of tourists huddled under a tree whilst visiting the Acropolis, Athens, Greece. Credit: Dimitris Aspiotis / Alamy Stock Photo

Global warming linked to the world’s biggest oil and gas companies made all “major” 21st century heatwaves more intense and frequent.

This is according to new research, published in Nature, which uses “extreme event attribution” to assess the impact of climate change on all 21st-century heatwaves that were classified as “major disasters”.

The authors find one-quarter of the 213 heatwaves would have been “virtually impossible” without human-caused global warming.

They add that the effect of climate change on heatwave frequency and intensity is becoming more pronounced as the planet warms.

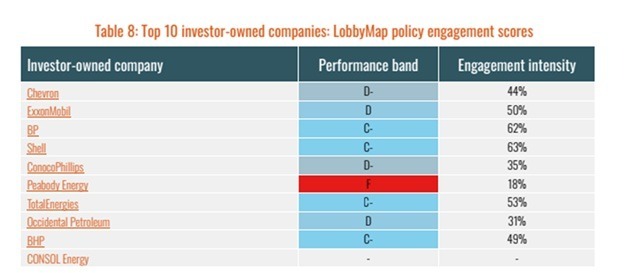
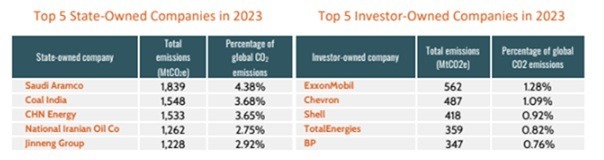
The study estimates the emissions stemming from the operations and production of more than 100 “carbon majors”, such as ExxonMobil, BP, Saudi Aramco and Shell.

The fossil fuels produced by these companies account for 60% of all human-caused CO2 emissions over 1850-2023, the study says.

The authors find that heatwaves recorded over 2000-23 were made, on average, 1.7C hotter due to climate change, with half of this increase due to the emissions originating from carbon majors. 

This study “could be used to support future climate lawsuits and aid diplomatic negotiation”, according to a scientist not involved in the research.

Worsening heatwaves 

As the planet warms, heatwaves are becoming more intense and frequent, driving economic lossesecosystem damage and a rise in heath-related deaths

The EM-DAT database catalogues all “major disasters” that have been reported since the year 1900 – defined as events that cause at least 10 fatalities, affect at least 100 people, or result in the declaration of state of emergency or a call for international assistance.

Between 2000 and 2023, the database lists more than 200 heatwaves. These are shown on the map below, where darker pink indicates a greater number of heatwaves. Countries with no reported heatwaves are shown in grey.

Global map showing that more than 200 'major' heatwaves have been recorded around the world in the 21st century
The map below shows the number of heatwaves per country recorded over 2000-23 on the EM-DAT database. Data: Quilcaille et al (2025).

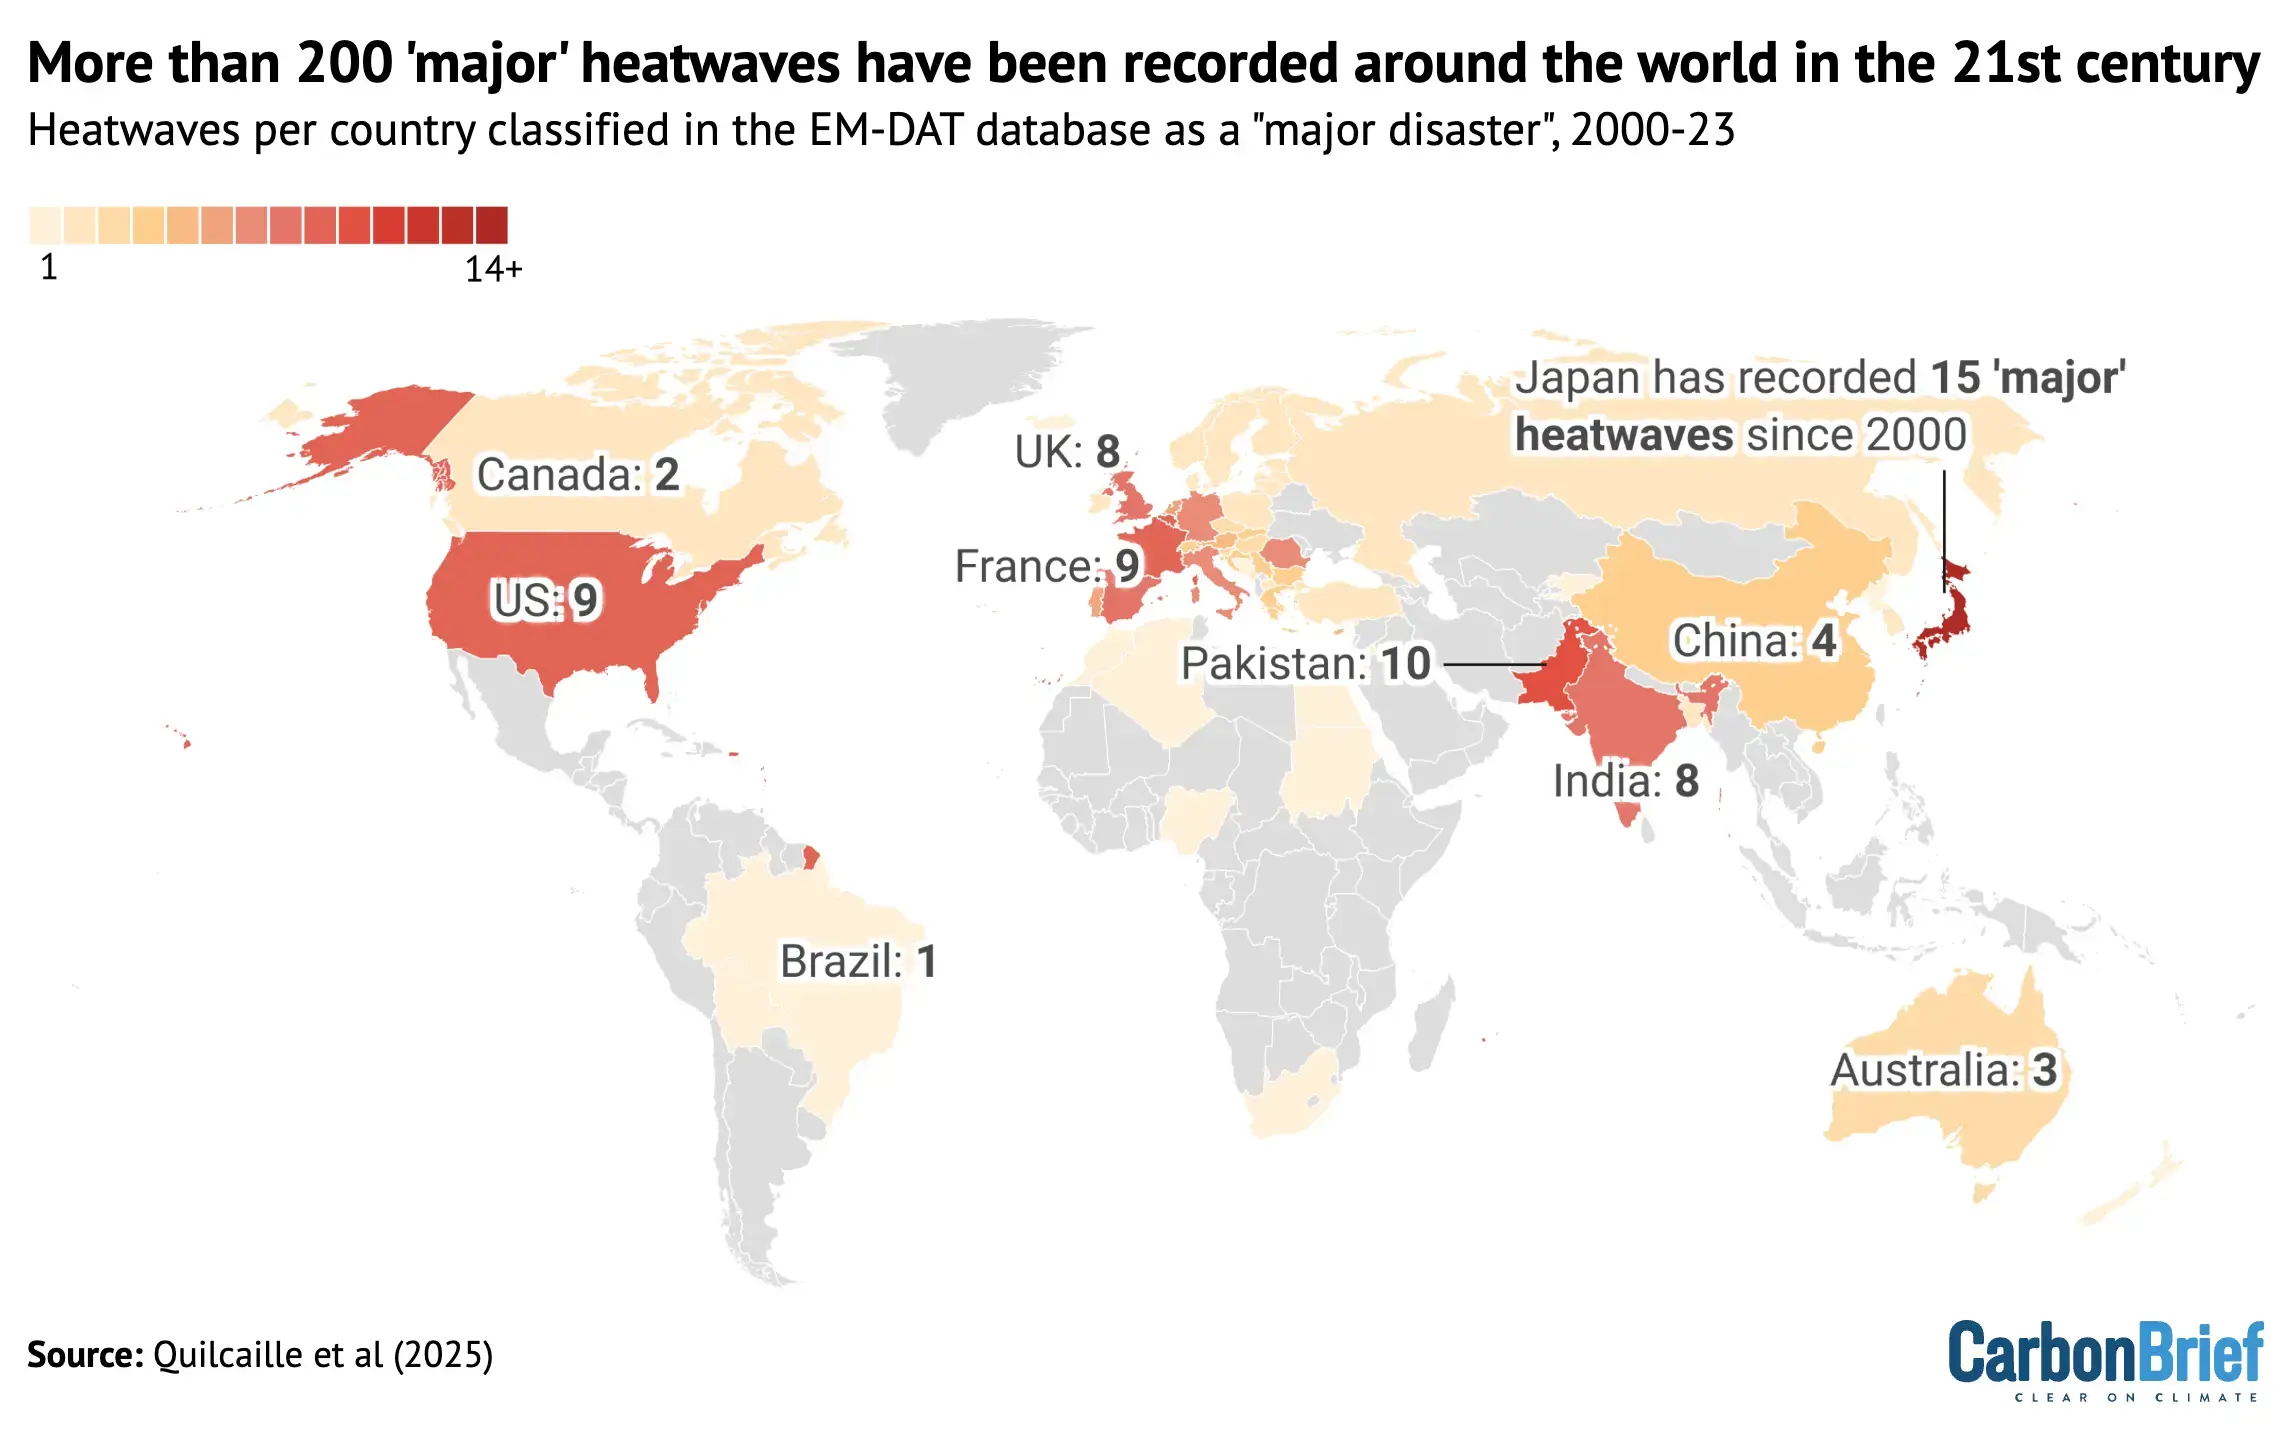
The study authors acknowledge that heatwave reporting is “highly uneven”, with only nine of the heatwaves reported in the database since the year 2000 in Africa, Latin America or the Caribbean. (This is largely because extreme heat events in these regions are not routinely monitored.)

They then carried an attribution analysis on each heatwave to identify whether it was made more likely or intense due to human-caused climate change.

The chart below shows how climate changes increased the intensity and frequency of the 78 heatwaves assessed over 2000-09 (left), 54 heatwaves assessed over 2010-19 (middle) and 81 heatwaves assessed over 2020-23 (right).

The authors find that climate change increased the intensity and probability of all 213 heatwaves in the study. They add that the influence of climate change on heatwaves is strengthening over time.

In each panel, the bars show the percentage of heatwaves in that time period that were made 0.25-1.0C (yellow), 1.0-2.0C (orange) or 2.0-3.0C (red) hotter due to climate change. 

The position of bars indicate the change in likelihood of the heatwaves. This ranges from those made 1-10 times more likely due to climate change (left-most bar in each panel) to those made more than 11,000 times more likely (right-most bar in each panel). 

Bar chart showing change in heat intensity
The extent to which climate changes increased the intensity and frequency of the 78 heatwaves assessed over 2000-09 (left), 54 heatwaves assessed over 2010-19 (middle) and 81 heatwaves assessed over 2020-23 (right). These are shown by colours and bar heights respectively. Source: Quilcaille et al (2025).

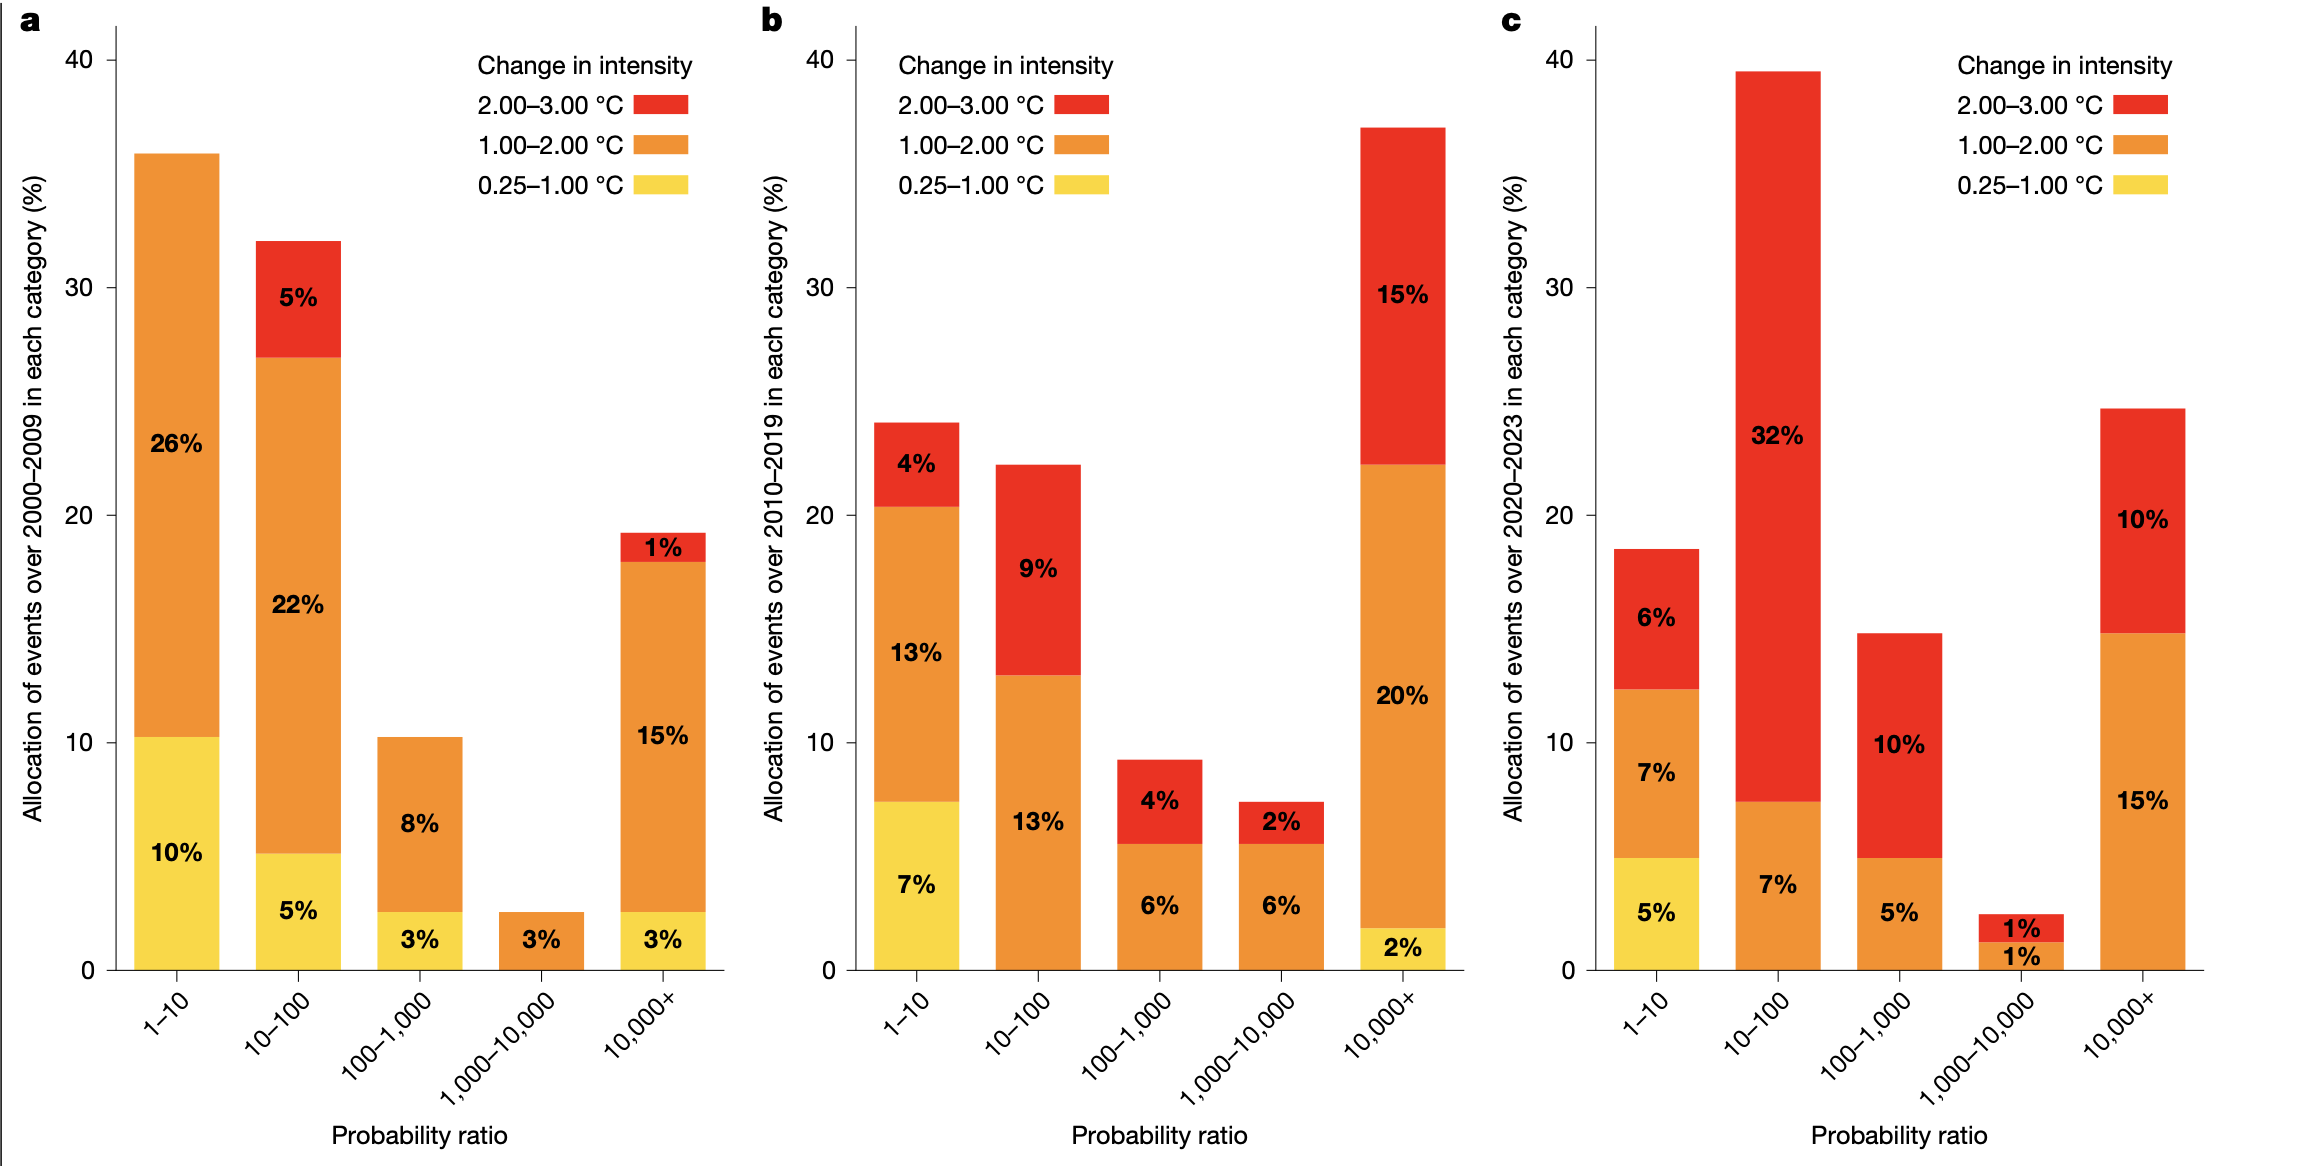
Heatwaves recorded over 2000-09 were, on average, 20 times more likely due to climate change, according to the authors. Meanwhile, those recorded over 2010-19 were about 200 times more likely. 

Similarly, 2000-09 heatwaves were 1.4C hotter due to human-caused climate change on average, according to the study, while 2010-19 heatwaves were made 1.7C hotter.

The study finds that human-caused climate change made 55 heatwaves at least 10,000 times more likely. According to the authors, this is “equivalent to saying that they would have been virtually impossible” without the influence of human activity.

Carbon majors

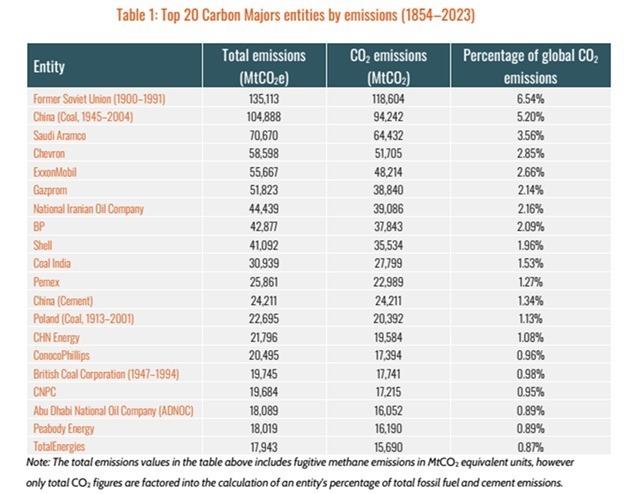
To assess the contribution to heatwaves by oil and gas companies’ products, the authors use a database of carbon dioxide and methane emissions from 180 carbon majors over 1854-2023. This includes direct emissions from the companies, as well as the emissions released when the oil and gas they produced is used by others. 

The 180 carbon majors in the database represent 60% of all human-caused CO2 emissions, including land use, over 1850-2023, according to the study. The paper adds that 14 companies, including ExxonMobil, BP, Saudi Aramco and Shell, are responsible for almost half of these emissions.

Using the Earth system model OSCAR, the authors estimate that global average surface temperatures increased by 1.3C between the 1850-1900 average and the year 2023.

They find that 0.7C of this increase was linked to the carbon majors, with 0.3C due to the emissions of the 14 largest.

The chart below, taken from an accompanying Nature “news and views” article, shows the contribution of oil and gas companies’ products to increasing global average surface temperatures over 1950-2023, compared to the 1850-1900 average. 

Each colour indicates a carbon major, while grey indicates other sources of temperature increase, such as land-use change. 

The contribution of oil and gas companies to increasing global average surface temperatures over 1950-2023, compared to the 1850-1900 average. Each colour indicates a company, while grey indicates other sources of temperature increase. Source: Haustein (2025).

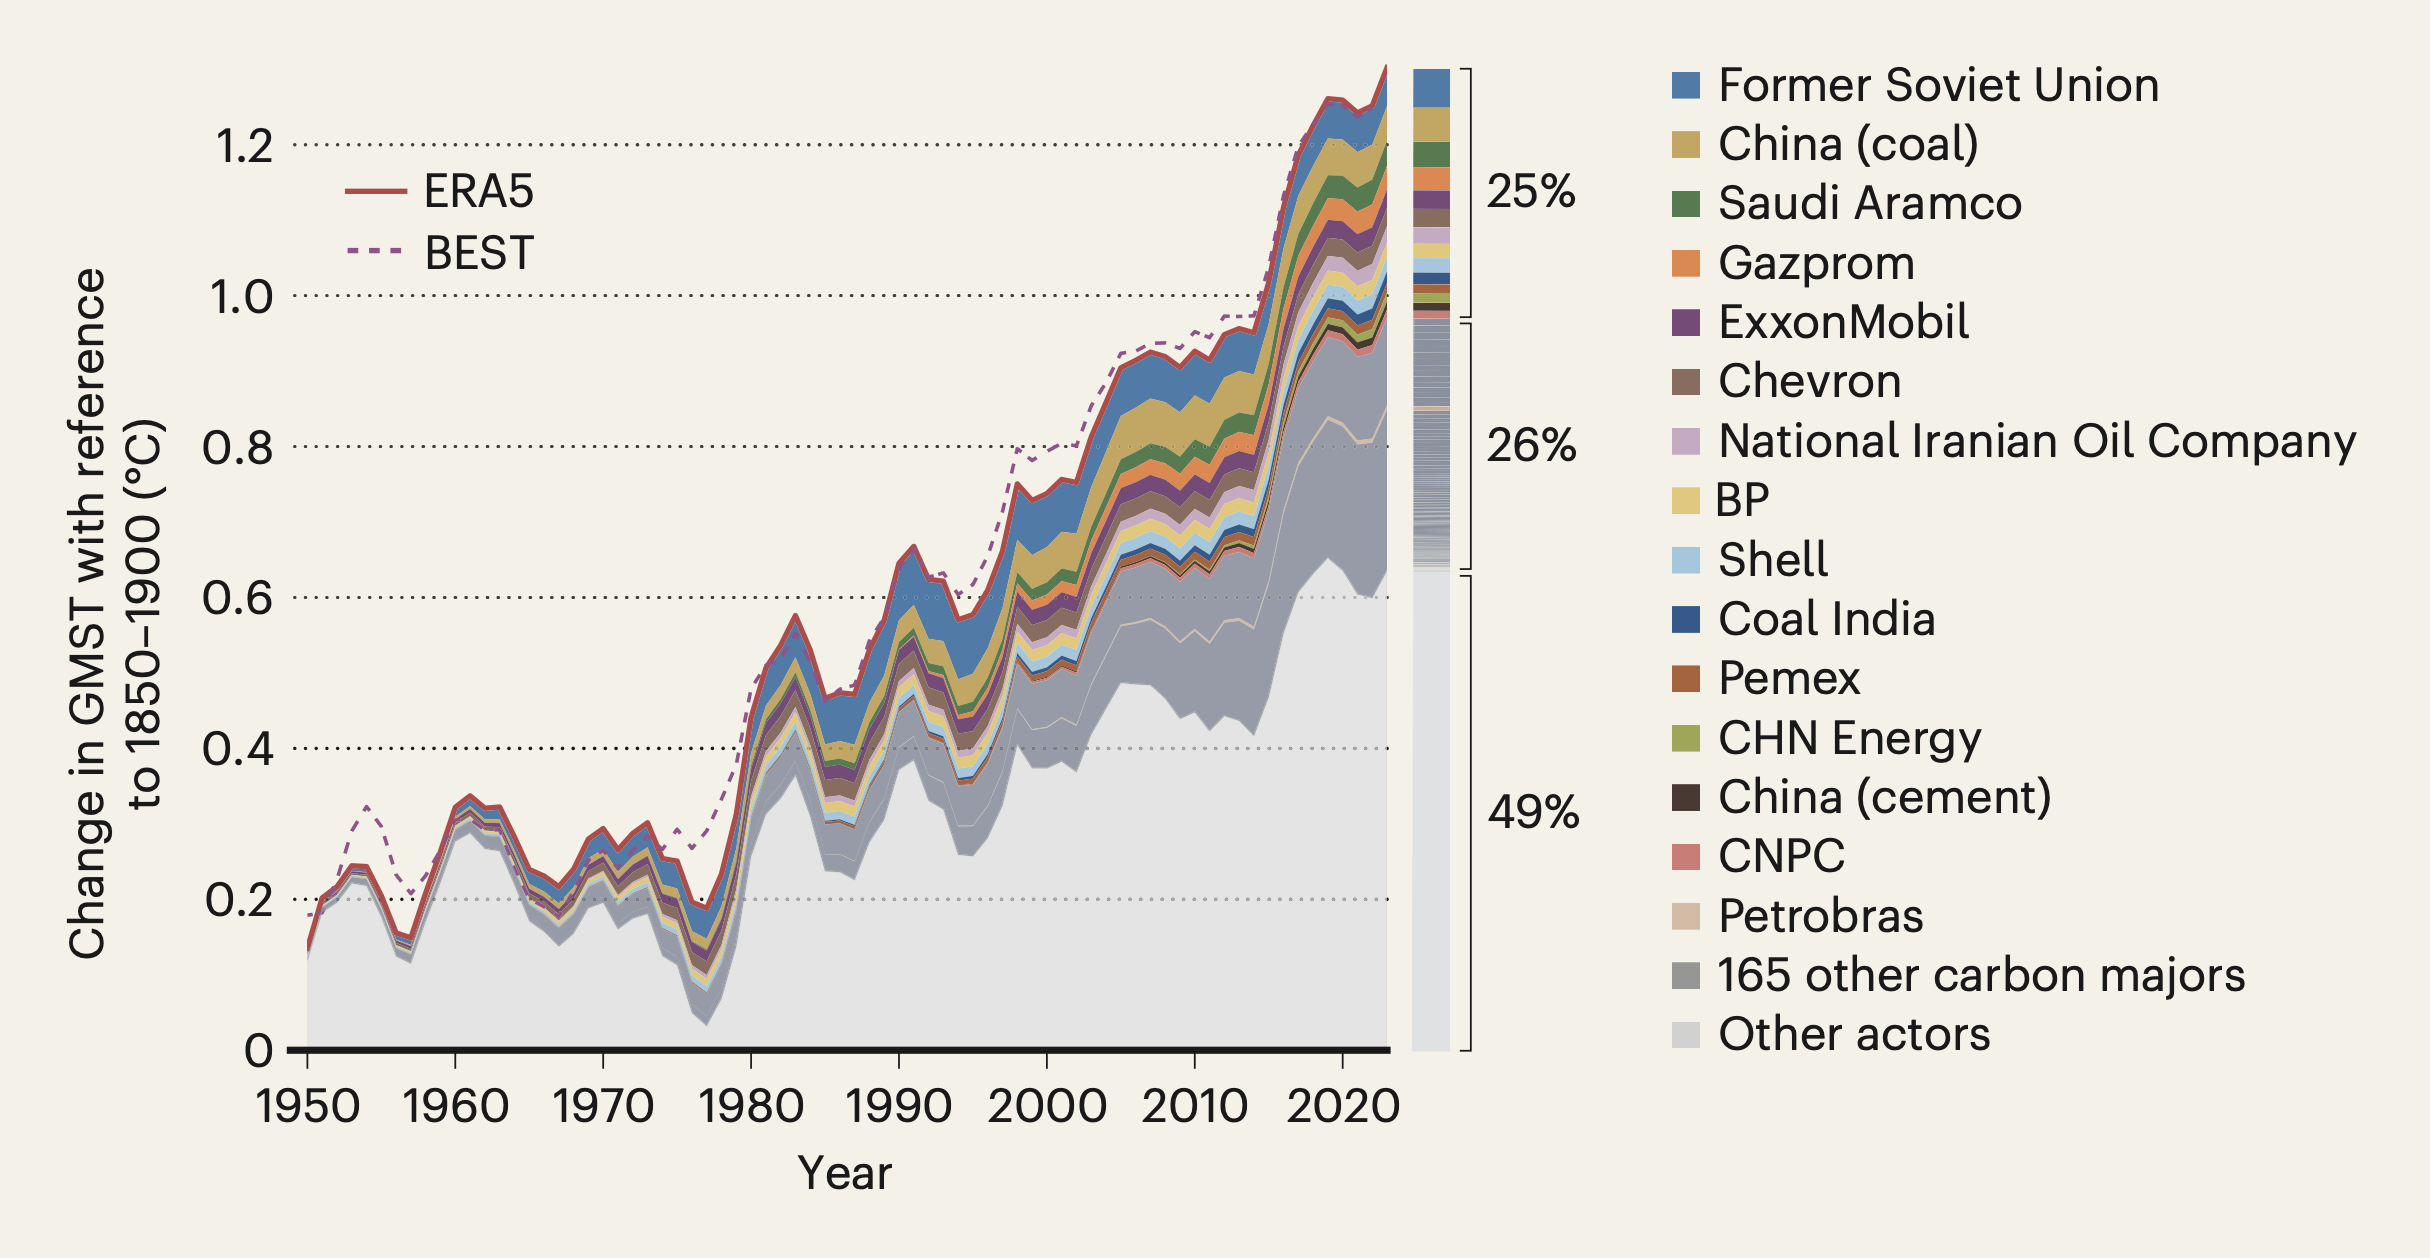
Heatwaves recorded over 2000-23 were, on average, 1.7C hotter due to climate change, according to the study. The authors find that emissions originating from carbon majors and their products contributed about half of the increase in intensity of heatwaves seen since pre-industrial times.

The authors then break down the contribution of emissions from each carbon major on each heatwave in their analysis.

For example, they find that the emissions linked to Saudi Aramco made 51 heatwaves at least 10,000 times more likely. They add that on average, emissions tied to the company made the 213 heatwaves 0.04C hotter.

Legal action

Attribution studies already play an important role in courts by providing evidence that helps judges to determine liability. 

Dr Rupert Stuart-Smith is a research associate in climate science and the law at the University of Oxford’s Sustainable Law Programme. He was not involved in the study, but has published separate work showing that the emissions linked to each of the six largest corporate emitters cause one heat-related death in Zurich alone, every summer.

Stuart-Smith tells Carbon Brief that the new paper is a “high-quality analysis and a meaningful step forward for the field of climate change attribution”. He adds:

“With more and more lawsuits aiming to hold high-emitting companies responsible for their contributions to climate change impacts or compel state and corporate actors to reduce their emissions and prevent rising climate harms, work like this provides the basis for well-informed judicial decision-making.”

Dr Yann Quilcaille is a researcher at ETH Zürich and lead author of the study. He stresses the importance of attribution research for court cases, telling Carbon Brief that he hopes his work “can be used by legal practitioners”.

However, he also says that his role as a scientist is not to assign “responsibility” for climate change, but to “provide information to governments for decision making and to courts for litigation”.

Earlier this year, Dr Christopher Callahan, the principal investigator of the IU Climate & Society Lab, published a study with Prof Justin Makin, an associate professor in the department of geography at the University of Dartmouth, which links trillions of dollars in economic losses to the extreme heat caused by emissions tied to oil and gas companies. 

Mankin tells Carbon Brief that the new paper is “very closely” linked to his research.

Callahan says the new paper is “an important contribution to an emerging literature that illustrates how individual emitters can be linked to the change risk of extreme climate conditions and human impacts”.

He explains that “this kind of evidence will be important in courtrooms – holding emitters legally accountable requires demonstrating a causal nexus between that emitter and a particularised harm suffered by a plaintiff”. 

Attribution

The cutting-edge field of extreme weather attribution seeks to establish the role that human-caused warming played in these events. Attribution studies have been carried out on hundreds of heatwaves all around the world, as shown in Carbon Brief’s interactive map.

The new paper uses one of the earliest and most commonly used methods of attribution, called “probabilistic attribution”.

Specifically, it uses the method set out by the World Weather Attribution initiative for its “rapid attribution” analyses.

The authors first chose a temperature “threshold” to define their heatwave. 

They then used a global climate model to simulate two worlds – one mirroring the world as it was during the heatwave and the other using the climate of 1850-1900. This second scenario is used to represent the climate in a world without human-caused climate change.

The authors run their models thousands of times in each scenario. As the world’s climate is inherently chaotic, each model “run” – individual simulations of how the climate progresses over many years – produces a slightly different progression of temperatures. This means that some runs simulate the heatwave, while others do not.

The authors count how many times the threshold temperature was in each model run. They then compared the likelihood of crossing the threshold temperature in the world with – and a world without – climate change.

For example, they find that the 2021 Pacific north-west heatwave was made 3.1C hotter due to human caused climate change and more than 10,000 times more likely. 

(A study by the WWA at the time of the heatwave found that the heatwave was made 150 times more likely. The discrepancy is due to differences in the definition of the event, as well as its “very unlikely nature” according to the study authors.)

Dr Frederieke Otto is a professor at Imperial College London and founder of the WWA initiative. She tells Carbon Brief that the new study is “very similar to some other recent studies on impacts, based on the hazard attribution method used by WWA”, but says that “this is the most high profile and wide-reaching one”.

Otto adds:

“I do hope that many more impact attribution studies will follow, based on our or other extreme event attribution studies. We need more research on this.”

Q&A: How China is adapting to ‘more frequent and intense’ heat extremes China Policy 04.09.25

Analysis: England’s most ethnically diverse areas are 15 times more likely to face extreme heat Heatwaves 12.08.25

Mapped: How climate change affects extreme weather around the world Attribution 18.11.24

Explainer: Why is climate change causing ‘record-shattering’ extreme heat? Heatwaves 27.08.24

Quilcaille, Y. et al. (2025), Systematic attribution of heatwaves to the emissions of carbon majors, Nature, doi:10.1038/s41586-025-09450-9

Original article by Ayesha Tandon republished from Carbon Brief under a CC license.

Donald Trump urges you to be a Climate Science denier like him. He says that he makes millions and millions for destroying the planet, Burn, Baby, Burn and Flood, Baby, Flood.
Nigel Farage urges you to ignore facts and reality and be a climate science denier like him. He says that Reform UK has received millions and millions from the fossil fuel industry to promote climate denial and destroy the planet.
Greenpeace activists display a billboard during a protest outside Shell headquarters on July 27, 2023 in London.
Greenpeace activists display a billboard during a protest outside Shell headquarters on July 27, 2023 in London. (Photo: Handout/Chris J. Ratcliffe for Greenpeace via Getty Images)
Experienced climbers scale a rock face near the historic Dumbarton castle in Glasgow, releasing a banner that reads “Climate on a Cliff Edge.” One activist, dressed as a globe, symbolically looms near the edge, while another plays the bagpipes on the shores below. | Photo courtesy of Extinction Rebellion and Mark Richards
Continue ReadingStudy links world’s top oil and gas firms to 200 ‘more intense’ heatwaves

Just 36 Companies Drove Half the World’s Climate-Altering Emissions in 2023: New Report

Spread the love

Original article by Sharon Kelly republished from DeSmog.

Hurricane Harvey, downgraded to a tropical storm when it hit Vidor, Texas, flooded an Exxon gas station, Sept. 1, 2017. Credit: ©Julie Dermansky

Companies and states most responsible for climate change are also those working hardest to prevent climate action, new Carbon Majors report finds.

Half of the world’s carbon dioxide emissions in 2023 came from just three dozen companies, according to a new report released today by the Carbon Majors project, with the list dominated by coal, cement, and oil producers.

Saudi Arabia’s Saudi Aramco, the year’s worst offender, drove 4.4 percent of the world’s carbon dioxide pollution alone in 2023, the report found.

Five publicly-traded oil companies — ExxonMobil, Chevron, Shell, TotalEnergies, and BP — combined to produce an additional 4.9 percent of the year’s global carbon dioxide emissions from fossil fuels, the report adds.

The Carbon Majors database builds on the innovative work published by researcher Richard Heede of the Climate Accountability Institute (CAI) begun in 2013. For the first time, instead of attributing the build-up of industrial carbon dioxide and methane emissions to each of the world’s nations, Heede managed to trace those emissions to 90 specific “carbon major” companies. Last year, the nonprofit think tank InfluenceMap collaborated with CAI to produce major updates to the database — and today’s report marks the first annual update to that report, incorporating global data from 2023.

The year’s top carbon polluters were a mix of investor-owned and state-owned or national companies — but they have one thing in common.

“They’re some of the most obstructive actors towards climate policy,” Emmett Connaire, a senior analyst at the Carbon Majors project and one of the authors of the report, told DeSmog.

“I think it kind of kills the argument from industry that they’re not responsible for their CO2 emissions because we need fossil fuels to grow,” Connaire said, “when they’re the most obstructive and trying to keep up the demand for their products in the face of the overwhelming scientific opinion.” 

Eight of the nine public companies most responsible for carbon emissions in 2023 were “highly active or strategic” in their climate lobbying, the report notes. And their lobbying efforts took aim at regulating climate-altering pollution or sought to impede the energy transition.“ Of these 9 companies, 5 score a D or below, indicating unsupportive positions on climate policy,” the new report finds, citing data from InfluenceMap’s LobbyMap database, which grades companies based on their alignment with the Paris Agreement. “The remaining 4 score only slightly higher at C-.”

Top 10 investor-owned companies: LobbyMap engagement scores.
InfluenceMap gave climate policy lobbying scores to the top 10 investor-owned companies, all oil, gas, and coal firms. Credit: Carbon Majors 2025 report

None of the five top oil companies named in the report immediately responded to a request for comment from DeSmog.

Investor-owned companies aren’t the only ones actively fighting to prevent climate action, the Carbon Majors report notes.

“State-owned companies are even more oppositional to climate regulation globally according to LobbyMap research,” the report finds, listing Saudi Aramco, Russia’s Gazprom, Mexico’s Pemex, and China’s CHN Energy among the worst actors.

“The ‘Carbon Majors’ are keeping the world hooked on fossil fuels with no plans to slow production,” former United Nations climate chief and Paris Agreement architect Christiana Figueres said in a response accompanying the report. “While states drag their heels on their Paris Agreement commitments, state-owned companies are dominating global emissions — ignoring the desperate needs of their citizens.”

A sizable majority — 80 percent — of the year’s 20 worst offenders are state-owned, the report found.

The 2025 Carbon Majors report compared the total CO2 emissions and percentage of total emissions for the top 5 state-owned (Saudi Aramco, Coal India, CHN Energy, National Iranian Oil, Jinneng Group) and top 5 investor-owned (ExxonMobil, Chevron, Shell, TotalEnergies, BP) companies in 2023
State-owned fossil fuel companies dominated global climate emissions in 2023, compared to public companies, the Carbon Majors report noted. Credit: Carbon Majors report 2025

Throughout history, responsibility for driving climate change is concentrated among a strikingly small number of corporations, the report suggests.

Two-thirds of all fossil fuel and cement emissions worldwide from 1750 through 2023 can be traced to just 181 entities, the report finds, adding that one-third of emissions came from just 26 companies.

These findings may have significant legal consequences. During 2024, New York state and Vermont both enacted “Climate Superfund” laws that aim to hold fossil fuel producers and oil refiners responsible for the damage done by their climate-altering products — and the Carbon Majors database is a proposed tool to assess companies’ relative liabilities, according to InfluenceMap. Its earlier findings have been cited in civil lawsuits brought by U.S. cities and counties against fossil fuel producers and an inquiry in the Philippines (which has seen some of the strongest typhoons in recorded history) into corporate responsibility for human rights violations.

The report approaches companies’ contributions to climate change based on production data —  meaning that it focuses on the companies that do the drilling and mining (which helps avoid double-counting, Connaire told DeSmog). Those production figures are self-reported by companies but are widely used by governments to assess taxes and by investors in public companies. That methodology means that, for example, natural gas pipeline companies and natural gas utilities aren’t included in the report’s rankings. 

Nonetheless, natural gas producers figure among the report’s list of all-time top polluters. That includes the former Chesapeake Energy, which first rose to prominence — and some notoriety — during the shale gas fracking boom only to implode into bankruptcy in 2020. Chesapeake later emerged from bankruptcy and has since merged into the newly formed Expand Energy.

As the Carbon Majors database traces emissions throughout history, it accounts for the effects of mergers and acquisitions in the tumultuous oil industry, known for its booms and busts. “For example, the multiple smaller companies into which the Standard Oil Trust was broken up have evolved to become some of the most recognizable companies in the database today,” the report notes. “Some are direct descendants of Standard Oil, like ExxonMobil, with both Exxon and Mobil as descendants separately, and Chevron. Others have resulted from mergers with descendants of Standard Oil, such as BP and ConocoPhillips.”

Top 20 carbon majors entities by emissions, from 1854-2023: Former Soviet Union (1900-1991), China (Coal, 1945-2004), Saudi Aramco, Chevron, ExxonMobil, Gazprom, National Iranian Oil Company, BP, Shell, Coal India, Pemex, China (Cement), Poland (Coal, 1913-2001), CHN Energy, ConocoPhillips, British Coal Corporation (1947-1994), CNPC, Abu Dhabi National Oil Company (ADNOC), Peabody Energy, TotalEnergies
The Carbon Majors database traces the historical cumulative emissions of the top individual entities, such as Chevron or the former Soviet Union, from 1854 through 2023. Credit: Carbon Majors report 2025

It also calls attention to the importance of coal pollution — not just historically, but also in 2023.

“In 2023, coal remained the largest source of emissions, contributing 41.1 percent of emissions in the database,” the new report finds, “continuing a steady increase since 2016.”

Emissions from the cement industry — also a major driver of carbon pollution — increased significantly in 2023, rising 6.5 percent year-over-year, which the Carbon Majors report noted was “the largest relative rise” found. “Four of the five companies with the greatest relative increases in emissions in 2023 were cement companies — Holcim Group, Heidelberg Materials, UltraTech Cement, and CRH — with cement emissions seeing the largest relative rise among the four commodity types.”

Cement producers aren’t the only ones, however. In fact, emissions from most of the top emitters rose in 2023, the Carbon Majors report found. 

“It is truly alarming that the largest fossil fuel companies continue to increase their emissions in the face of worsening natural disasters caused by climate change, disregarding scientific evidence that these emissions are harming us all,” said Tzeporah Berman, founder of the Fossil Fuel Non-Proliferation Treaty Initiative. “It is clearer than ever that dirty private companies, driven by profits and business as usual, will never choose to self-regulate. Governments around the world must use their power to end fossil fuel expansion and transition their economies before fossil fuel companies destroy the planet.”

Original article by Sharon Kelly republished from DeSmog.

Greenpeace activists display a billboard during a protest outside Shell headquarters on July 27, 2023 in London.
Greenpeace activists display a billboard during a protest outside Shell headquarters on July 27, 2023 in London. (Photo: Handout/Chris J. Ratcliffe for Greenpeace via Getty Images)
Neo-Fascist Climate Science Denier Donald Trump says Burn, Baby, Burn.
Continue ReadingJust 36 Companies Drove Half the World’s Climate-Altering Emissions in 2023: New Report