US ports are now starting to see scheduled shipments from China decline as the result of Donald Trump’s 145% tariffs on Chinese goods. The port of Los Angeles, the biggest port for Chinese goods in the US, is predicting scheduled shipments in early May to be about a third lower than the same time last year.
Declining numbers of ships arriving stocked with Chinese imports are likely to affect US supermarket shelves soon, and after warnings from US supermarket bosses, Trump responded by saying trade talks between the US and China were under way in the past few days. But Chinese president Xi Jinping quickly denied talks were happening, suggesting he has no intention of backing away from a fight with the US.
As one of the most powerful leaders in the history of the People’s Republic of China, Xi has fashioned himself as a nationalistic icon. So if China perceives Trump’s tariffs as a bully tactic designed to undermine it, backing down from a confrontation with the US would seriously undermine Xi’s strongman image and rhetoric.
This is something that Trump probably hadn’t considered. At a rally marking his 100 days in office, the US president was still suggesting that China would just back down and “eat the tariffs”.
While tariffs appear to be the primary weapon in the trade war, China might have more tactics to hit back at Trump and the US economy. The question is what might they be?
A few weeks ago it seemed like Washington might punish China’s lack of willingness to negotiate with more tariffs, but now it’s clear that Trump is willing to make a deal and is trying to get China to come to the table. Trump is now implying that US tariffs on China could come down substantially. And US treasury secretary Scott Bessent has called the trade war with China “unsustainable”.
Leveraging agriculture and energy
China has reduced its reliance on US farm imports since the trade war began in Trump’s first presidency. This is bad news for Washington as agriculture is one few sectors in the US that actually has a large trade surplus with China. The 125% retaliatory tariffs will harm the sector’s profitability.
But China’s retaliatory tariffs aren’t the only issue American farmers have to contend with. As the trade war escalates, China has been using bureaucratic hurdles to restrict US agricultural products from entering China and as a potential negotiation tool. For instance, China has delayed the renewals of export license renewals of US pig farmers, and refused to renew licenses of poultry farmers for “health and safety” reasons.
Beijing’s actions might be designed to particularly hit the economy in core Trump supporting states. A major part of Trump and the Republican party’s base lies in “red states”, such as Nebraska, Iowa and Kansas, all have significant farming communities. Focusing on agricultural issues is a tactic that Beijing realises will hit home with Trump voters.
Out of the 444 US counties designated by the United States Department of Agriculture (USDA) as farming-dependent, 77.7% voted for Trump during the 2024 US presidential election. So, any hardship faced by the agriculture sector due to Trump’s own actions is likely to lose him support from a major political base. And with mid-term elections in 2026, Trump has to tread carefully when antagonising Beijing.
Another support base that Beijing might seek to undermine is those involved in the fossil fuel sector. In the past, the US has been a top supplier of natural gas to China.
China has not imported natural gas from the US since early February 2025, and has sought its natural gas from Australia, Indonesia, and Brunei. As the trade war continues, it is unlikely that the US would be able to sell its natural gas to China anytime soon, and this will have an impact on the energy industry – one of Trump’s major political support bases.
Restricting minerals
Another huge problem that the US faces stems from China’s restriction of the export of critical minerals. They include seven rare earth minerals namely samarium, gadolinium, terbium, dysprosium, lutetium, scandium and yttrium. While these are used in the clean energy and automobile sectors, the biggest concern would come from the US defence complex.
The White House probably anticipated export restrictions of critical minerals from China. After all, Beijing had banned the export of critical minerals to Japan in 2010 over a fishing trawler dispute, and stopped exporting “dual-use” metals that can be used to produce civilian and military technology, such as gallium, germanium and tungsten.
What’s next?
For the last few years, China has been trying to overcome an ailing economy that was primarily fuelled by a real-estate crisis. Trump probably expected China to buckle under pressure and come crawling to the negotiation table. After all, the Chinese Communist Party needs to fix its economy fast. The establishment has long relied on delivering economic prosperity to legitimise its rule over China.
Right now the tit-for-tat battle continues. By April 11, US tariffs on China peaked at 145%, while China’s retaliatory tariffs on US goods reached an unprecedented 125%.
Although it is clearly fighting back, China could go even further by selling off US treasuries and increasing US interest rates and thus borrowing cost. But unlike Trump, Xi often plays the long game. After all, Trump’s term as president will be over in less than four years, while Chinese president Xi has no term limits. All the latter has to do is exercise patience, and a friendlier US president might come around.
The Trump administration is a serious threat to democracy. They’re also laughably incompetent. But the result is no laughing matter.
…
Clown-show fascism describes a regime marked simultaneously by hubristic and defiant assaults on the democratic and constitutional order on the one hand and, on the other, a nearly laughable incompetence in just about every other area of the regime’s activity. The first characteristic certainly applies to the Trump administration, and it’s chilling and frightening and not at all funny. Just ask Mahmoud Khalil.
Yet at the same time, in other areas, the incompetence has been staggering. Trump’s constant about-faces and walk backs on tariffs have been an international embarrassment. Elon Musk’s DOGE has fired federal workers willy-nilly only to turn around and rehire many after the Musketeers realized they weren’t deep-state bloodsuckers and the work they did was kind of essential, after all—you know, like the people who tend the country’s nuclear weapons stockpile.
It can be hilarious to watch. But it carries two consequences that are no laughing matter.
First and more obviously, we have the prospect of the impact of Trump’s tariffs policy on real people. Will they cause inflation and a recession, as most experts now believe? As fate would have it, Trump will go to bed the night of his 100th day in office—Tuesday—and wake up the very next morning to the release of the first-quarter GDP number. Economists expect anemic results. The Atlanta Fed even predicts negative growth, around -2.5 percent. During Trump’s first week in office, its forecast nudged a gaudy 4 percent, but the president’s actions have liberated that figure ever downward.
Second and more insidiously: Even the gross incompetencies take us into treacherous territory because they contribute to making this all about one man, the man who must be in front of the cameras every day. He doesn’t have policies so much as he has urges, which he must announce to the world on a constant basis in a desperate plea that we keep him front of mind at all times. Some of those urges are cruel; some of them are a joke. What unites them is that they make the story entirely about him.
That is not how it’s supposed to work in democracies. Which we still are, for now, as we reach this 100-day mark. Only 1,361 to go.
Neo-Fascist Climate Science Denier Donald Trump says Burn, Baby, Burn.Elon Musk urges you to be a Fascist like him, says that you can ignore facts and reality then.
Instead of allowing business as usual it should be disrupted – Neo-Fascist genocide supported by stronger Western nations including our own UK and continuing destruction of our climate and planet so that the uber-rich get uber-richer. In a sense you have to permit these activities without objecting. [7.40pm ed: I mean In a sense you permit these activities unless you object.] This is why I have respect and admiration for activists from groups like Just Stop Oil and Youth Demand!, that they’re not willing to permit the Fascism to continue without obstruction, without saying “I object!”.
Years ago I mused about using traffic to disrupt traffic. One of the worst places for cars to break down on the way to work on Mayday Thursday would be at junctions to and from motorways so don’t do that. Breakdowns are often ignition issues. Owners can often make breakdowns worse trying to fix them e.g. by undoing ignition or electrical connections and not remaking the connection properly after investigation. You could try this outside your home …
There is huge support for climate action – people have children of course who’s futures will be totally destroyed although it’s now really, not in the future. One of the best groups to oppose climate destruction by the rich may be school students. They have power if they acted collectively and opposed any attacks on any individuals. They’re also the ones most attacked by people destroying our planet and futures of course.
Neo-Fascist Climate Science Denier Donald Trump says Burn, Baby, Burn.Elon Musk urges you to be a Fascist like him, says that you can ignore facts and reality then.
Scientists have identified more than 25 parts of the Earth’s climate system that are likely to have “tipping points” – thresholds where a small additional change in global warming will cause them to irreversibly shift into a new state.
More recent research suggests that triggering one tipping element could cause subsequent changes in other tipping elements, potentially leading to a “tipping cascade”.
However, the interactions between individual tipping elements – and the ways they might trigger each other – remain largely underexplored.
In a review study, published last year in Earth System Dynamics, we unpack the current state of scientific understanding of the interactions between individual tipping elements.
We find that scientific literature suggests the majority of interactions between tipping elements will lead to further destabilisation of the climate system.
Existing research also indicates that “tipping cascades” could occur even under current global warming projections.
Scientific understanding of individual tipping elements is continuously improving, but more research on their interactions is needed.
An emerging field
The history of tipping elements as an object of investigation is relatively short. As a result, they are only partially accounted for in current climate models.
Since then, significant progress has been made on tipping element research.
For instance, the 2023 global tipping points report – co-authored by more than 200 researchers from 90 organisations in 26 countries – recognised that five “major” tipping elements – the Greenland and West Antarctic ice sheets, the warm-water coral reefs, the North Atlantic Subpolar Gyre and global permafrost regions – are already “at risk of being crossed due to warming”.
However, tipping elements have so far largely been studied in isolation. Most research has neglected the interactions between different tipping elements which could further destabilise the climate system – and eventually even lead to tipping cascades.
Tipping cascades
Interactions between tipping elements clearly exist.
For example, we find robust evidence that an influx of freshwater into the North Atlantic caused by the disintegration of the Greenland ice sheet would destabilise the AMOC and could trigger its slowdown. (This, in turn, could result in the ocean currents moving less heat from equatorial regions to higher latitudes, leading to significant cooling in Europe.)
In worst-case cascading scenarios, the tipping of one system directly leads to the tipping of another. In less dramatic cases, it only reinforces destabilisation of other systems.
So, what additional effects are to be expected from these interactions?
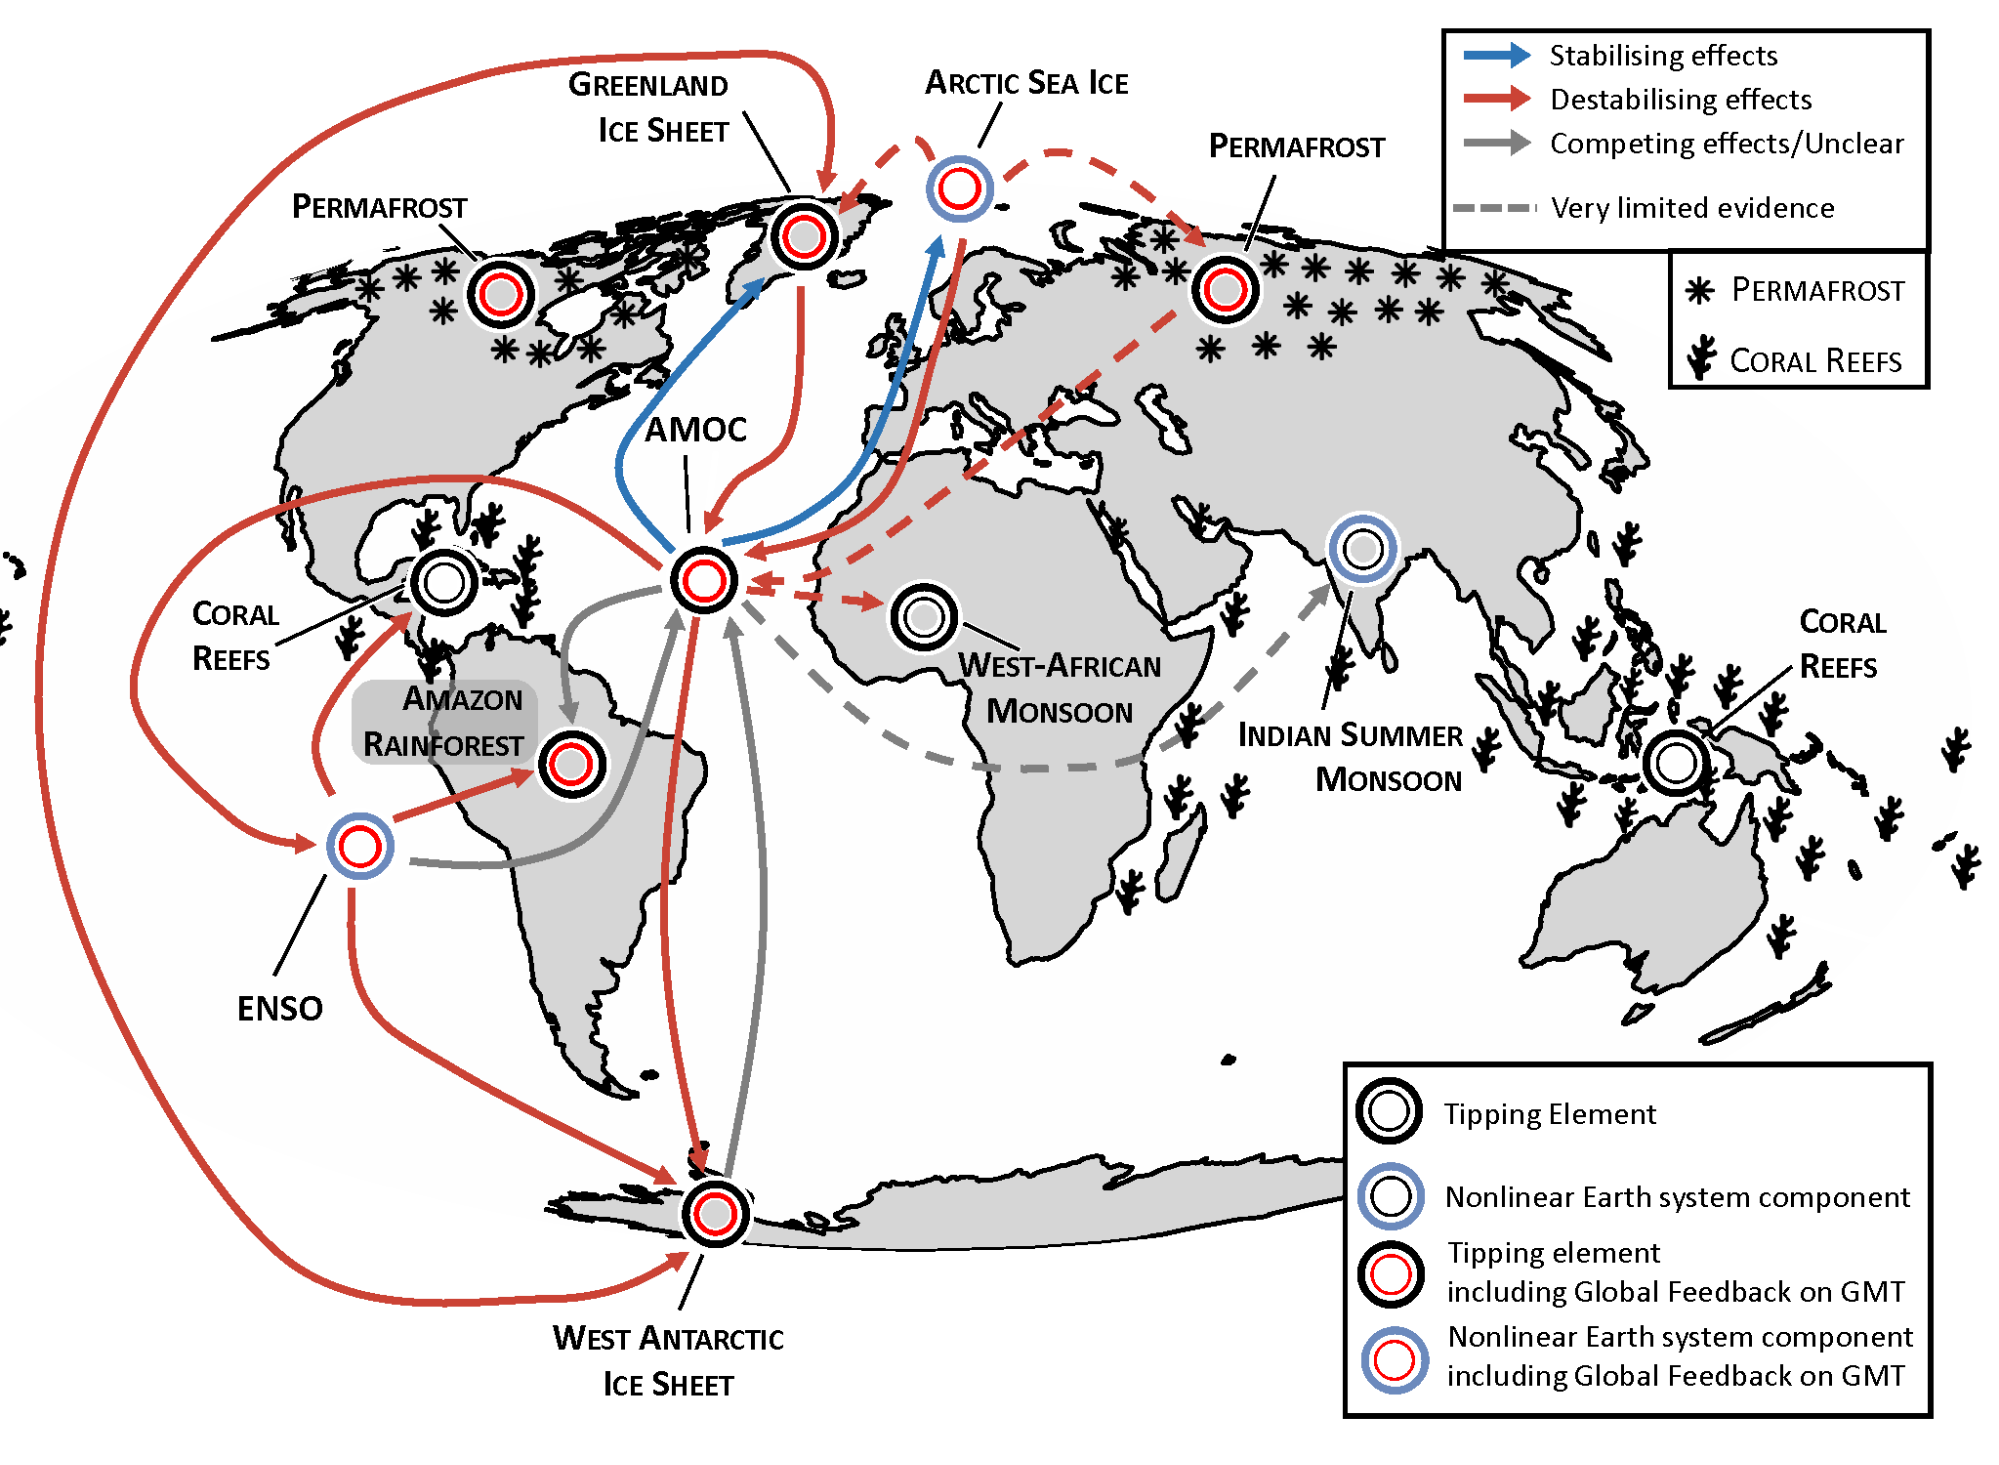
The map below shows how 13 out of 19 tipping element interactions analysed in our review study are expected to lead to further destabilisation. The arrows indicate destabilising (red), stabilising (blue) or competing (grey) effects, while the dashed lines show where there is only limited evidence for a connection.
A prominent example of a tipping point that leads to further destabilisation is the impact of changes to the AMOC. The weakening or collapse of the system of ocean currents may lead to accumulation of warm ocean water in the Southern Ocean, which could, in turn, contribute to a destabilisation of the West Antarctic ice sheet.
It has also been suggested that a weaker AMOC could promote El Niño events by increasing the temperature difference between the equator and the poles, which would strengthen trade winds. (While the El Niño-Southern Oscillation, or ENSO, is not a tipping element, it may play an important role as a propagator of disturbances.)
There are also a few examples – two out of 19 interactions – where a tipping point can help stabilise another system. For example, the weakening of AMOC could lead to an interrupted flow of warm water from equatorial to the polar Atlantic regions. This would drastically cool large parts of the polar region and could therefore stabilise the Greenland ice sheet.
Map of interactions between tipping elements. Stabilising effects are shown in blue, destabilising effects in red, and unclear effects in grey. Effects with very limited evidence are denoted by dashed lines. Credit: Wunderling et al. (2024)
A conceptual model
While scientists have gathered evidence for tipping points from observations, models and proxy data from the distant past, we still need more research to study interactions.
Our ongoing research aims to quantify the risk of tipping cascades using a conceptual computational model.
The model is “conceptual” in the sense that it is not grounded in physical or chemical processes, such as heat transfer or circulation patterns. Instead, a range of measurements – such as global average temperature, tipping temperature and temperature overshoot trajectory – serve as “modelling parameters” that can be varied to study a large range of possible scenarios.
To date, the model is limited to simulating the Amazon rainforest, the AMOC and the West Antarctic and Greenland ice sheets – tipping elements whose respective interactions are relatively well established.
However, using this model we can investigate – among other things – tipping risks under different so-called temperature “overshoot” scenarios.
This is where global warming peaks at a certain temperature level – for example, 2C – before declining to a lower long-term stabilisation temperature. (The subsequent decline is assumed to be the consequence of a global roll-out of negative-emission technologies, as assessed in several recentpublications.). The difference between the peak temperature and the long-term stabilisation temperature is the overshoot.
Evaluating millions of scenarios, our model calculates “tipping risks” for fixed combinations of a particular overshoot and stabilisation temperature.
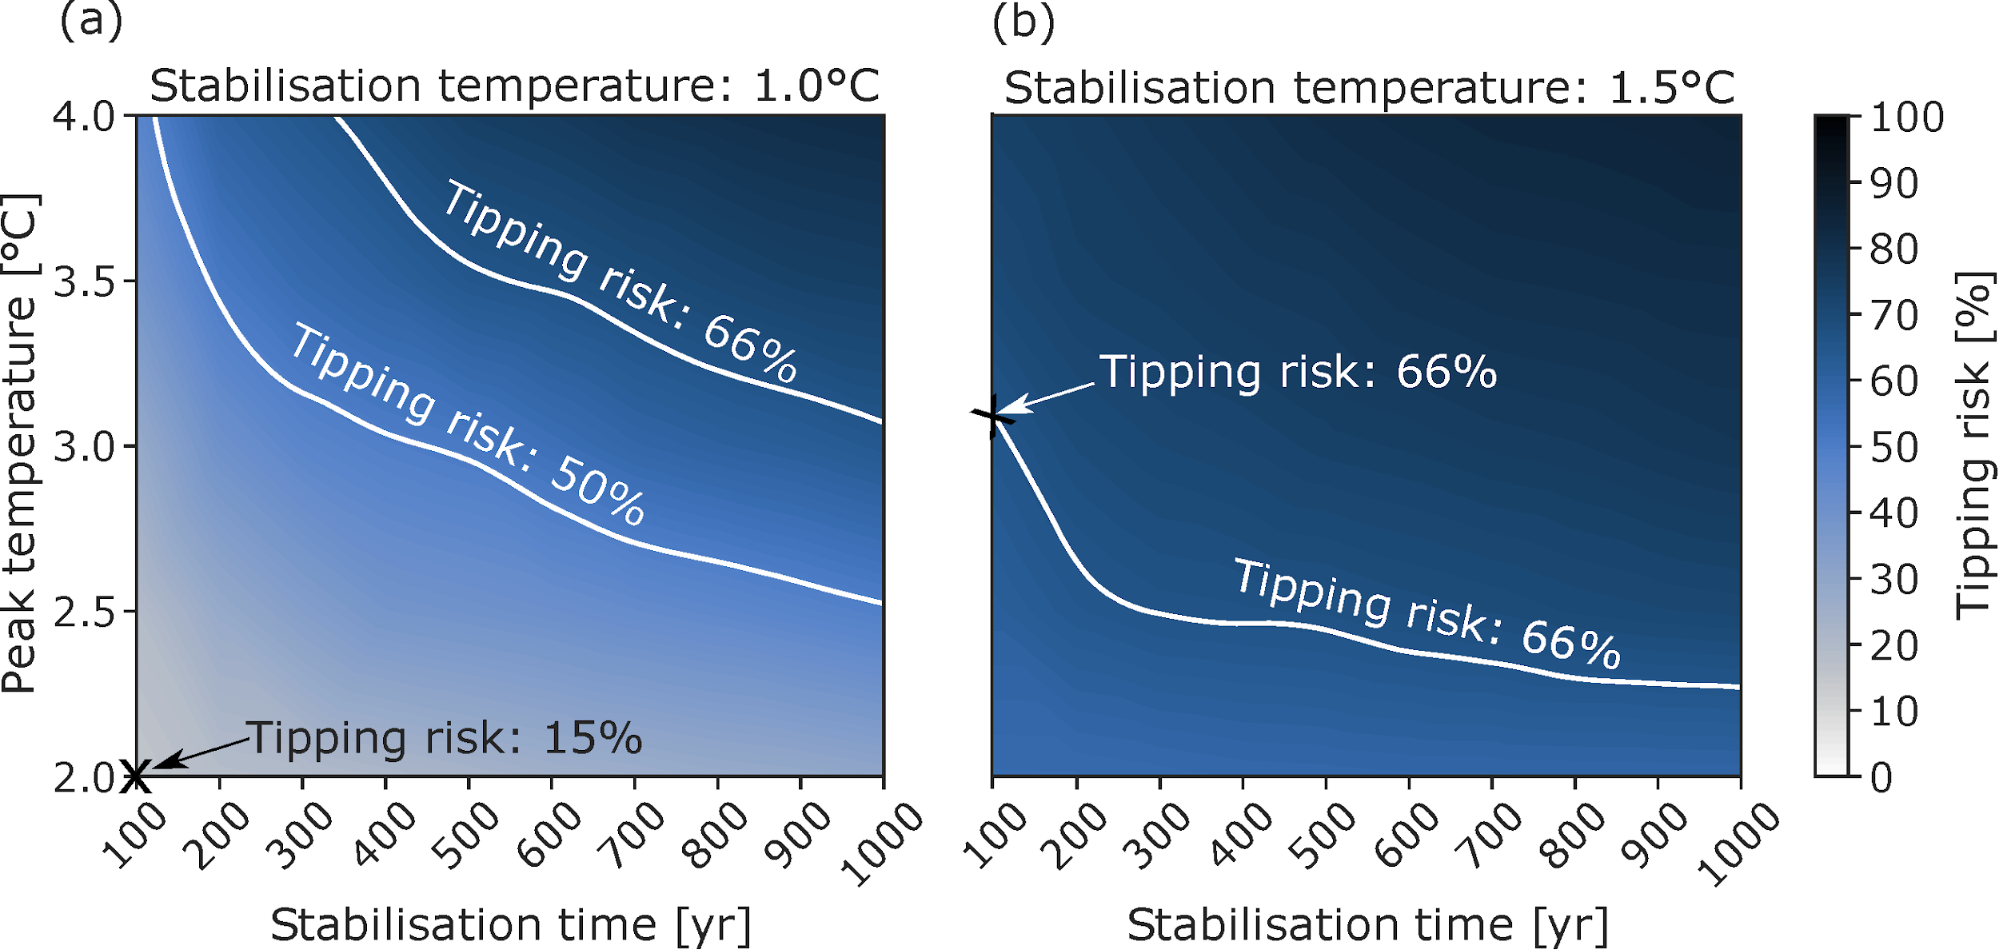
The main finding of the research is that long-term tipping risks are in the order of 15% if warming peaks at 2C and then stabilises at 1C.
In contrast, in a scenario where the peak warming reaches 3C and stabilises at 1.5C in the 22nd century, there is a 66% probability that at least one of the four modelled tipping elements would lose stability.
The figure below shows tipping risks where warming peaks at between 2C and 4C (“peak temperature” on y-axis) and takes 100-1,000 years to stabilise (“stabilisation time” on x-axis).
The figure on the left shows tipping probabilities where temperatures eventually stabilise at 1C and the figure on the right where temperatures settle at 1.5C. Darker colours represent higher tipping risks.
The figure shows how tipping risks increase with higher peak and stabilisation temperatures, as well as with longer stabilisation times.
Tipping risks under global warming overshoots for peak temperatures (between 2C and 4C) and overshoot durations (stabilisation time of 100 to 1,000 years) for stabilisation temperatures of 1C (left), and 1.5C (right). Credit: Adapted by the authors from figure 3 in Wunderling et al. (2023)
While solidly calculated and based on recent scientific literature, our results can not count as projections of future climate due to the conceptual nature of our underlying model.
Nevertheless, the findings are useful and complement findings from traditional climate models, known as General Circulation Models (GCMs).
GCMs have only started to fully address the dynamics of tipping elements and their interactions. For example, most do not yet feature fully interactive ice-sheet dynamics, nor their interactions with global oceans.
In a paper published last November, we used our conceptual model to show that neglecting interactions between the Greenland ice sheet and the AMOC can alter the expected number of tipped elements by more than a factor of two.
In addition, the high cost of running GCMs means researchers cannot run large “ensembles” of multiple model simulations to account for uncertainties in knowledge of key parameters. Our simplified conceptual model, on the other hand, can account for this uncertainty.
By drastically reducing physical complexity, we are able to compute several million – and up to a billion – ensemble members in large-scale Monte Carlo simulations.
Historical tipping events
While our results need to be confirmed by more complex Earth system models, such as GCMs, they hint at the need for scientists to examine interactions between tipping elements and potential tipping cascades more closely.
The study of abrupt climate changes of the distant and not-so-distant past is critical to convince researchers of the existence and significant impact of tipping cascades.
A potential candidate for investigation is the Eocene–Oligocene transition. This took place roughly 34m years ago and led to the formation of a continent-scale ice sheet on Antarctica which buried the region’s forests.
The transition likely involved the interaction of several tipping elements, including global deep-water formation, the Antarctic ice sheet, polar sea ice, monsoon systems and tropical forests. The monsoon-like climate of the Antarctic content at the end of the Eocene would have had to change drastically – or tip – to allow for glaciation during the transition to the Oligocene.
Since the events at that time were also linked to a major loss of mammal species, mostly in Europe, the Eocene–Oligocene transition might even have involved a climate-ecology tipping cascade.
Heinrich events, which took place in the last ice age – around 120,000 to 11,500 years ago – as well as the mid-Holocene, could also be especially revealing around what we can expect in the near future.
These events, which involved the release of icebergs into the North Atlantic, resulted in a fresh water inflow that substantially weakened the AMOC. This, in turn, led to the drying of northern Amazonia and the retreat of the rainforest. Today’s melting of the Greenland ice sheet could have similar consequences for the AMOC.
While these climate changes in the past happened through natural drivers, humans are potentially forcing these rapid changes now in the modern era through emissions of carbon dioxide, possibly on a much faster timescale.
Updated climate models
The science of interacting tipping elements and tipping cascades is in its early stages – and there is significant debate within the scientific community on the topic.
Some consider a global reorganisation of the climate system induced by tipping elements and cascades to be speculative, given that recent observations are not available and proxy data is scarce.
Additionally, there is scientific uncertainty of how tipping processes may play out across different spatial scales, as well as how to increase the resilience of tipping elements against perturbations.
Therefore, significant work is underway to investigate tipping processes in complex Earth system models. The Tipping Points Model Intercomparison Project (TIPMIP) and European Union-funded projects ClimTIP or TipESM are among a raft of such initiatives.
Although these initiatives are largely looking at tipping elements in isolation, they will also shed more light on the interactions between these important parameters of the Earth’s climate system stability.
Neo-Fascist Climate Science Denier Donald Trump says Burn, Baby, Burn.Elon Musk urges you to be a Fascist like him, says that you can ignore facts and reality then.
Global temperatures in the first quarter of 2025 were the second warmest on record, extending a remarkable run of exceptional warmth that began in July 2023.
This is despite weak La Niña conditions during the first two months of the year – which typically result in cooler temperatures.
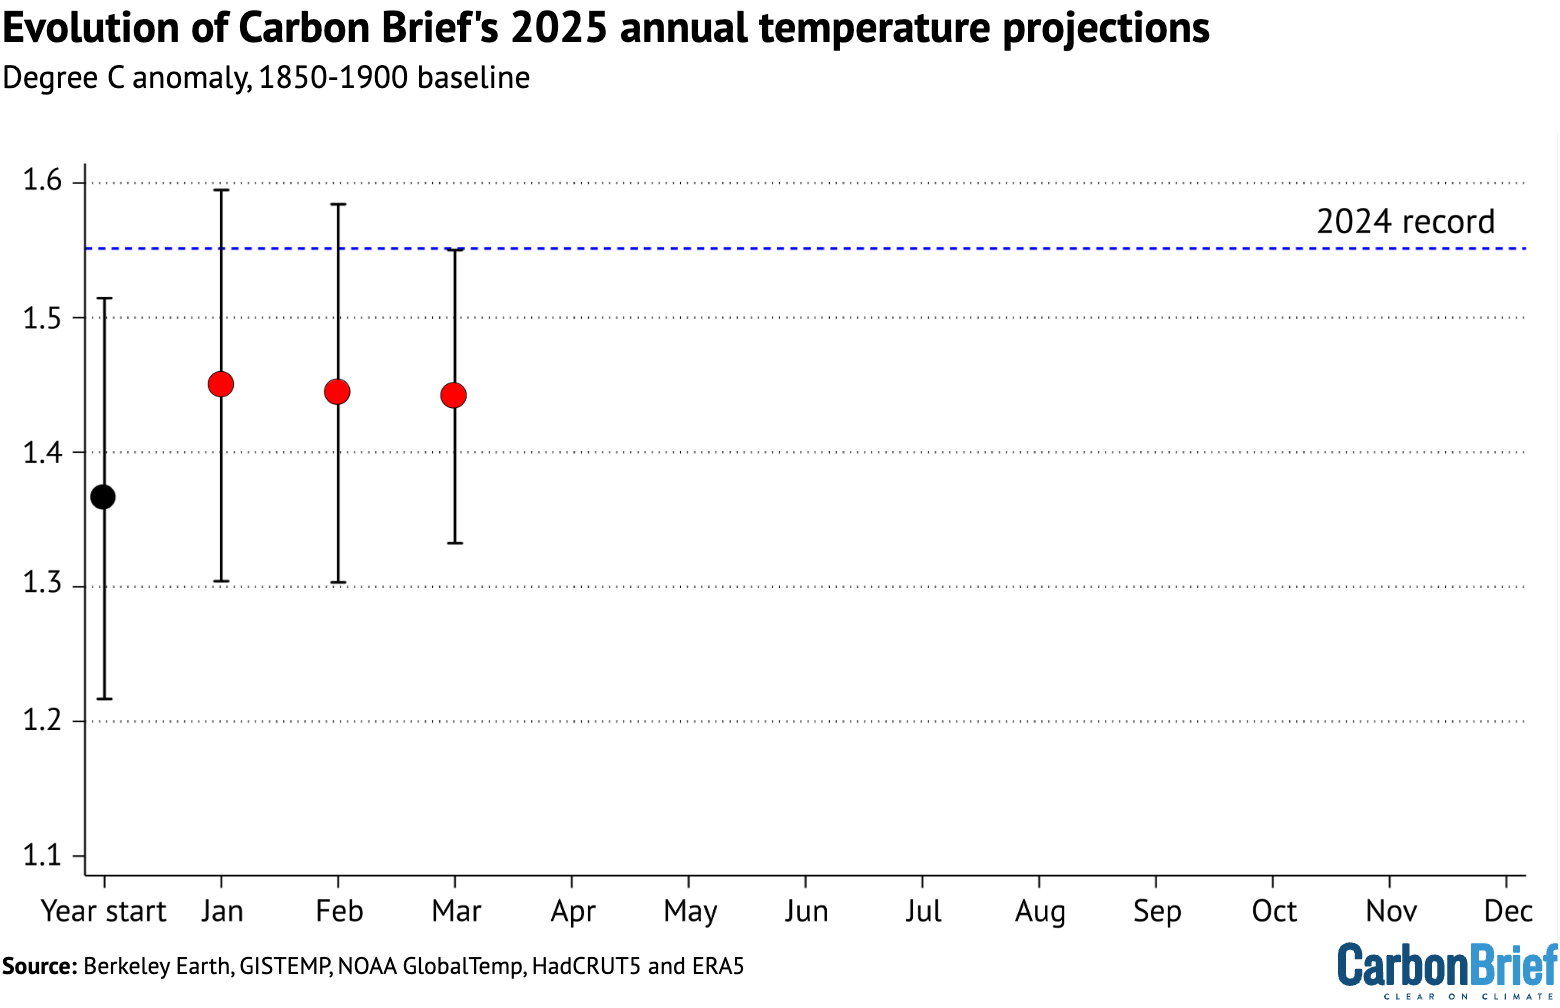
With temperature data for the first three months of the year now available, Carbon Brief finds that 2025 is very likely to be one of the three warmest years on record.
However, it currently remains unlikely that temperatures in 2025 will set a new annual record.
In addition to near-record warmth, the start of 2025 has seen record-low sea ice cover in the Arctic between January and March – and the second-lowest minimum sea ice extent on record for Antarctica.
The figure below shows the annual temperatures from each of these groups since 1970, along with the average over the first three months of 2025.
(It is worth noting that the first three months may not be representative of the year as a whole, as greater historical warming rates mean that temperatures relative to pre-industrial levels tend to be larger in the northern hemispheric winter months of December, January and February.)https://interactive.carbonbrief.org/state-of-the-climate/2025-04/records-with-2024-to-date.htmlAnnual global average surface temperatures from NASA GISTEMP, NOAA GlobalTemp, Hadley/UEA HadCRUT5, Berkeley Earth and Copernicus/ECMWF (lines), along with 2025 temperatures so far (January-March, coloured dots). Anomalies plotted with respect to the 1981-2010 period, and shown relative to pre-industrial based on the average pre-industrial temperatures in the Hadley/UEA, NOAA and Berkeley datasets that extend back to 1850. Chart by Carbon Brief.
Starting with this state of the climate update, Carbon Brief will be showing a World Meteorological Organization (WMO) aggregate of the five surface temperature records, rather than highlighting any particular one, reflecting a single best-estimate across the different groups.
The WMO aggregate is calculated by averaging the different records using a common 1981-2010 baseline period, before adding in the average warming since the pre-industrial period (1850-1900) across the datasets – NOAA, Hadley, and Berkeley – that extend back to 1850.
The figure below shows how global temperature so far in 2025 (black line) compares to each month in different years since 1940 (with lines coloured by the decade in which they occurred) in the WMO aggregate of surface temperature dataset.https://interactive.carbonbrief.org/state-of-the-climate/2025-04/monthly-global-temp-anomalies.htmlTemperatures for each month from 1940 to 2025 from the WMO aggregate of temperature records. Anomalies plotted with respect to a 1850-1900 baseline. Chart by Carbon Brief.
The first three months of 2025 have been unusually warm, coming in in the top-three warmest on record across all the different scientific groups that report on global surface temperatures. This is despite the presence of moderate La Niña conditions in the tropical Pacific, which typically suppress global temperatures.
January 2025 was the warmest January on record in the WMO aggregate, February was the third warmest and March was tied with 2016 as the second warmest.
When combined, the first three months of the year in 2025 were the second-warmest Q1 period in the historical record, just 0.035C below the record set in 2024 after the peak of a strong El Niño event, as shown in the figure below.https://interactive.carbonbrief.org/state-of-the-climate/2025-04/Q1-temp-plot.htmlQ1 temperature anomalies from 1850 through 2025 from the WMO aggregate of temperature records. Anomalies plotted with respect to a 1850-1900 baseline. Chart by Carbon Brief.
The persistence of warmth after the end of the 2023-24 El Niño event – and through a weak La Niña – has been highly unusual by historical standards. In most prior cases, global temperatures returned closer to the long-term temperature trend following the return to neutral El Niño Southern Oscillation (ENSO) conditions in the tropical Pacific.
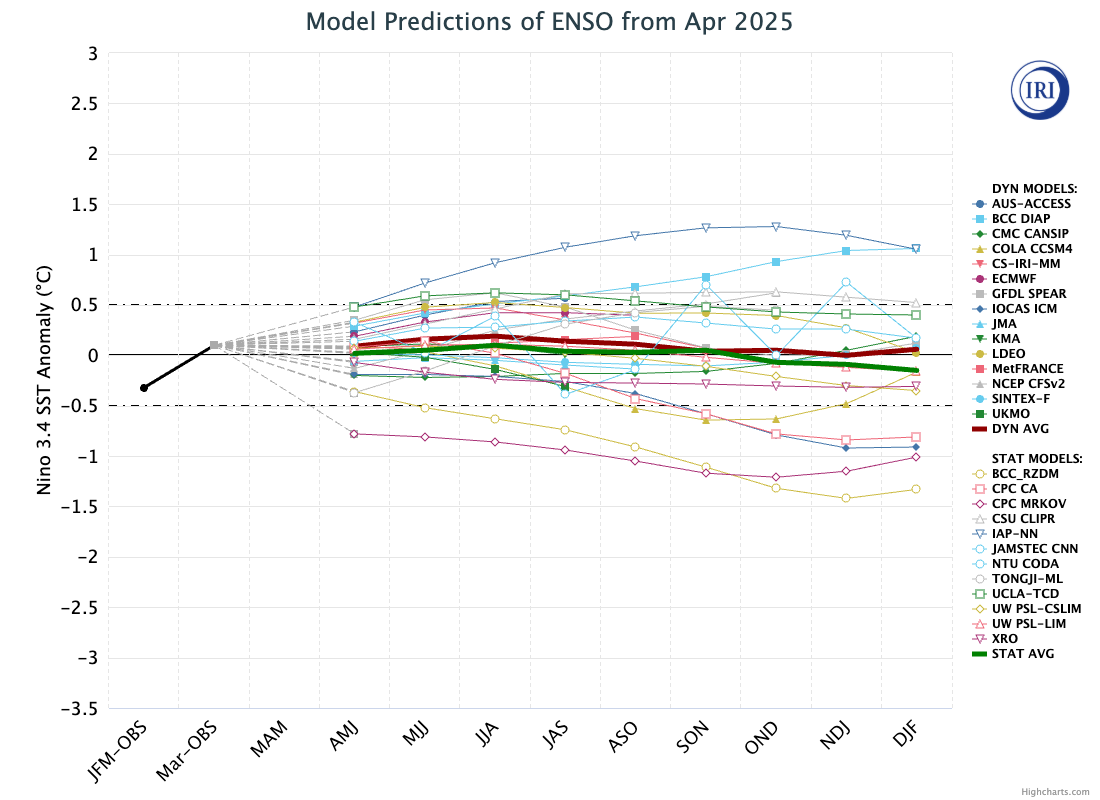
Weak La Niña conditions have faded over the past month, with ENSO-neutral conditions returning and expected to persist for most models through the remainder of the year. However, predictions of ENSO status are particularly uncertain at this time of year due to a phenomenon known as the “spring predictability barrier”.
The figure below shows a range of different forecast models for the ENSO for the rest of this year, produced by different scientific groups. The values shown are sea surface temperature variations in the tropical Pacific – known as the El Niño 3.4 region – for overlapping three-month periods.
By looking at the relationship between the first three months and the annual temperatures for every year since 1970 – as well as ENSO conditions for the first three months of the year and the projected development of El Niño conditions for the remaining nine months – Carbon Brief has created a projection of what the final global average temperature for 2025 will likely be.
The analysis includes the estimated uncertainty in 2025 outcomes, given that temperatures from only the first quarter of the year are available so far.
The chart below shows the expected range of 2025 temperatures using the WMO aggregate – including a best-estimate (red) and year-to-date value (yellow). Temperatures are shown with respect to the pre-industrial baseline period (1850-1900).https://interactive.carbonbrief.org/state-of-the-climate/2025-04/Q1-2025-estimate.htmlAnnual global average surface temperature anomalies from the WMO aggregate plotted with respect to a 1850-1900 baseline. To-date 2025 values include January-March. The estimated 2025 annual value is based on the relationship between the January-March temperatures and annual temperatures between 1970 and 2024. Chart by Carbon Brief.
Carbon Brief’s projection suggests that 2025 is virtually certain to be one of the top-three warmest years, with a best-estimate approximately equal to global temperatures in 2023.
However, this model assumes that 2025 follows the type of climate patterns seen in the past – patterns that were notably broken in 2023 – and to a lesser extent in 2024. Other recent estimates – such as one published by Berkeley Earth – give a higher probability of around 34% that 2025 will set a new temperature record.
The figure below shows Carbon Brief’s estimate of 2025 temperatures using the WMO aggregate, both at the beginning of the year and once each month’s data has come in. The estimate jumped notably after t2025 saw the warmest January on record, but has been relatively stable over the past three months.
Carbon Brief’s projection of global temperatures based on the WMO aggregate at the start of the year, and after January, February, and March global surface temperature data became available. Chart by Carbon Brief.
Record-low Antarctic and Arctic sea ice
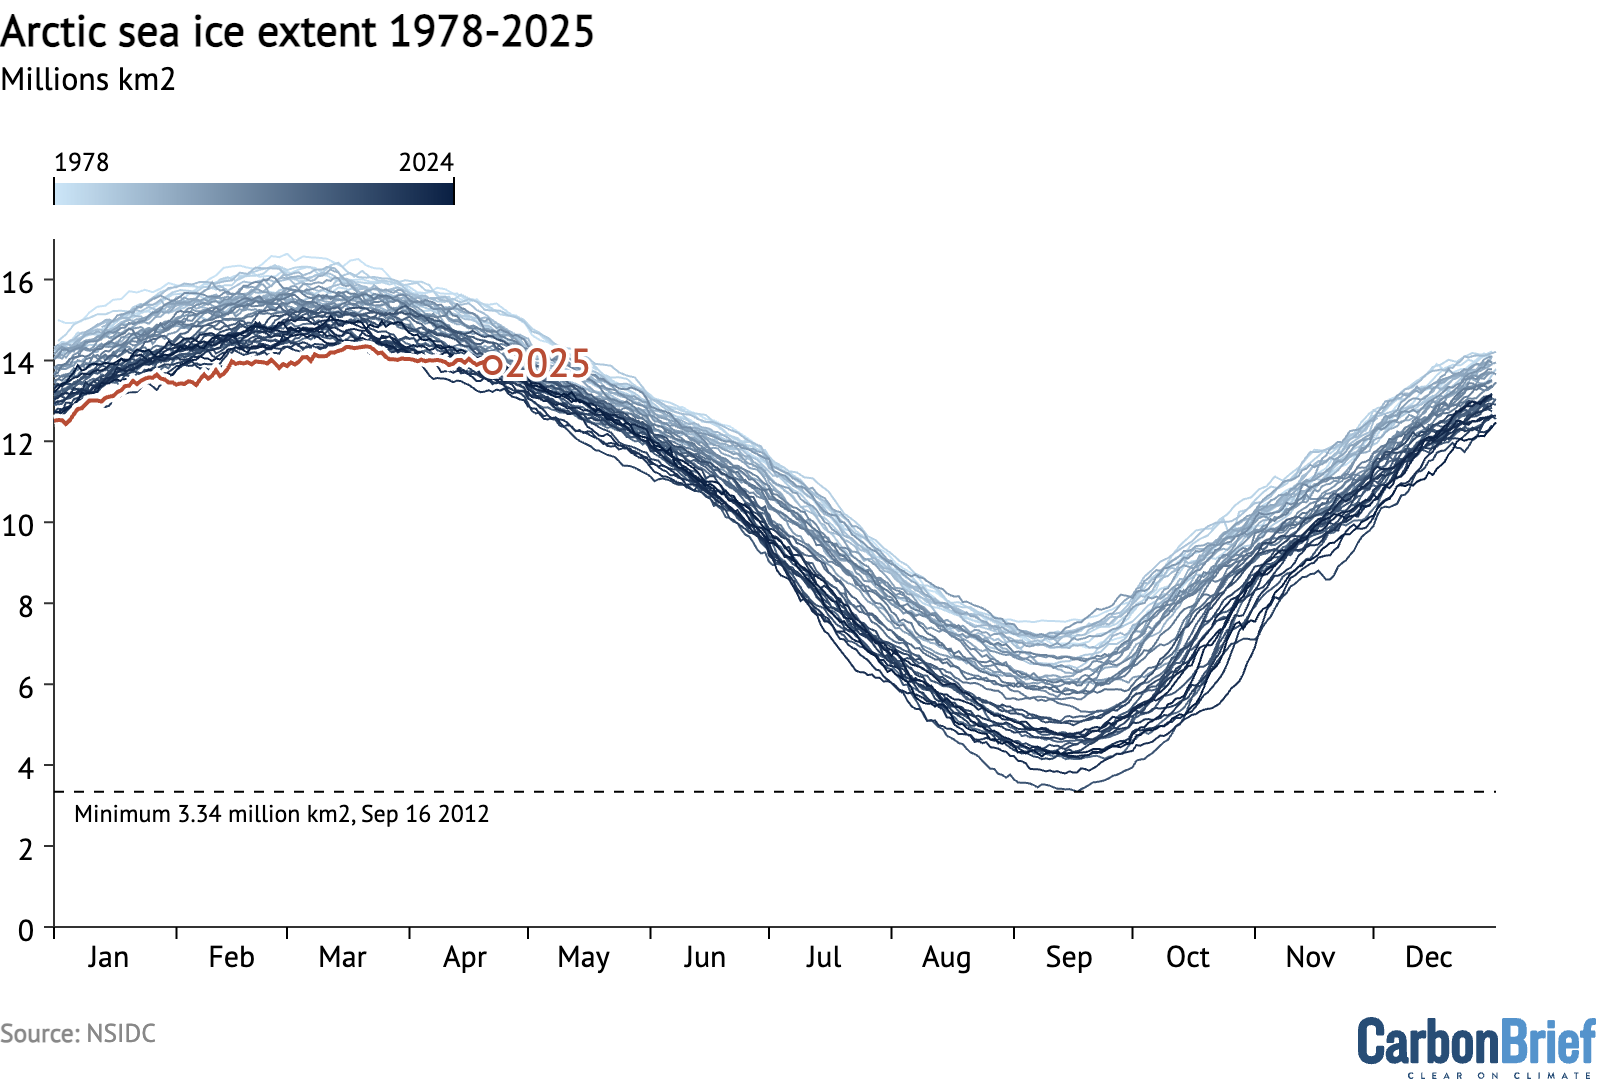
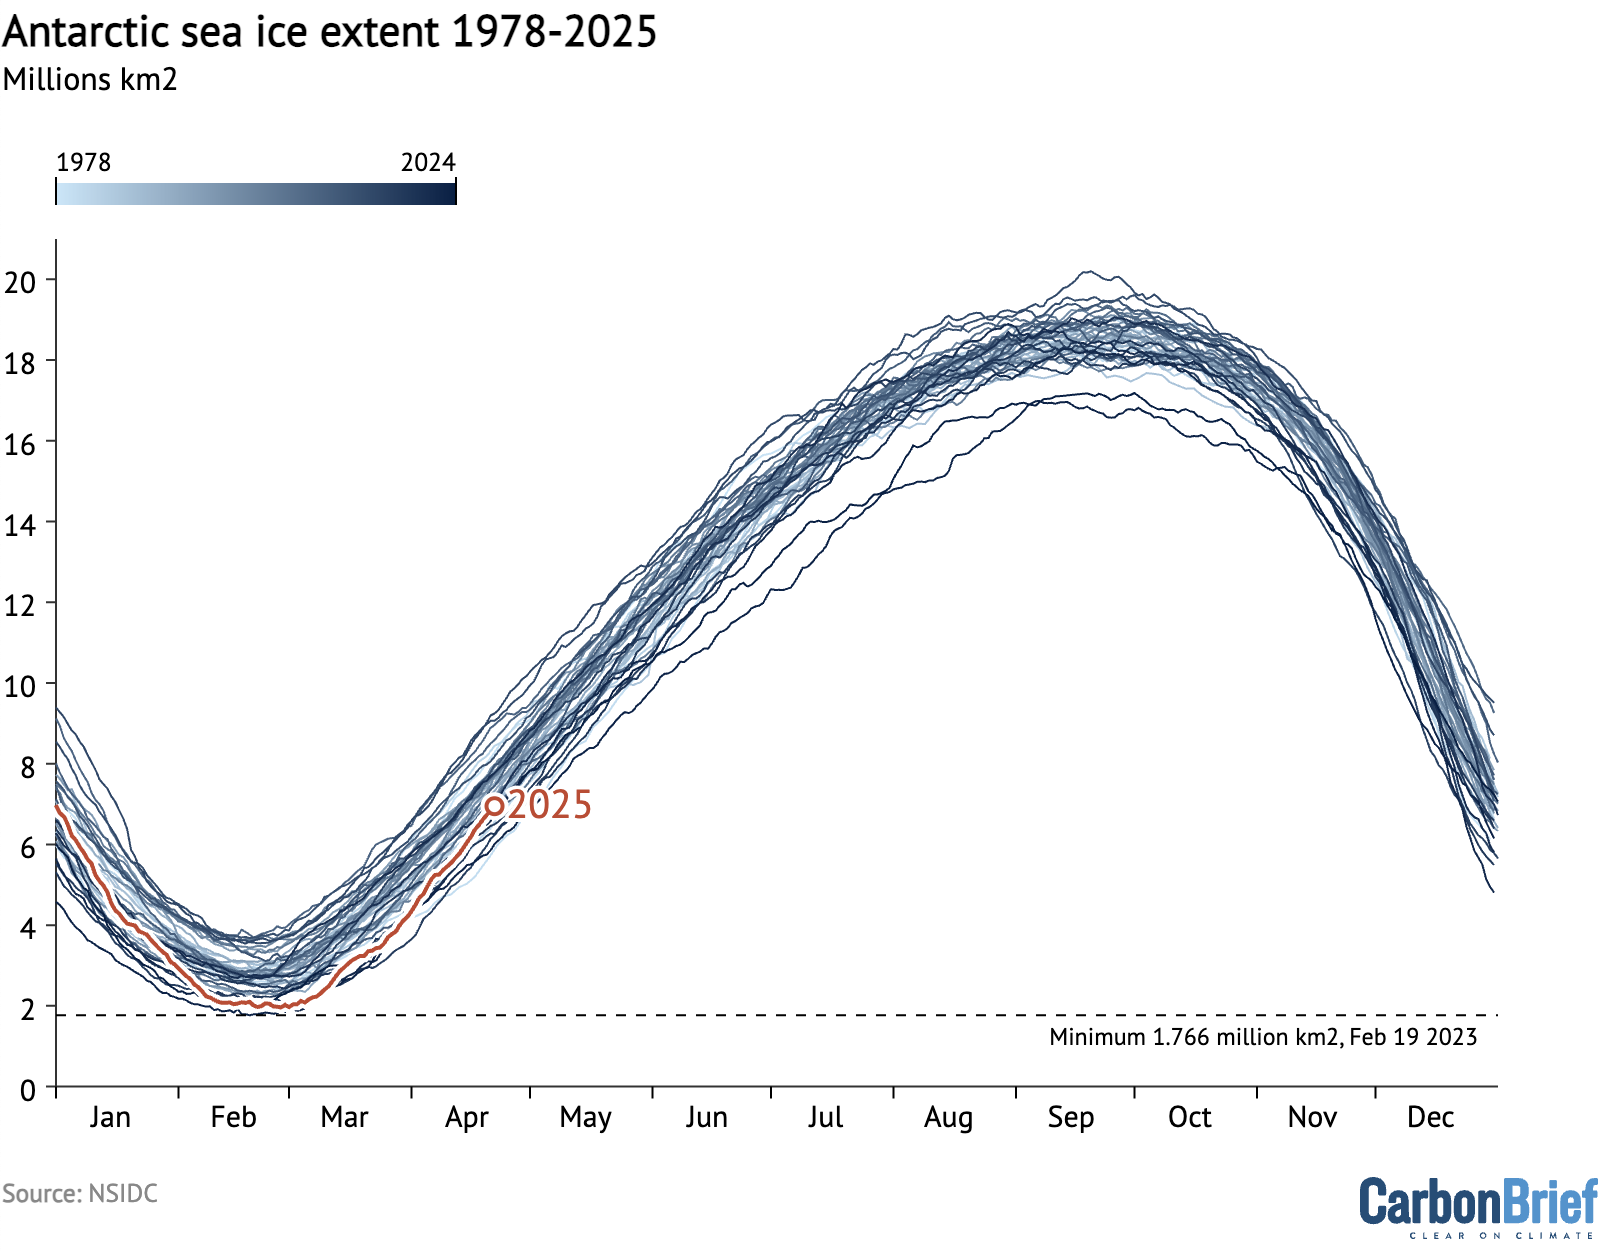
Both Arctic and Antarctic sea ice extent spent much of early 2025 at record, or near-record, lows.
The figure below shows both Arctic and Antarctic sea ice extent in 2025 (solid red and blue lines), the historical range in the record between 1979 and 2010 (shaded areas) and the record lows (dotted black line).
(Unlike global temperature records, which only report monthly averages, sea ice data is collected and updated on a daily basis, allowing sea ice extent to be viewed up to the present.)https://interactive.carbonbrief.org/state-of-the-climate/2025-04/sea-ice-graph.htmlArctic and Antarctic daily sea ice extent from the US National Snow and Ice Data Center (NSIDC). The bold lines show daily 2025 values, the shaded area indicates the two standard deviation range in historical values between 1979 and 2010. The dotted black lines show the record lows for each pole. Chart by Carbon Brief.
Arctic sea ice saw a new record low nearly each day between January and March, recording a record-low winter peak extent in late March. Ice extent subsequently moved out of record-low territory in April.
It is worth noting that, as northern hemisphere winter conditions remain cold enough to refreeze sea ice, there tends to be less variability in extent year-to-year in the winter than in the summer, as the chart below illustrates.
Antarctic sea ice started the year within the historical range (1979-2010), before plunging to tie for the second-lowest minimum on record in late February. It has since recovered in April, and is currently on the low end of the historical range.
dizzy: Trump is attempting to censor research and information like this.
Neo-Fascist Climate Science Denier Donald Trump says Burn, Baby, Burn.Elon Musk urges you to be a Fascist like him, says that you can ignore facts and reality then.Orcas discuss Donald Trump and the killer apes’ concept of democracy. Front Orca warns that Trump is crashing his country’s economy and that everything he does he does for the fantastically wealthy.