Matthew Chattle/Future Publishing via Getty Images
The UK’s broken justice system is locking young activists like me away – and we’ll all suffer the consequences
My name’s Ella. I am a fairly average 22-year-old from Birmingham, central England. I have friends, a supportive family, and hopes and dreams for after graduation. I’m also facing up to ten years in prison.
On 5 August last year, I was arrested along with three others on a side street in Gatley, near Manchester, just after 4am. We had been planning to enter Manchester Airport’s airfield – provided it was safe to do so – to block the taxiway by glueing our hands to the tarmac.
We didn’t get near the airport, but I have been held in HMP Styal, a women’s prison just outside Manchester, ever since. I was charged with conspiracy to cause a public nuisance and spent six months in prison awaiting trial. I was found guilty in February and will have served three months by the time I am sentenced at the end of this month.
So what drives a young person like me to take nonviolent action as drastic as this? You may have realised that I am a member of Just Stop Oil. At the time of my arrest, I was carrying boltcutters, glue, a hi-vis jacket, and a banner reading ‘sign the treaty’ in all caps.
It was the summer of 2024, the hottest year ever recorded. We were trying to send a message to the British government: it must sign the Fossil Fuel Non-Proliferation Treaty and make an immediate plan to transition away from oil, gas and coal to prevent further global heating, climate breakdown, and eventual societal collapse.
We wanted to go to an airport – a symbol of the carbon economy – to make clear that the UK’s ‘business as usual’ approach is sending humanity over a cliff edge into destruction, displacement, and massive loss of life.
Our protest may have seemed drastic, but as I tried to explain to the judge and the jury, it was proportionate to the scale of the crisis we are facing. We all stand to lose everything.
Until my arrest, I was a final-year environmental science student at the University of Leeds. As I told the court, the science is clear: burning and extracting fossil fuels is heating the planet and leading to mass crop failure, with food insecurity and starvation for large parts of the world and drastic price hikes on staples for the rest of us. Crop failure on this scale will kill millions and displace many more. A billion people could be on the move within 25 years. The impacts will be felt everywhere, by everyone.
I spoke about my university lecturers, who are prominent climate scientists and are fearful for their children’s lives. They feel they aren’t being listened to, that the government is implementing policies contrary to science. I said that the knowledge I had gained from studying gave me a responsibility to act.
Court trials like mine are remarkably technical – you must submit a legal defence if you want the judge to allow jurors to consider your motivation, or the context of your actions. I did not have a lawyer and, like my co-defendants, put forward a defence of ‘self-defence’ and ‘necessity’.
I argued that I acted not only to protect the lives of the millions already living on the frontline of climate breakdown, but in defence of myself and young people globally. I told the court how I am afraid for my own future, the future of my brother, my friends, my cousins, and all young people everywhere.
The judge dismissed this, saying the climate crisis does not pose an ‘immediate threat to life’. He told jurors to ignore the context around our actions and focus only on whether we had planned to commit a ‘crime’, saying that anything they’d heard about climate change during the hearing was irrelevant as it was a political or philosophical belief.
But the climate crisis is not a belief, it is science, and science doesn’t care about legal defences, judges’ rulings or prison sentences. It will continue to worsen and take more lives until governments work together to stop burning fossil fuels.
Conservative ministers loudly championed free speech – right up until they outlawed it. Now, we’re all at risk
Over the past six months in prison, this truth has become clearer and clearer. Climate breakdown is no longer something I read about in textbooks, study in lectures, or write about in exams. I’m seeing it through the bars of my cell window.
On New Year’s Day, a state of emergency was declared as Greater Manchester was hit by heavy rains. Over a thousand people were evacuated from flooded homes – HMP Styal’s prison officers among them – their possessions ruined, and huge disruption caused.
The rising waters cut off the roads leading to the prison, causing a staffing crisis that compromised our safety, with no one allowed to leave their wings or houses. The prison’s library and workplaces were flooded, ruining books and leaving some prisoners with no work or activities even after the regime returned to normal.
Such extreme weather is being seen everywhere. On the penultimate day of my hearing, 14 people were killed in floods in the US state of Kentucky, including a seven-year-old girl and her mother, who were washed away in their car. I used my closing speech to tell jurors about this, about how upset it made me. How many people will die before we open our eyes?
The judge ruled it irrelevant.
Having been barred from considering almost everything we’d said, the jury had little choice but to find us guilty. I am grateful to all twelve of them, though, for listening to what we had to say for three weeks and making the only decision they could within the constraints given.
Despite the guilty verdict, being in prison and my impending sentencing, I am at peace. I should have had my whole life ahead of me, and my future now hangs in the balance, but I know that I acted in line with my conscience and moral convictions and, above all, nonviolently: without violence and actively against violence.
Being on trial at a crown court in my early twenties was the scariest thing I’ve ever done. But what choice did I have? At university, I studied the truth, and now I have to act on it.
Orcas discuss Donald Trump and the killer apes’ concept of democracy. Front Orca warns that Trump is crashing his country’s economy and that everything he does he does for the fantastically wealthy.Neo-Fascist Climate Science Denier Donald Trump says Burn, Baby, Burn.Elon Musk urges you to be a Fascist like him, says that you can ignore facts and reality then.
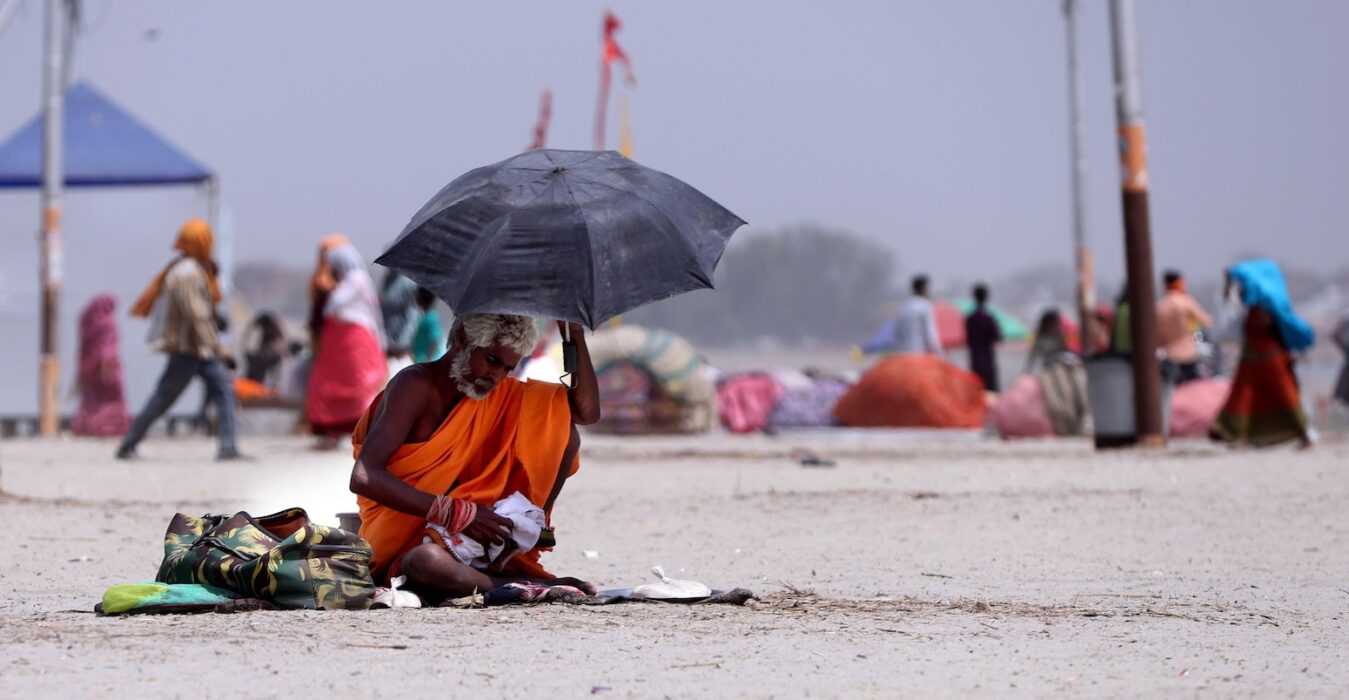
Global temperatures in the first quarter of 2025 were the second warmest on record, extending a remarkable run of exceptional warmth that began in July 2023.
This is despite weak La Niña conditions during the first two months of the year – which typically result in cooler temperatures.
With temperature data for the first three months of the year now available, Carbon Brief finds that 2025 is very likely to be one of the three warmest years on record.
However, it currently remains unlikely that temperatures in 2025 will set a new annual record.
In addition to near-record warmth, the start of 2025 has seen record-low sea ice cover in the Arctic between January and March – and the second-lowest minimum sea ice extent on record for Antarctica.
The figure below shows the annual temperatures from each of these groups since 1970, along with the average over the first three months of 2025.
(It is worth noting that the first three months may not be representative of the year as a whole, as greater historical warming rates mean that temperatures relative to pre-industrial levels tend to be larger in the northern hemispheric winter months of December, January and February.)https://interactive.carbonbrief.org/state-of-the-climate/2025-04/records-with-2024-to-date.htmlAnnual global average surface temperatures from NASA GISTEMP, NOAA GlobalTemp, Hadley/UEA HadCRUT5, Berkeley Earth and Copernicus/ECMWF (lines), along with 2025 temperatures so far (January-March, coloured dots). Anomalies plotted with respect to the 1981-2010 period, and shown relative to pre-industrial based on the average pre-industrial temperatures in the Hadley/UEA, NOAA and Berkeley datasets that extend back to 1850. Chart by Carbon Brief.
Starting with this state of the climate update, Carbon Brief will be showing a World Meteorological Organization (WMO) aggregate of the five surface temperature records, rather than highlighting any particular one, reflecting a single best-estimate across the different groups.
The WMO aggregate is calculated by averaging the different records using a common 1981-2010 baseline period, before adding in the average warming since the pre-industrial period (1850-1900) across the datasets – NOAA, Hadley, and Berkeley – that extend back to 1850.
The figure below shows how global temperature so far in 2025 (black line) compares to each month in different years since 1940 (with lines coloured by the decade in which they occurred) in the WMO aggregate of surface temperature dataset.https://interactive.carbonbrief.org/state-of-the-climate/2025-04/monthly-global-temp-anomalies.htmlTemperatures for each month from 1940 to 2025 from the WMO aggregate of temperature records. Anomalies plotted with respect to a 1850-1900 baseline. Chart by Carbon Brief.
The first three months of 2025 have been unusually warm, coming in in the top-three warmest on record across all the different scientific groups that report on global surface temperatures. This is despite the presence of moderate La Niña conditions in the tropical Pacific, which typically suppress global temperatures.
January 2025 was the warmest January on record in the WMO aggregate, February was the third warmest and March was tied with 2016 as the second warmest.
When combined, the first three months of the year in 2025 were the second-warmest Q1 period in the historical record, just 0.035C below the record set in 2024 after the peak of a strong El Niño event, as shown in the figure below.https://interactive.carbonbrief.org/state-of-the-climate/2025-04/Q1-temp-plot.htmlQ1 temperature anomalies from 1850 through 2025 from the WMO aggregate of temperature records. Anomalies plotted with respect to a 1850-1900 baseline. Chart by Carbon Brief.
The persistence of warmth after the end of the 2023-24 El Niño event – and through a weak La Niña – has been highly unusual by historical standards. In most prior cases, global temperatures returned closer to the long-term temperature trend following the return to neutral El Niño Southern Oscillation (ENSO) conditions in the tropical Pacific.
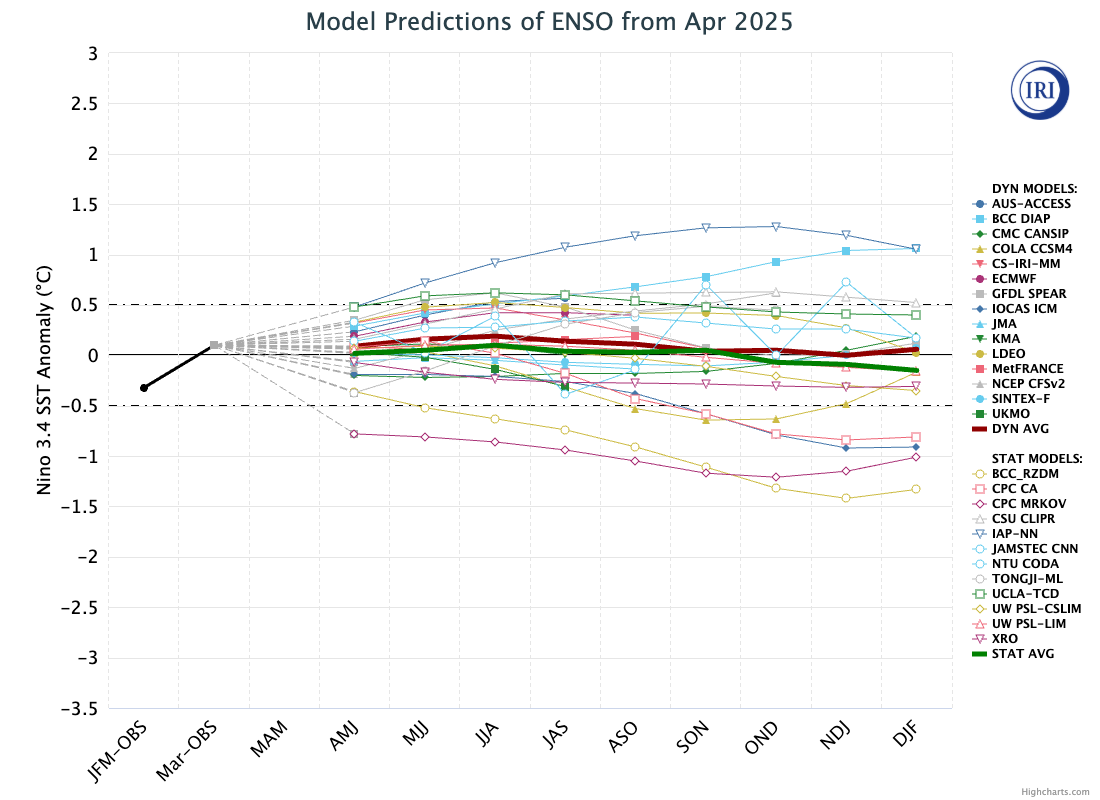
Weak La Niña conditions have faded over the past month, with ENSO-neutral conditions returning and expected to persist for most models through the remainder of the year. However, predictions of ENSO status are particularly uncertain at this time of year due to a phenomenon known as the “spring predictability barrier”.
The figure below shows a range of different forecast models for the ENSO for the rest of this year, produced by different scientific groups. The values shown are sea surface temperature variations in the tropical Pacific – known as the El Niño 3.4 region – for overlapping three-month periods.
By looking at the relationship between the first three months and the annual temperatures for every year since 1970 – as well as ENSO conditions for the first three months of the year and the projected development of El Niño conditions for the remaining nine months – Carbon Brief has created a projection of what the final global average temperature for 2025 will likely be.
The analysis includes the estimated uncertainty in 2025 outcomes, given that temperatures from only the first quarter of the year are available so far.
The chart below shows the expected range of 2025 temperatures using the WMO aggregate – including a best-estimate (red) and year-to-date value (yellow). Temperatures are shown with respect to the pre-industrial baseline period (1850-1900).https://interactive.carbonbrief.org/state-of-the-climate/2025-04/Q1-2025-estimate.htmlAnnual global average surface temperature anomalies from the WMO aggregate plotted with respect to a 1850-1900 baseline. To-date 2025 values include January-March. The estimated 2025 annual value is based on the relationship between the January-March temperatures and annual temperatures between 1970 and 2024. Chart by Carbon Brief.
Carbon Brief’s projection suggests that 2025 is virtually certain to be one of the top-three warmest years, with a best-estimate approximately equal to global temperatures in 2023.
However, this model assumes that 2025 follows the type of climate patterns seen in the past – patterns that were notably broken in 2023 – and to a lesser extent in 2024. Other recent estimates – such as one published by Berkeley Earth – give a higher probability of around 34% that 2025 will set a new temperature record.
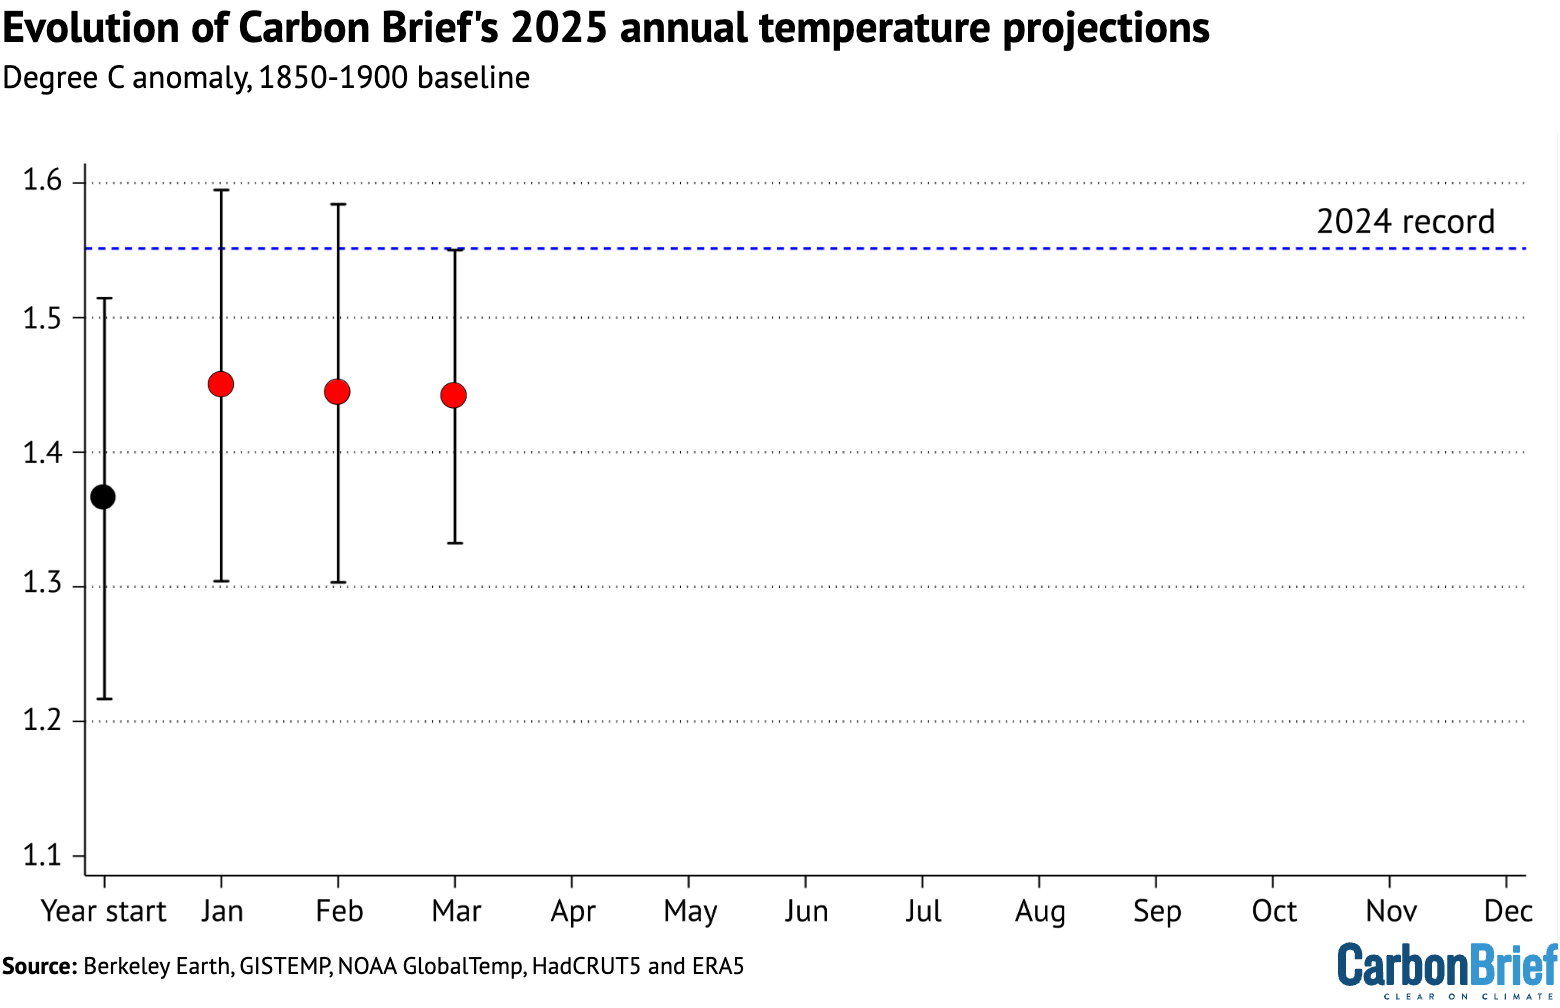
The figure below shows Carbon Brief’s estimate of 2025 temperatures using the WMO aggregate, both at the beginning of the year and once each month’s data has come in. The estimate jumped notably after t2025 saw the warmest January on record, but has been relatively stable over the past three months.
Carbon Brief’s projection of global temperatures based on the WMO aggregate at the start of the year, and after January, February, and March global surface temperature data became available. Chart by Carbon Brief.
Record-low Antarctic and Arctic sea ice
Both Arctic and Antarctic sea ice extent spent much of early 2025 at record, or near-record, lows.
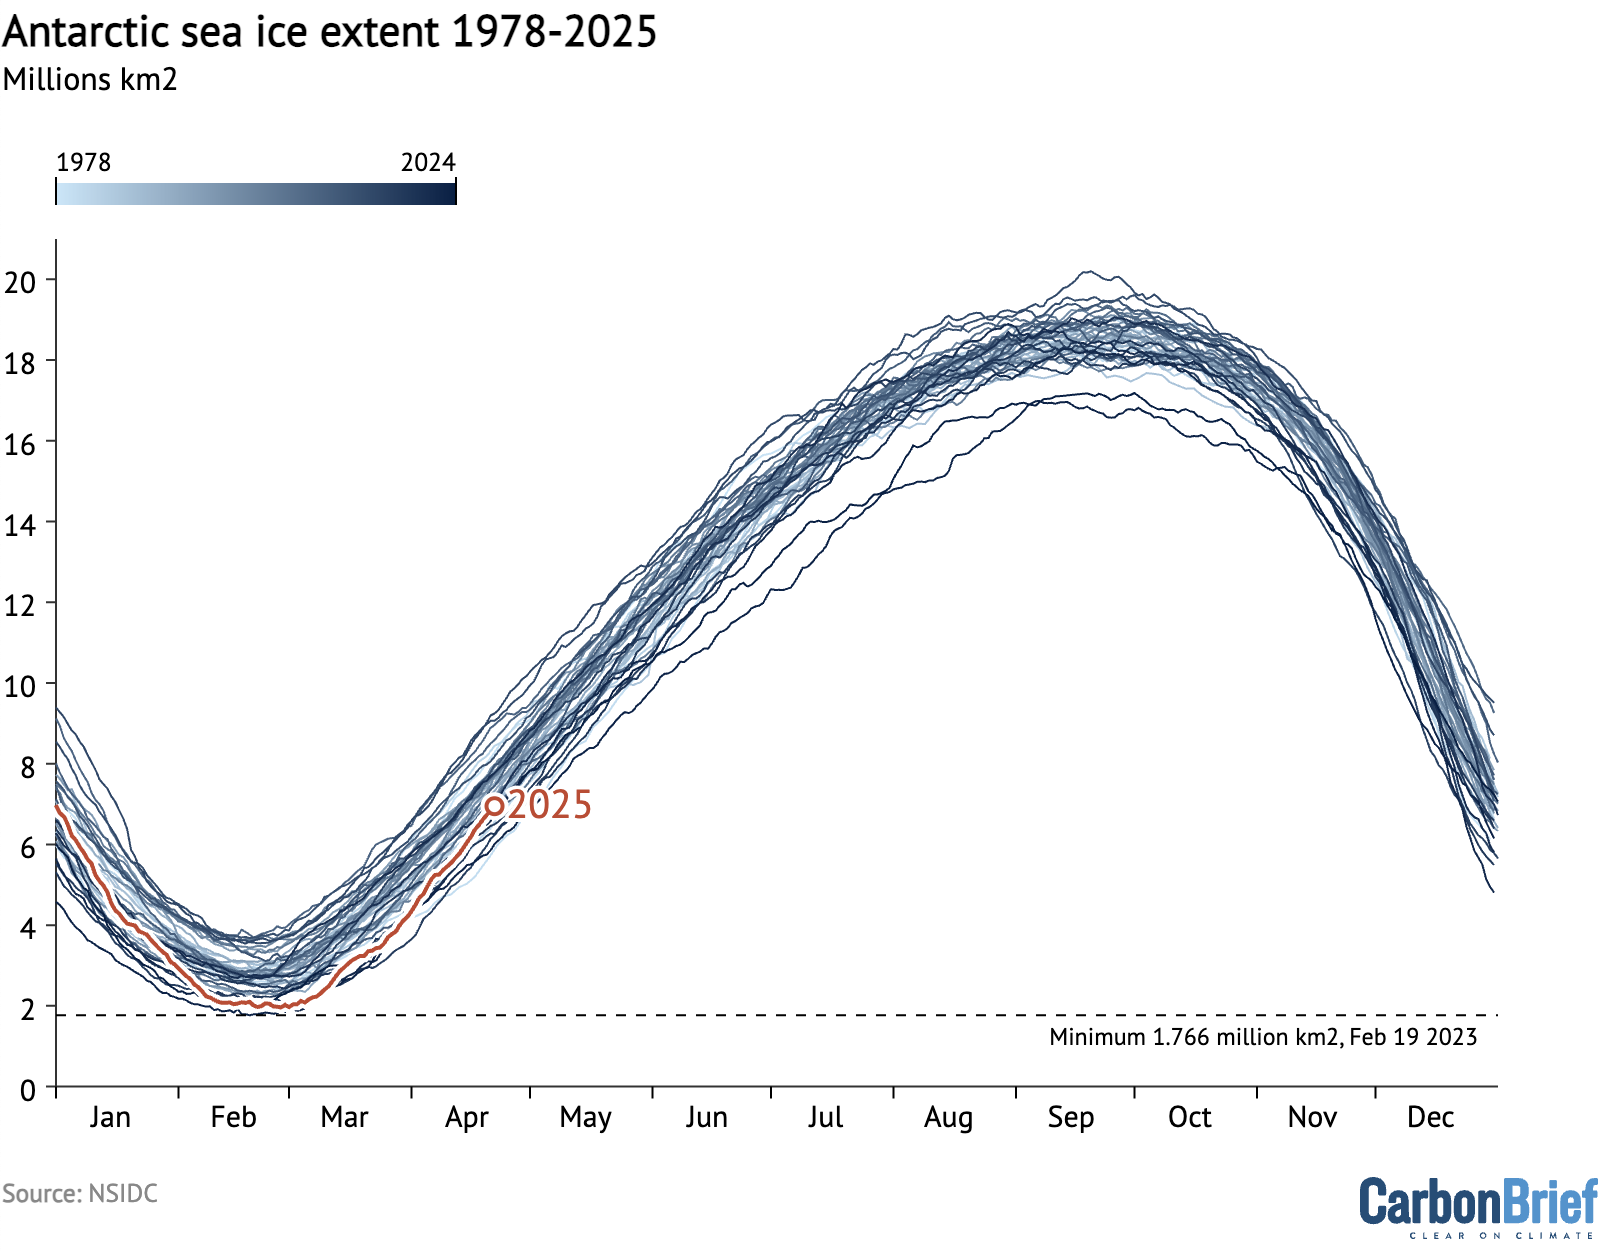
The figure below shows both Arctic and Antarctic sea ice extent in 2025 (solid red and blue lines), the historical range in the record between 1979 and 2010 (shaded areas) and the record lows (dotted black line).
(Unlike global temperature records, which only report monthly averages, sea ice data is collected and updated on a daily basis, allowing sea ice extent to be viewed up to the present.)https://interactive.carbonbrief.org/state-of-the-climate/2025-04/sea-ice-graph.htmlArctic and Antarctic daily sea ice extent from the US National Snow and Ice Data Center (NSIDC). The bold lines show daily 2025 values, the shaded area indicates the two standard deviation range in historical values between 1979 and 2010. The dotted black lines show the record lows for each pole. Chart by Carbon Brief.
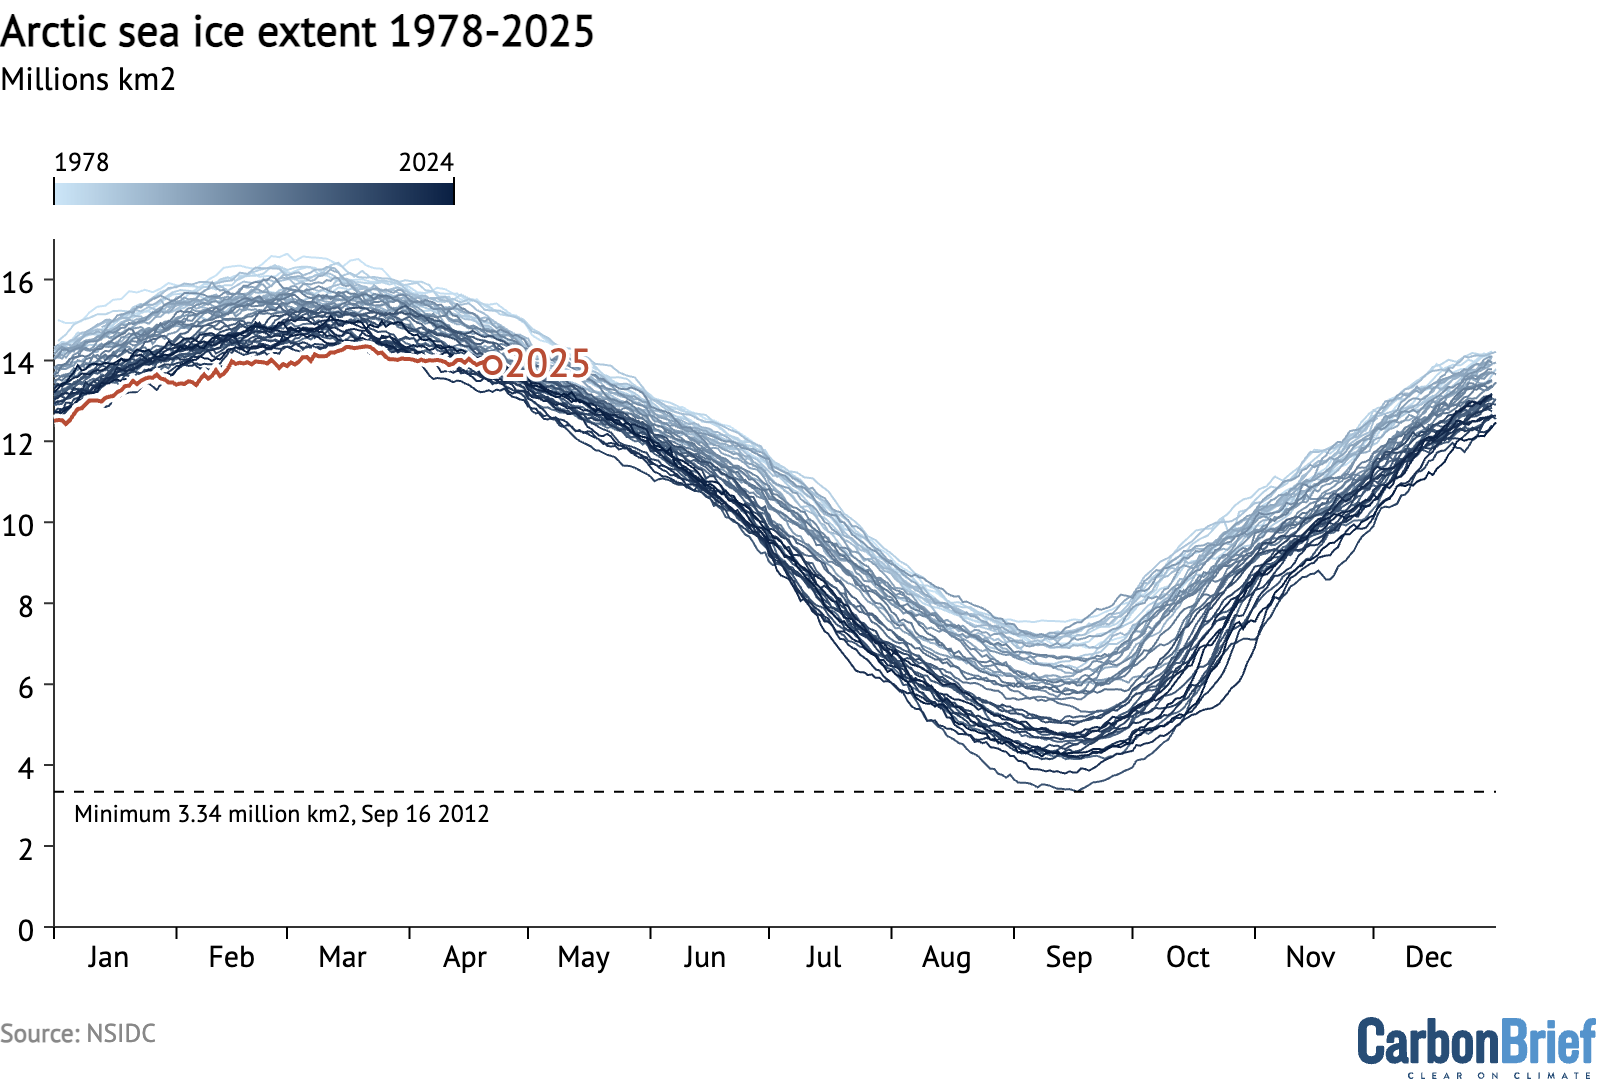
Arctic sea ice saw a new record low nearly each day between January and March, recording a record-low winter peak extent in late March. Ice extent subsequently moved out of record-low territory in April.
It is worth noting that, as northern hemisphere winter conditions remain cold enough to refreeze sea ice, there tends to be less variability in extent year-to-year in the winter than in the summer, as the chart below illustrates.
Antarctic sea ice started the year within the historical range (1979-2010), before plunging to tie for the second-lowest minimum on record in late February. It has since recovered in April, and is currently on the low end of the historical range.
dizzy: Trump is attempting to censor research and information like this.
Neo-Fascist Climate Science Denier Donald Trump says Burn, Baby, Burn.Elon Musk urges you to be a Fascist like him, says that you can ignore facts and reality then.Orcas discuss Donald Trump and the killer apes’ concept of democracy. Front Orca warns that Trump is crashing his country’s economy and that everything he does he does for the fantastically wealthy.
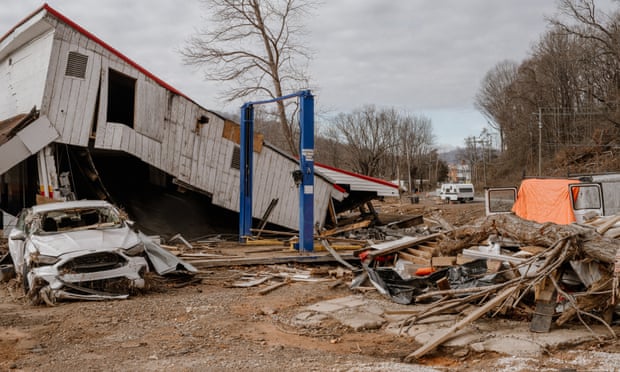
A destroyed mechanic’s shop in downtown Swannanoa, North Carolina, US, December 2024, nearly three months after Hurricane Helene in late September. Photograph: Mike Belleme/The Guardian
Floods, heatwaves and supercharged hurricanes occurred in hottest climate human society has ever experienced
…
The world is already deep into the climate crisis, with the WMO report saying that for the first time, the 10 hottest years on record all occurred in the last decade. However, global carbon emissions have continued to rise, which will bring even worse impacts. Experts were particularly critical of the purge of climate scientists and programmes by the US president, Donald Trump, saying that ignoring reality left ordinary people paying the price.
“Leaders must step up – seizing the benefits of cheap, clean renewables for their people and economies – with new national climate plans due this year,” said the UN secretary general, António Guterres.
Dr Luke Parsons, of the Nature Conservancy, said: “Every year, we venture further into uncharted territory, with 2024 the hottest year modern human society has ever experienced. Yet the coming decade is expected to be even hotter, pushing us deeper into this unprecedented climate.”
Previous research determining the role of the climate crisis in what are now unnatural disasters has shown that at least 550 heatwaves, floods, storms, droughts and wildfires had been made significantly more severe or more frequent by global heating.
Neo-Fascist Climate Science Denier Donald Trump says Burn, Baby, Burn.Elon Musk urges you to be a Fascist like him, says that you can ignore facts and reality then.Orcas comment on killer apes destroying the planet by continuing to burn fossil fuels.
BRITISH billionaires’ wealth surged by £35 million a day last year, new research reveals, as the rest of the nation worries about energy bills.
According to a report by Oxfam released today, the collective wealth of billionaires in Britain increased to a total of £182 billion in 2024.
The amount would be enough to cover the whole of Manchester in £10 notes one and a half times, the charity said.
The same report revealed that global billionaire wealth grew by $2 trillion (£1.6bn) in 2024 — three times faster than the year before.
Oxfam inequality policy lead Anna Marriott said that the world is on course for the emergence of at least five trillionaires within a decade.
“The global economic system is broken, wholly unfit for purpose as it enables and perpetuates this explosion of riches while nearly half of humanity continues to live in poverty,” she said.
Orcas discuss Donald Trump and the killer apes’ concept of democracy.Keir Starmer, Angela Rayner and Rachel Reeves wear the uniform of the rich and powerful. They have all had clothes bought for them by multi-millionaire Labour donor Lord Alli. CORRECTION: It appears that Rachel Reeves clothing was provided by Juliet Rosenfeld.
The year 2024 was the fourth warmest on record for the UK, behind only 2022, 2023 and 2014.
In this review, we look back at the UK’s climate in 2024 to highlight how the key events of the year fit into the wider picture of long-term human-caused climate change. We find:
Eight months of the year were warmer than average.
Spring was the warmest on record for the UK, which saw a record-high average temperature for May.
February was the second warmest on record for the UK and December the fifth warmest.
In contrast, the summer months of June, July and September were slightly cooler than average.
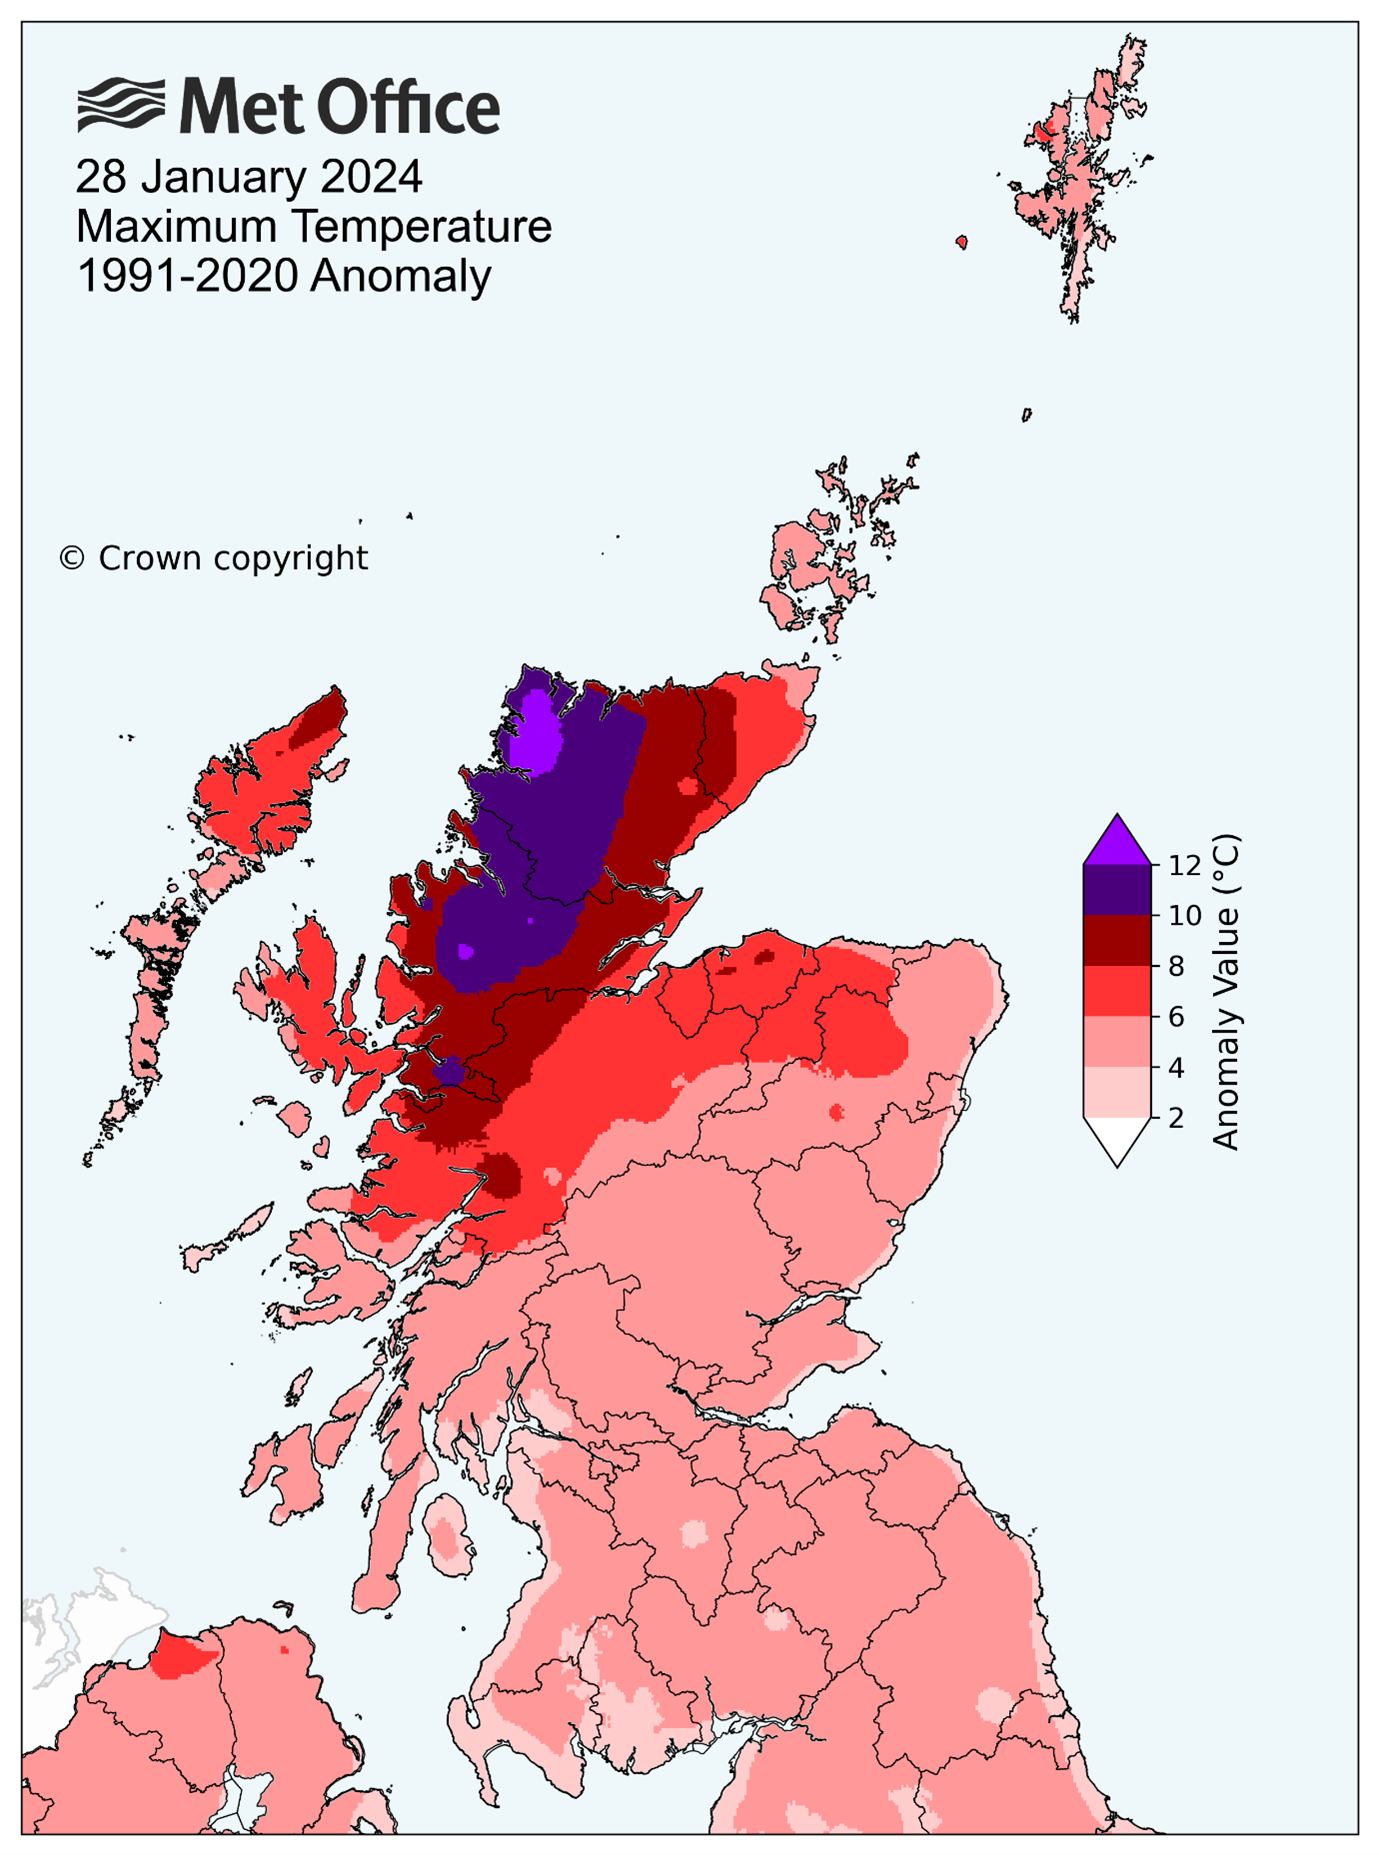
On 28 January, a strong Foehn effect resulted in a temperature of 19.9C at Achfary, Sutherland, marking the highest temperature for January since records began.
The year was relatively wet, with 7% more rainfall than average, making it the UK’s 17th wettest in a series going back to 1836.
Oxfordshire, Wiltshire, Gloucestershire, Bedfordshire and Buckinghamshire saw their second-wettest year on record, driven by large rainfall totals in February and September.
Storm Lilian in August marked the first time that storm names reached ‘L’ in the alphabetised list since storm naming was introduced in 2015.
An attribution study found that rainfall in the winter season of 2023-24 was 20% more intense due to human-caused climate change. It also showed the amount of rainfall observed during the season was 10 times more likely.
The Met Office relies on the long-running HadUK-Grid dataset to place recent UK weather and climate into its historical context. The gridded, geographically complete dataset combines observational data for monthly temperature since 1884, rainfall since 1836 and sunshine since 1910.
Unless stated otherwise, the rankings of events and statements (such as “warmest on record”) in this article relate to the HadUK-Grid series.
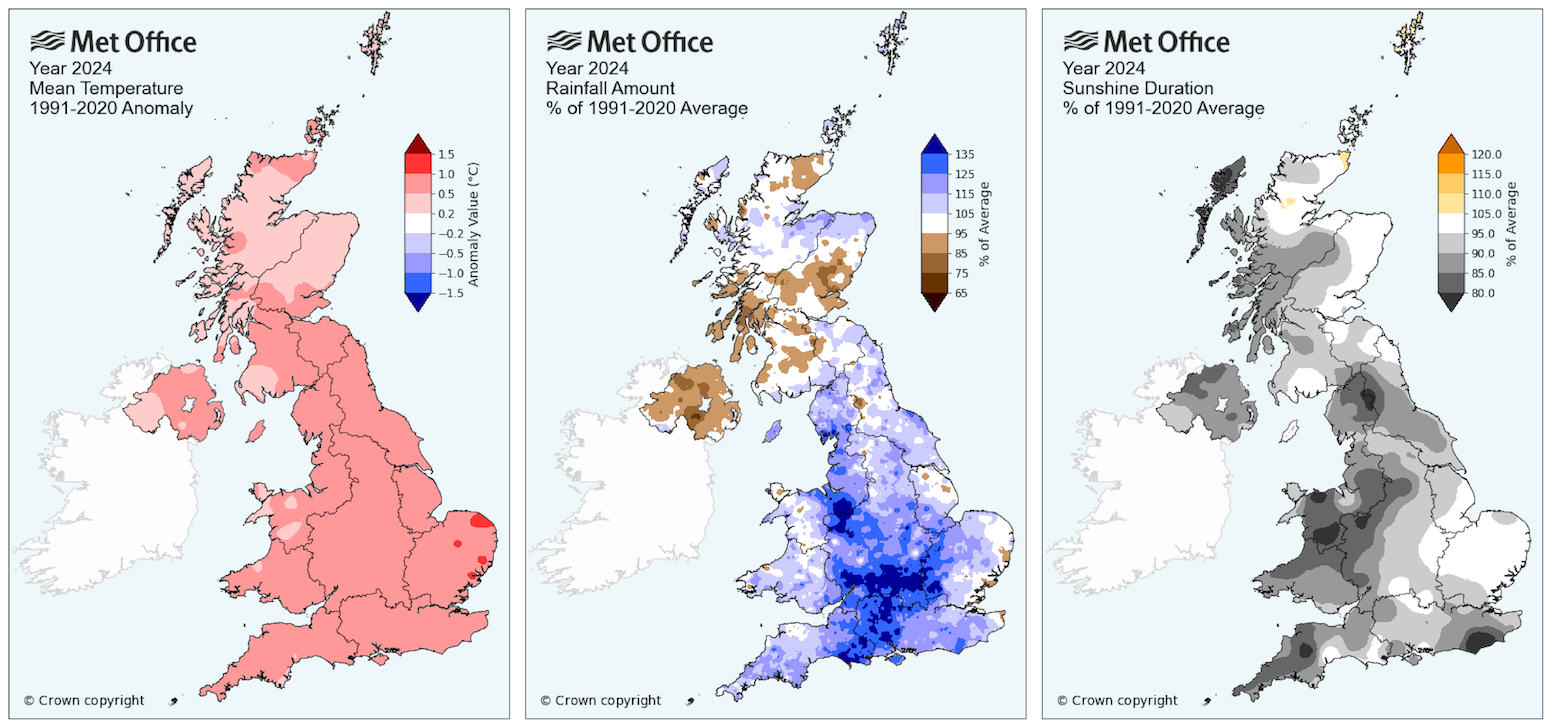
The “climate anomaly” maps below show the difference between the average temperature (left), rainfall total (middle) and sunshine duration (right) between 2024 and the 1991-2020 period. In other words, they show how much warmer, cooler, wetter, drier, sunnier or cloudier the year was than average.
Maps showing anomalies in 2024 relative to a 1991-2020 reference period for temperature (C), precipitation (%) and sunshine (%). The darker shading indicates a greater departure from average. Credit: Met Office
The maps show that the whole country was warmer than average, with slightly lower temperature anomalies in Scotland, and slightly higher anomalies seen in East Anglia.
Rainfall shows more regional variation, with the wettest regions relative to average in central and southern England, but a slightly drier year than average for Northern Ireland and parts of Scotland.
Meanwhile, it was a relatively dull year across the country with lower-than-average sunshine across the vast majority of the UK, particularly in western regions.
The UK annual average absolute temperature for 2024 was 9.78C, which is 0.64C above the 1991-2020 average.
This makes 2024 the fourth-warmest year since records began, coming only after 2022, when the average temperature was 10.03C; 2023, when the average temperature was 9.97C; and 2014, when temperatures averaged at 9.88C. Rounding off the top-five warmest years on record is 2006, when the average temperature was 9.70C.
The timeseries plot below shows how average temperature in the UK has followed a clear long-term warming trend since the 1960s.
Timeseries chart of annual UK mean absolute temperature 1884-2024. The trend is represented by a black dashed line, the 1991-2020 average is shown in pink and the highest and lowest values in the series are shown by the red and blue dashed lines, respectively. The 2024 value is represented by the horizontal brown line. Credit: Met Office
Daily minimum and maximum temperatures have been recorded in the UK since the 19th century.
These observe the highest and lowest temperature reached during a 24-hour period which starts and ends at 9:00 GMT each day. The daily maximum temperature tends to be in the early afternoon and the minimum temperature in the hours before dawn, but not exclusively. In the winter season in particular, changes in weather patterns can result in larger swings in temperature.
In 2024, the annual average minimum temperature for the UK was the equal-warmest on record, matching the previous record set in 2023. The consequence of this has been some mild nights and far fewer frosts than normal, particularly in February and December. Meanwhile, the annual average daily maximum temperature was 8th warmest in the series.
Tracking the impact of climate change
For 2022 and 2023, attribution analysis conducted by Met Office scientists has shown that the temperatures experienced in both years were exceptional in more than 140 years of observational data, and would have been a 1-in-500 year event in a climate unaffected by humans.
However, in the context of the current climate, such average temperatures are not necessarily extreme – in fact, they now have a “return period” closer to one-in-three years.
The observed temperature for the UK in 2024 – despite being the fourth warmest on record – is not unusual when seen through the context of the warming climate. The UK has warmed by a rate that is comparable to the observed rise in the global average temperature.
The internationally-agreed observational reference period for climate averages is the period 1991-2020. Variability in the Earth’s climate means that cooler years can still occur, such as in 2010. However, it is notable that the UK has not had a year with below-average temperature since 2013.
The 2024 climate statistics continue a pattern of warming in the UK, which highlights how climate change is not a distant challenge for the future, but is happening now.
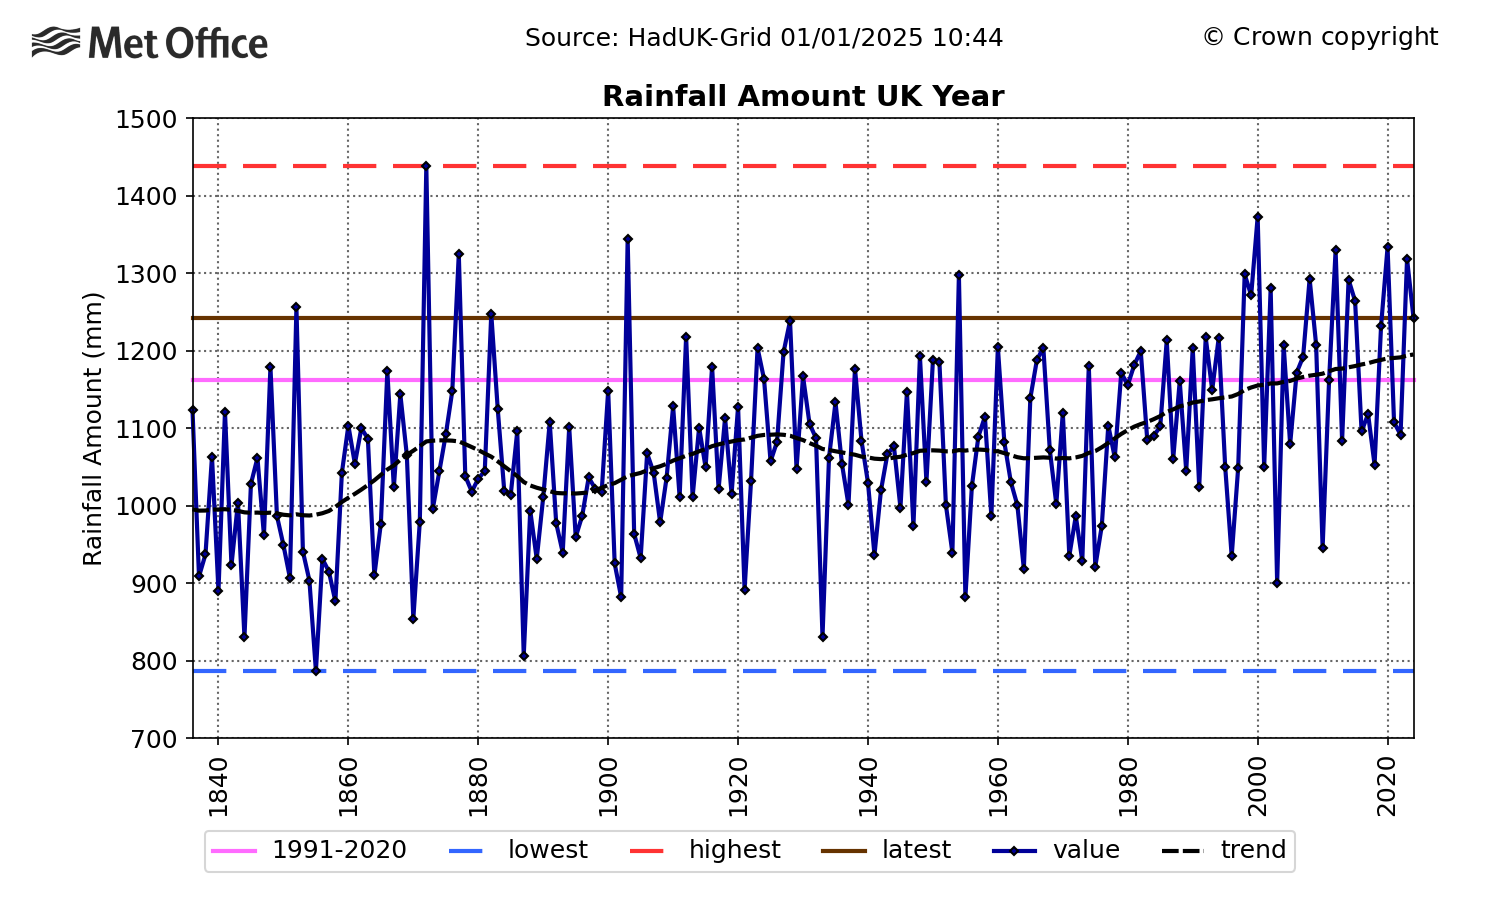
The year 2024 also fits into a general picture of a wetter climate for the UK overall. The timeseries plot below shows how rainfall in the UK has increased over recent decades.
Timeseries of UK total rainfall from 1836 to 2024 and (bottom). The trend is represented by a black dashed line, the 1991-2020 average is shown in pink and the highest and lowest values in the series are shown by the red and blue dashed lines, respectively. The 2024 value is represented by the horizontal brown line. Credit: Met Office
However, the drivers of annual rainfall trends are more complex than for temperature, with annual totals masking regional and seasonal variations.
Climate projections for the UK show that winters are more likely to become wetter and summers are more likely to be drier through the 21st century.
One important driver of this change is that a warmer ocean and atmosphere can result in more water vapour in the atmosphere, which brings greater rainfall totals, or more intense rain, associated with weather systems.
However, the impact of a warming atmosphere alone is not sufficient to wholly account for the observed rainfall increase evident in the UK annual rainfall series. Other factors include decadal-scale natural variations in the climate, and the influence of climate change on large-scale circulation patterns across the northern hemisphere.
The rainfall amount of 2024 would have been considered a notably wet year if compared to much of the 19th and 20th centuries. However, last year was drier than a cluster of relatively wet years that have occurred since the late 1990s.
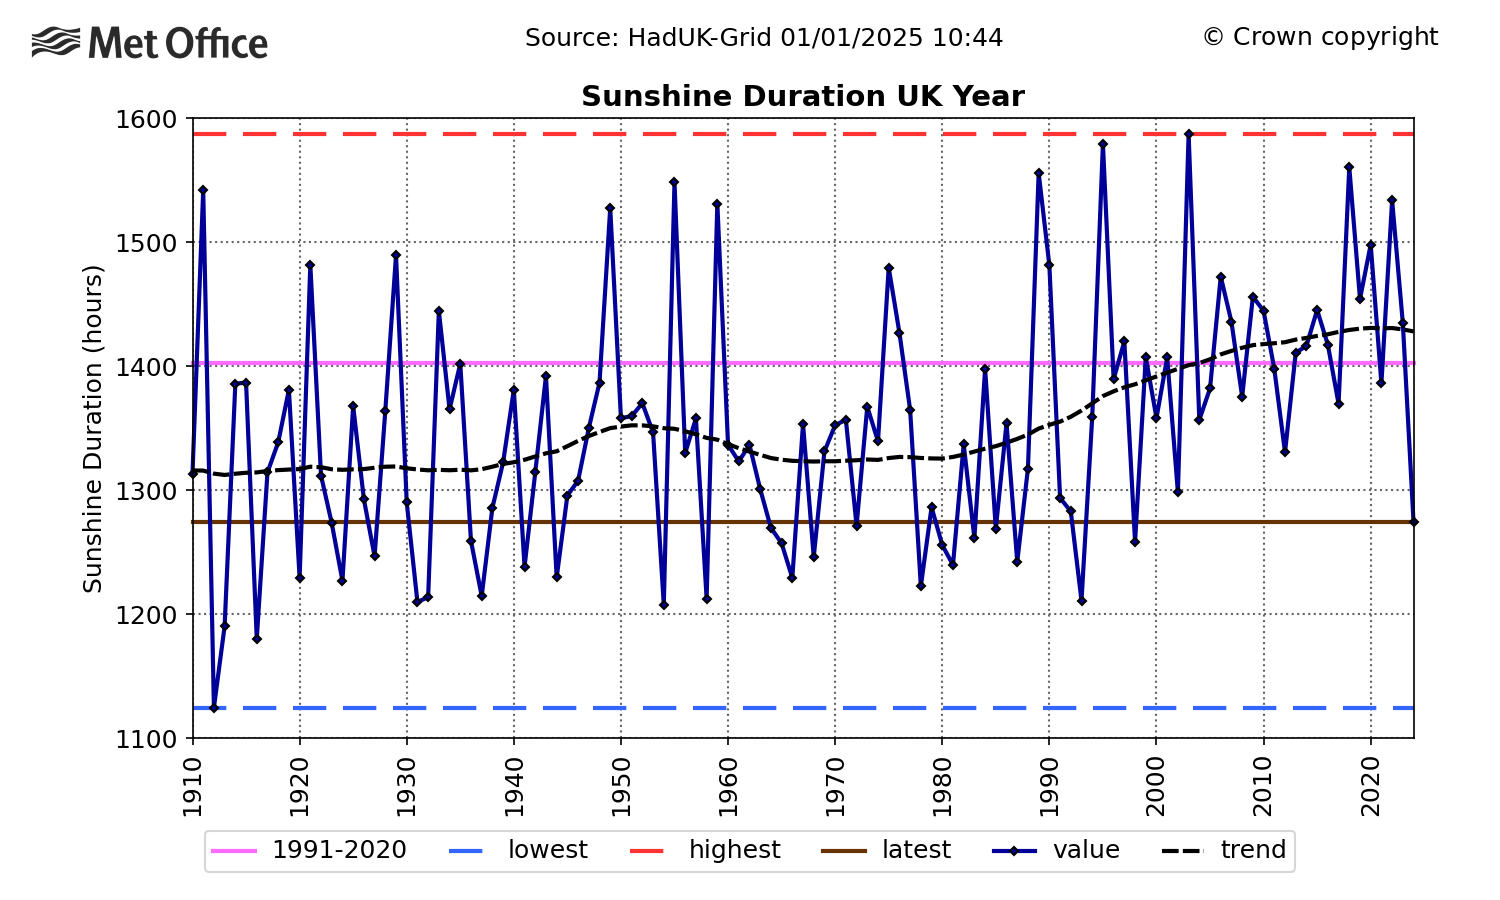
The timeseries below, which tracks annual sunshine in the UK over 1910-2024, highlights some of the vagaries of the UK’s climate.
The plot shows how 2024 was a relatively dull year for the UK, receiving the lowest hours of bright sunshine since 1998. However, this is against a backdrop of a longer-term trend of increasing sunshine in the UK, which has been especially notable since the 1980s. Sunshine amounts in winter and spring have seen the largest changes with 15-16% increases in the past decade, compared to the 1961-90 reference period.
Timeseries of UK total sunshine from 1910 to 2024. The trend is represented by a black dashed line, the 1991-2020 average is shown in pink and the highest and lowest values in the series are shown by the red and blue dashed lines, respectively. The 2024 value is represented by the horizontal brown line. Credit: Met Office
These trends are driven by a combination of natural variability, changes in dominant circulation patterns, as well as possible human influence from increases and decreases in aerosol pollutants that influence cloud cover.
Regionally, exceptionally wet weather – particularly in February and September – resulted in parts of central and southern England having an extremely wet year overall.
Oxfordshire, Wiltshire, Gloucestershire, Bedfordshire and Buckinghamshire all saw their second-wettest year, while Dorset, Cheshire and Berkshire had their third wettest and Hertfordshire and Shropshire their fifth wettest.
The year was in the top-10 wettest for a further 10 counties and in the upper third for a majority of regions. However, parts of east Scotland and Northern Ireland had slightly below-average rainfall for the year.
Map showing the ranking by county of annual rainfall in 2024. The counties shaded darkest blue had one of their top five wettest years in a series from 1836. No counties had their overall wettest year. Credit: Met Office
Weather through the year
Temperature
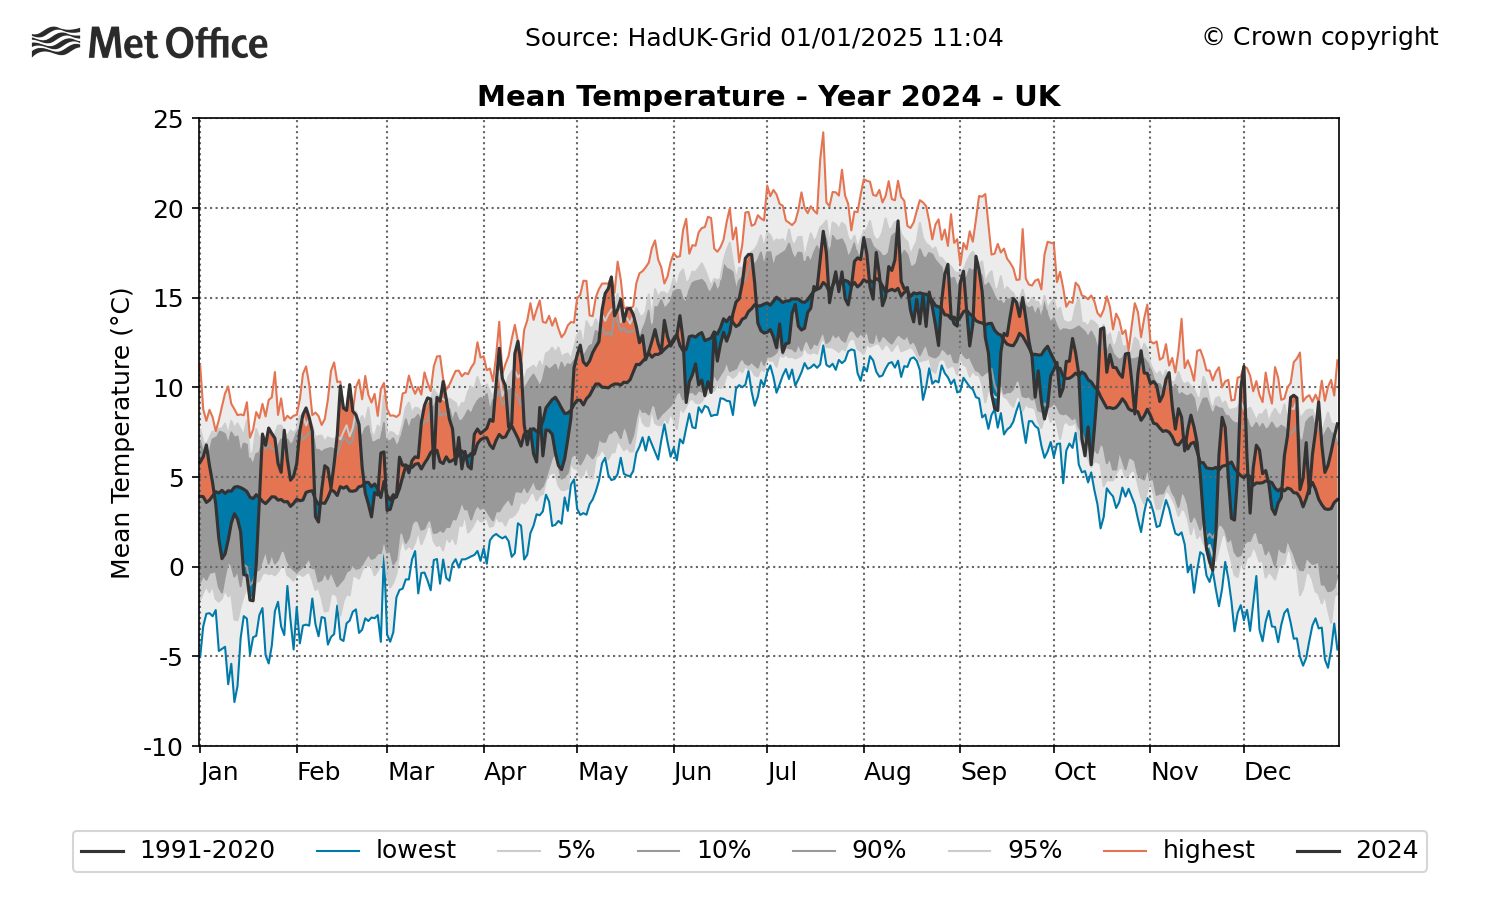
The chart below shows average UK temperature through the year, with orange highlighting periods that were warmer than average and blue showing cooler than average.
Timeseries of daily UK average temperature during 2024. Orange shading are periods of above average temperature, blue shading is below average, and the solid black line is the 1991-2020 reference period by day of the year. The grey shading reflects the 5th, 10th, 90th and 95th percentiles of the temperature distribution and the red and blue lines are the highest and lowest values for each day of the year, based on a dataset of daily data from 1960. Credit: Met Office
There were numerous spells of warm conditions (relative to the time of year), particularly in January, February, May and December. Overall, 60% of the year (220 days) was warmer than average and 40% (146 days) was cooler. A total of 13% (49 days) was above the 95th percentile (that is, in the top 5% warmest for the time of year). Cold snaps were not common and relatively short-lived, with only 3% (12 days) below the 5th percentile (that is, in the top 5% of coldest days for the time of year).
The highest maximum temperature of the year was 34.8C, recorded in Cambridge on 12 August during a relatively short hot spell in an otherwise unremarkable summer. The lowest minimum temperature of the year was -14.0C, recorded at Dalwhinnie in the Scottish Highlands on 17 January.
Extremes in temperature have increased at a much faster rate than the average, and the annual maximum temperature in 2024 – which would have once been an occasional event – is now much more common.
There were only nine years in the 20th century where the maximum temperature of the year in the climate archive exceeds the 2024 value (34.8C), but there are already eight years in the 21st century that have done so. Six of those have been in the last 10 years.
Rainfall
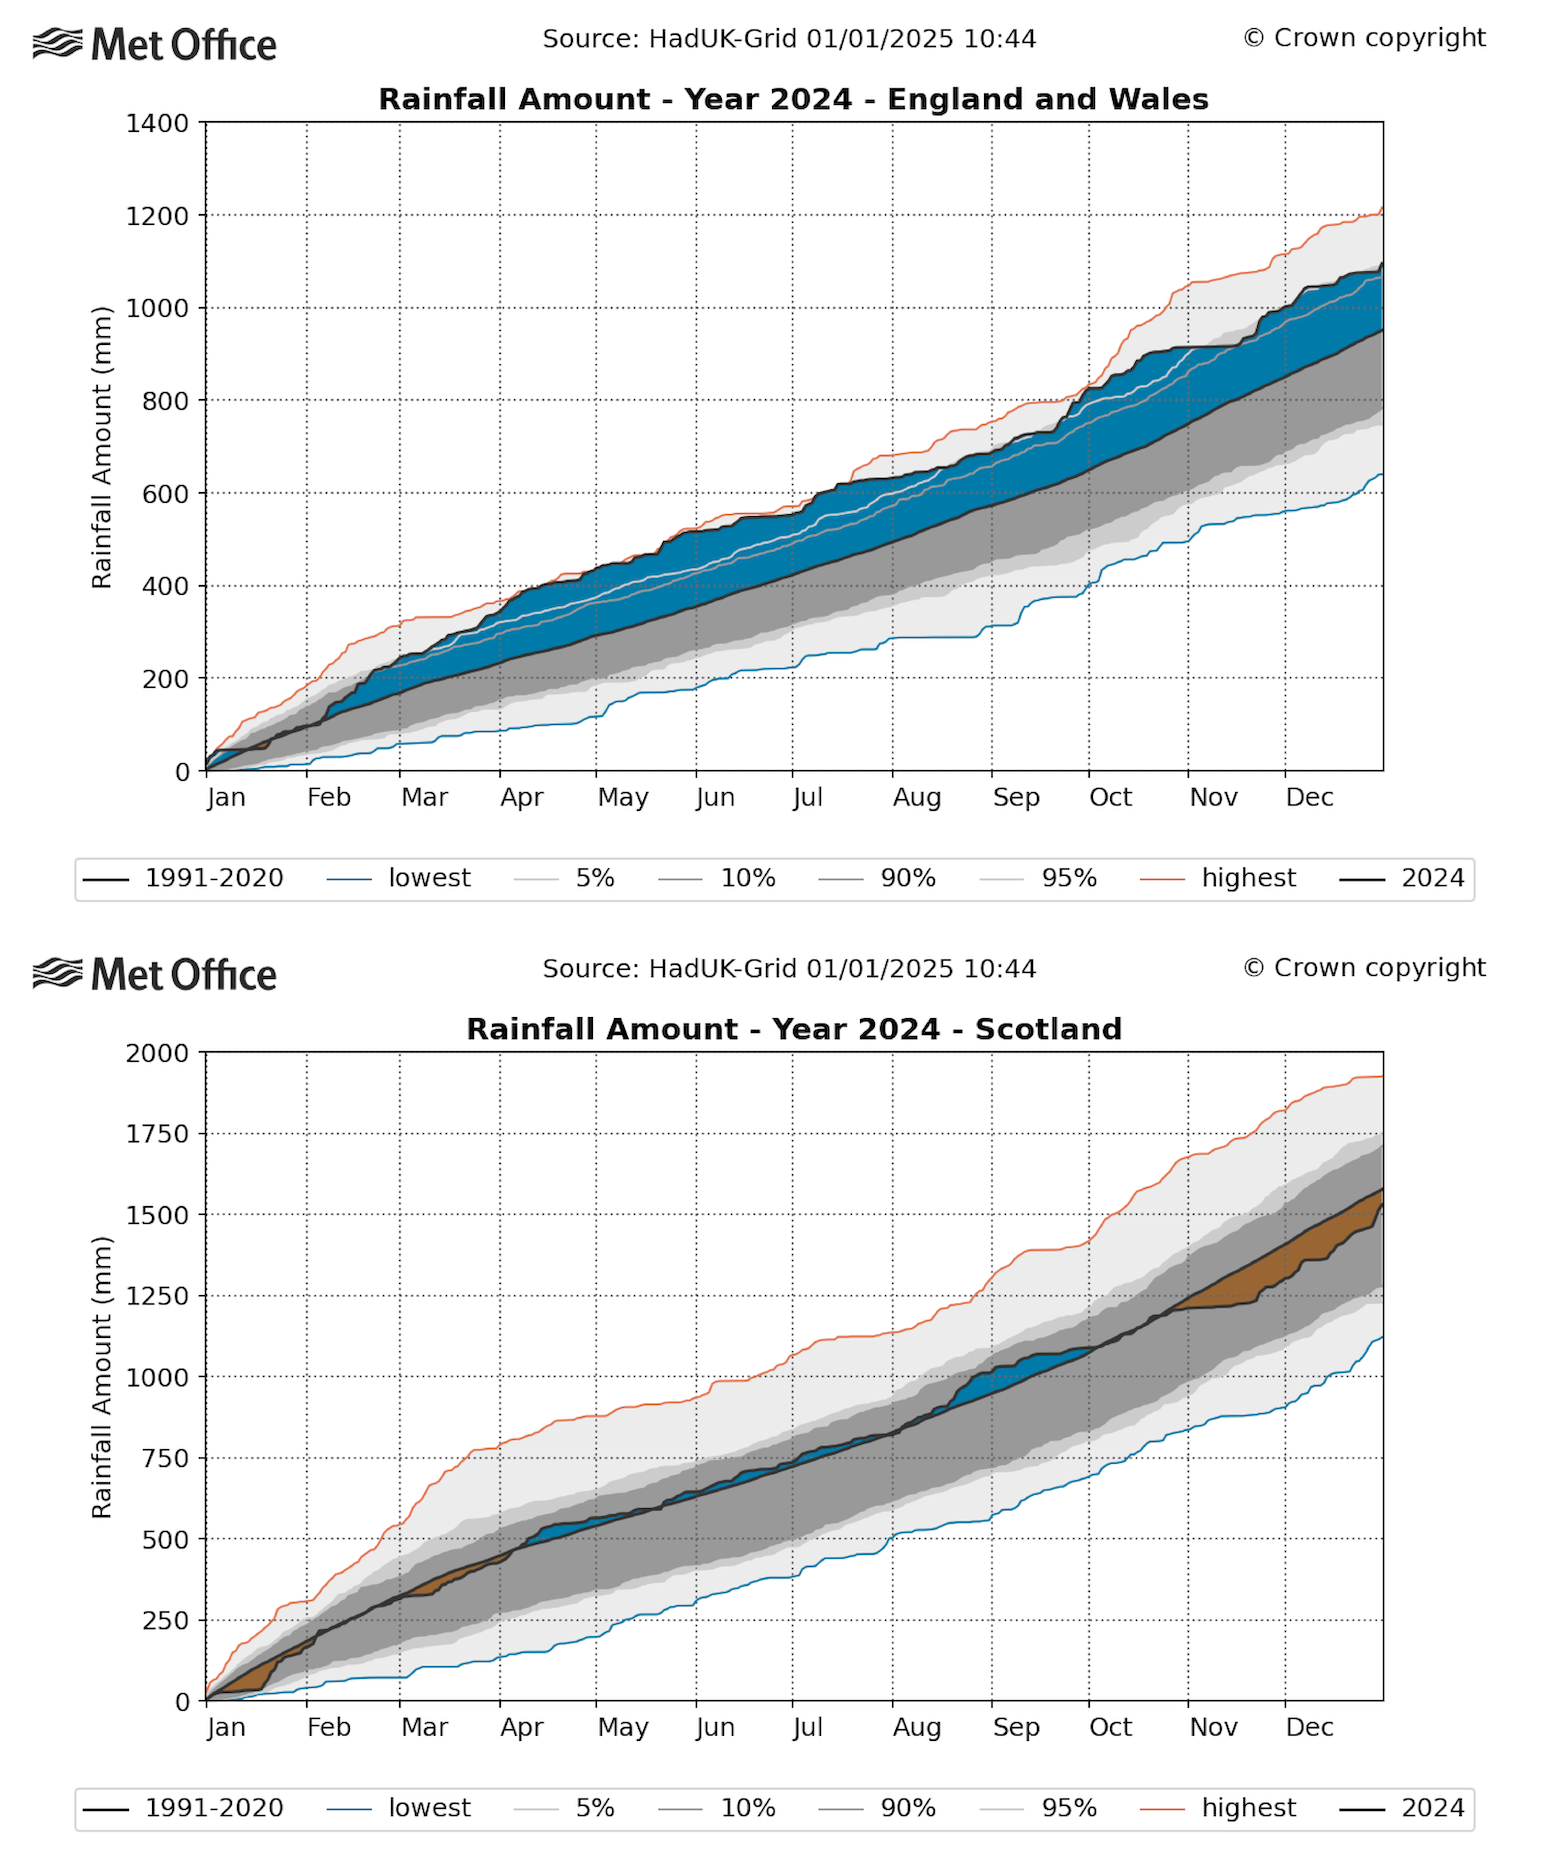
The two plots below show the accumulation of rain day-by-day through the course of the year, averaged across Scotland and for England and Wales combined.
The blue-shaded regions highlight periods when total rainfall was above average for the time of year and the orange-shaded regions times when it was below. For example, the first chart shows that Scotland had reached around 500mm by early April, which is close to average for that point in the year. (This equates roughly to a volume of water that could fill Loch Ness five times over).
Timeseries showing rainfall accumulation through 2024 for Scotland (top) and England and Wales (bottom). Brown shading represents a deficit in rainfall compared to average for that point in the year, and blue shading is an excess of rainfall compared to average. The solid line represents the 1991-2020 average, grey shading shows the 5th, 10th, 90th and 95th percentiles of the distribution, and blue and red the lowest and highest values based on a dataset of daily rainfall from 1891 to 2022. Credit: Met Office
In Scotland, total rainfall was close to average for much of the year. August was notably wet – the third wettest on record for western Scotland region – but this was offset by a dry autumn. A wet December, particularly for northern Scotland, brought the overall rainfall accumulation for 2024 close to average.
In contrast, rainfall in England remained well-above average for most of the year, leading to the year being the 8th wettest on record for the nation.
England saw its fourth-wettest February, followed by a wet March. In southern England, February saw well over 200% of average rainfall, dipping slightly to nearly 180% in March. Accumulated rainfall was further boosted by exceptional rain in September, which saw some regions recording more than 300% of average rainfall.
Storms
The Met Office has been naming storms – in collaboration with the Irish weather service, Met Eireann – since 2015. The Dutch weather service, KNMI, joined the initiative in 2019.
The 2023-24 storm season had a very active start with seven named storms occurring from September to December 2023. This continued into early 2024 with Henk, Isha and Jocelyn occurring in January.
The winter half-year from October 2023 to March 2024 was the wettest on record for both England and Wales, including in the long-running England and Wales Precipitation series (EWP), which dates back to 1766.
An attribution study – bringing together scientists from the UK, Ireland, Netherlands, Sweden and Germany – looked into the impact of climate change on the autumn-winter storm season, which ran from October 2023 to March 2024. It found that the average rainfall on stormy days has increased by about 20% due to human-caused climate change. This echoes wider studies and climate projections that suggest UK winters are likely to become wetter due to climate change.
An analysis of the intensity of storms based on wind speed in the study found that a stormy season was slightly less likely because of climate change. However, other studies, using other methods, have suggested an increase in storminess is likely in a future climate. The diverging findings highlight how uncertainty remains about the response of storm systems affecting the UK in a changing climate, and underscores the need for ongoing research on this topic.
Two red warnings for wind were issued in 2024. These were for storm Isha in January, which affected north-east Scotland and storm Darragh in December, which affected west Wales. The two wind storms were the UK’s most powerful since storm Eunice in February 2022.
Storm name
Date/s of impact in UK
Maximum wind gust
Number of observing sites recording wind gusts over 50 knots
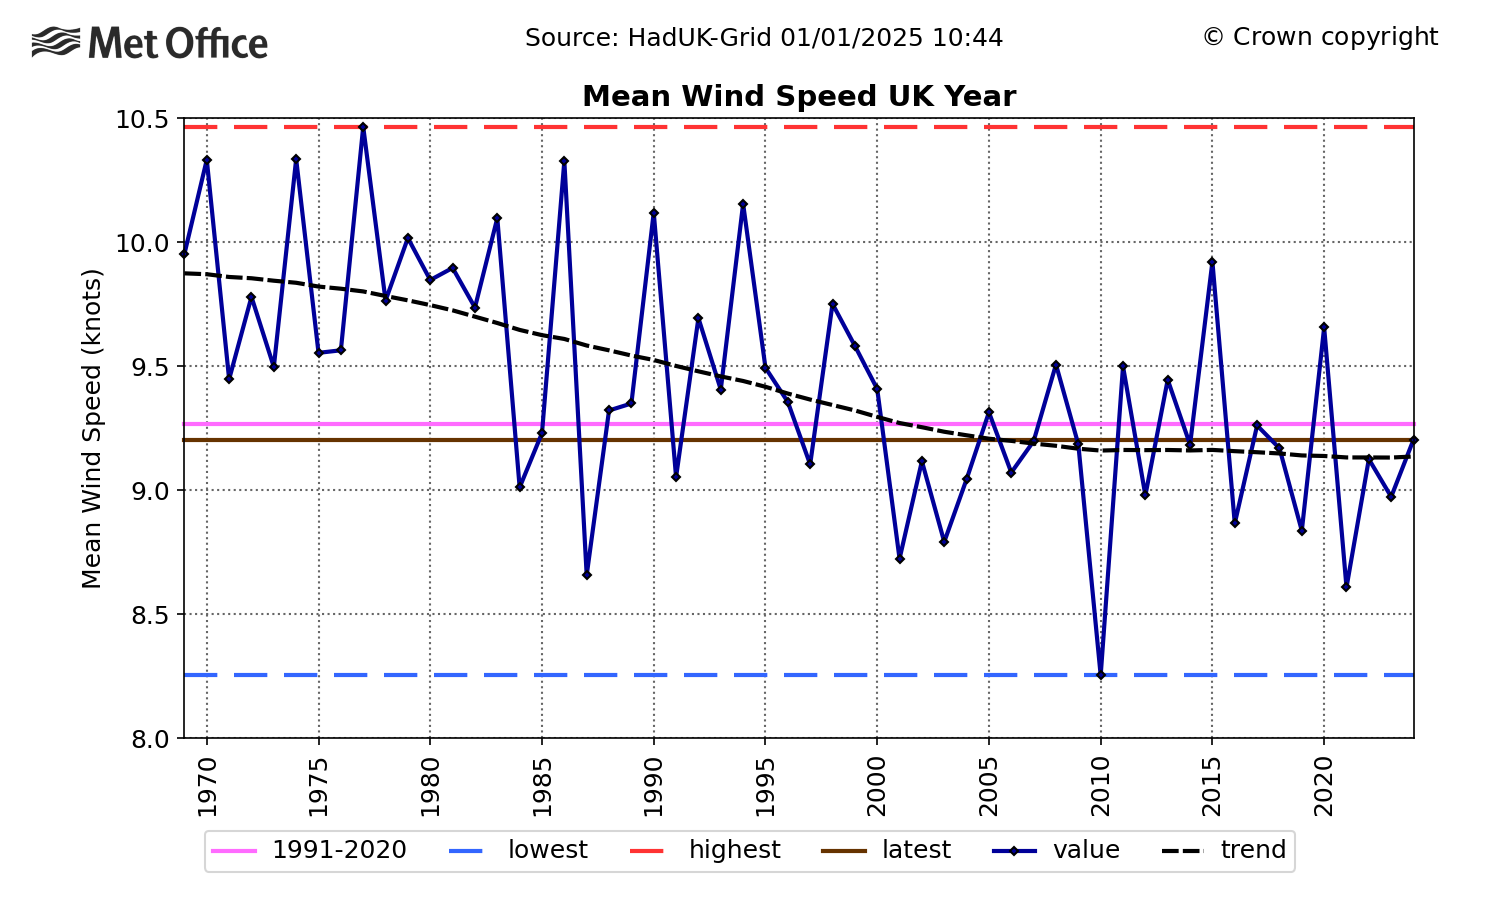
Overall, the average wind speed in 2024 was close to, but slightly below, the 1991-2020 average, while being the highest since 2020. This aligns with a long-term decline in the average wind speed for the UK since 1969, shown in the chart below.
Timeseries showing UK annual average wind speed over 1969-2024 (dark blue line) with the trend represented by a black dashed line. The 1991-2020 average is shown in pink and the highest and lowest values in the series are shown by the red and blue dashed lines, respectively. The 2024 value is represented by the horizontal brown line. Credit: Met Office
This long-term trend should be interpreted with some caution as it is possible that non-climatic factors – such as changes in instrumentation and exposure of the observing network through time – influences these trends. However, the decline is consistent with a widespread global slowdown termed “global stilling”.
More recently, global and UK data have shown that, since 2010, the decline in the average wind speed has stopped or even reversed.
Winter
The climatological UK winter spans the calendar months of December, January and February. Winter 2023-24 was mild and the fifth warmest on record for the UK. For England and Wales combined it was the second warmest on record.
The year commenced with some significant flooding impacts from storm Henk, which brought damaging winds and heavy rain to central and southern England and Wales on 2 January. The rain fell on already saturated ground, leading to flood warnings. High pressure became more established from mid-January, bringing a spell of cooler and drier conditions. The month concluded with storms Isha and Jocelyn in quick succession.
On 28 January, exceptionally high temperatures for the time of year were recorded in parts of north-west Scotland, reaching 19.9C at Achfary and 19.6C at Kinlochewe, surpassing both stations’ previous record of 18.3C by a large margin. There was a marked contrast between cooler and more moist conditions on the windward side of the highlands, and warmer, drier conditions on the leeward side.
This is the classic consequence of the Foehn effect, which can result in remarkably unseasonable temperatures locally due to the air losing moisture as it passes up and over the higher ground, resulting in warmer drier conditions when it descends.
Map showing temperature anomaly for 28 January 2024, relative to 1991-2020. Credit: Met Office.
The Foehn effect was the primary driver of January’s exceptional temperatures. However, it is worth acknowledging that global warming has led to high temperature records across all seasons in recent years. New maximum temperature records were set for January in 2024, February in 2019, July in 2022, October in 2011, November in 2015 and December in 2019.
In other words, new temperature records have been set for six of the 12 months of the year since 2011. Conversely, no months have set new lowest minimum records.
It was the warmest February on record for both England and Wales, and the second warmest for the UK overall. The years 2019, 2022, 2023 and 2024 also had warm Februaries which ranked in the top 10 warmest on record.
Meanwhile, the south of England has its wettest February on record, and England its fourth wettest. This resulted in widespread disruption, particularly to transport, due to flooding and landslips.
Overall, it was the eighth-wettest winter for the UK, continuing a trend of wetter winters consistent with climate projections that indicate that human-caused climate change will drive a shift to wetter winters.
Spring
The year 2024 saw the warmest May, and spring, on record for the UK.
It was also the sixth wettest spring on record, after a succession of low-pressure systems brought rain to much of the country, with the exception of north-west Scotland, which was drier than average.
The preponderance of wet weather contributed to considerable surprise – and in some cases disbelief – of the extent to which May broke its all-time temperature record. The possible disconnect between the recorded temperatures and perception of the conditions was also due to extreme daily minimum temperatures occurring overnight. An exceptionally warm month in spring does not necessarily mean a month of fine and dry weather.
A Met Office analysis of the May 2024 event demonstrated that a significant contributing factor to the high temperatures was from a marine heatwave affecting the waters around the UK for the whole of May and early June. Although the UK was under cloudy skies for much of May, clearer skies coupled with weak winds and wave conditions over the North Sea contributed to very high sea temperatures.
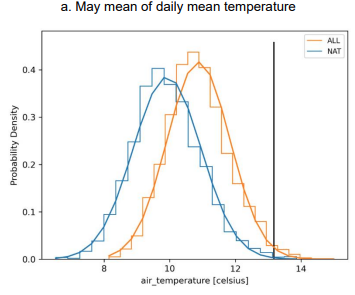
In addition to the contribution from the marine heatwave, a Met Office attribution analysis also found that human-induced climate change made the May average temperature between six and 14 times more likely than it would have been in a pre-industrial climate. The chart below shows how the likelihood of temperatures at or exceeding May 2024 are lower in a natural – or pre-industrial – climate compared to one impacted by human activities.
Chart showing the distribution of UK May mean temperature for simulations with human and natural forcings (ALL, in orange) and equivalent but with natural only forcings (NAT, blue). Credit: Met Office
Summer
The summer was arguably rather disappointing for many, with warm spells generally being short-lived and the season being cooler than average overall, and the coolest summer since 2015.
Although July was wetter than average for parts of the country, both June and August were relatively dry for most. Western Scotland and parts of north-west England were the exception and were notably wet in August, with some areas receiving more than 200% of average rainfall for the month. It was the third-wettest August on record for western Scotland.
A short hot spell across central and southern England on 11-12 August saw the highest temperature of the year, of 34.8C in Cambridge. This was followed – as is often the case in the breakdown of summer heat events – with an outbreak of thunderstorms. These particularly affected northern and western parts of the UK.
Storm Lilian in late August resulted in high winds and rain with significant disruption to road, rail and power supply across northern England. Storm Lilian means that the 2023-24 season has had the most named storms since the naming system was launched 10 years ago.
The storm naming system is designed for raising awareness of the potential of risk to life and property from extreme storms. The decision to name considers both the severity of the storm and also its likelihood to cause impacts. For example, a storm system passing over heavily populated regions coinciding with rush hour in the summer months when trees are in full leaf can carry higher risks than a storm of the same wind severity passing through overnight in winter.
Storm naming criteria and the partners involved have evolved over time. For these reasons the number of named storms over time cannot itself be used as an indicator of change.
Autumn and December
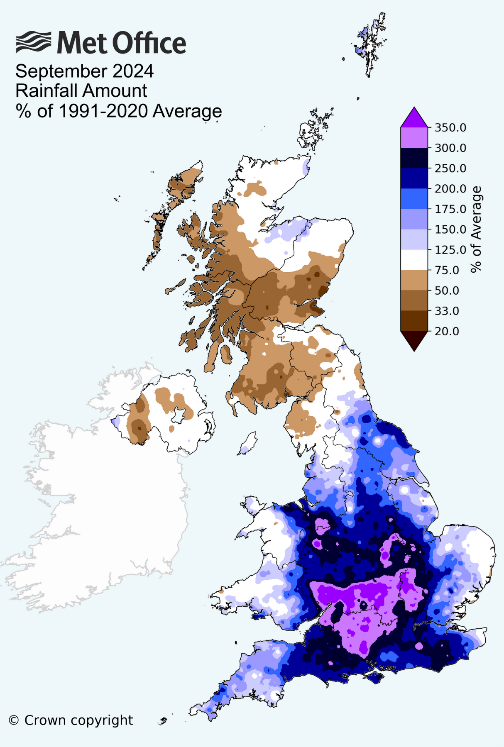
Autumn continued the rainy theme. A succession of low-pressure systems throughout September resulted in some exceptional rainfall for southern and central England, with more than 300% of average rainfall observed across a wide region.
It was the seventh-wettest September for England and the wettest September on record for 10 counties in central and southern England. For Bedfordshire and Oxfordshire, September was the wettest calendar month the counties have experienced in a series dating back to 1836. Meanwhile, the Oxford Radcliffe meteorological station recorded its wettest month since September 1774.
Map showing the percentage of average rainfall that fell in September 2024. The purple regions highlight those areas that had in excess of 300% of average. White areas were close to average and brown regions drier than average. Credit: Met Office
The remainder of autumn saw the first named storms for the 2024-25 season: Ashley in October and Bert and Conall in November. Storm Bert brought heavy rain and snow.
The day of 21 November saw the most significant November snow event since 2010, with lying snow as far south as Devon and Cornwall. This was one of the coldest spells of weather in the year, although lower temperatures were recorded during the January cold snap earlier that year. The spell was short-lived and conditions were much milder again throughout December. It was the fifth-warmest December in a series dating back to 1884.
December was also notable for a red weather warning issued for storm Darragh for west Wales and the Bristol Channel, with extreme wind gusts along exposed coastal and upland areas. Some of the strongest winds were from an unusual northerly direction, likely influencing the number of fallen trees. A number of fatalities were reported and more than 2 million people were left without power during the storm.
The weather of the UK within any single year is diverse and at times surprising, and 2024 was no different. Where records have been broken, they have been for exceptionally high temperatures and high rainfall totals. This is another reminder that climate change is already having an impact on the UK’s weather, shifting the probabilities to make high temperature extremes and records increasingly likely to be broken and re-broken.
The drivers of rainfall records are more complex, but climate projections have consistently pointed to a general pattern of wetter winters, drier summers and more intense rainfall when it occurs. It is therefore vital to continue to monitor the indicators of change both globally and in the UK, in order to better understand what changes can be expected in the future, and how to respond to climate-related risks.