Along with delegates from all over the world, I’ll be heading to the United Nations COP30 climate summit in the Brazilian Amazon city of Belém. Like many others, I’m unsure what to expect.
This year, the summit faces perhaps the greatest headwinds of any in recent history. In the United States, the Trump administration has slashed climate science, cancelled renewable projects, expanded fossil fuel extraction and left the Paris Agreement (again). Trump’s efforts to hamstring climate action have made for extreme geopolitical turbulence, overshadowing the world’s main forum for coordinating climate action – even as the problem worsens.
Climate talks are never easy. Every nation wants input and many interests clash. Petrostates and big fossil fuel exporters want to keep extraction going, while Pacific states despairingly watch the seas rise. But in the absence of a global government to direct climate policy, these imperfect talks remain the best option for coordinating commitment to meaningful action.
Here’s what to keep an eye on this year.
A smaller-than-usual COP?
A persistent criticism of the annual climate summits is that they have become too big and unwieldy – more a trade show and playground for fossil fuel lobbyists than an effective forum for multilateral diplomacy and action on climate change. One solution is to deliberately make these talks smaller.
The Belém conference may end up having a smaller number of delegates, though not by design so much as logistical headaches.
Brazilian President Luiz Inácio Lula da Silva backed the decision to invite the world to the Amazon to display how vital the massive rainforest is as a carbon sink. But Belém’s remote location on the northeast coast, limited infrastructure and shortage of hotels have seen prices soar, putting the conference out of reach for smaller nations, including some of the most vulnerable. These constraints could undermine the inclusive “Mutirão” (collective effort on climate change) sought by organisers.
Many delegates will sleep on ships at the Belem climate talks. Pictured is Curupira, a figure from Brazilian folklore and the COP30 mascot. Gabriel Della Giustina/COP30, CC BY-NC-ND
Show me the money
Climate finance is a perennial issue at COP meetings. These funding pledges by rich countries are intended to help poorer countries reduce emissions, adapt to climate change or recover from climate disasters. Poorer countries have long called for more funding, given rich countries have done vastly more damage to the climate.
At COP29 in Baku, Azerbaijan last year, a new climate finance goal was set for US$300 billion (~A$460 billion) to be raised annually by developed countries by 2035, with the goal of reaching $US1.3 trillion (~A$2 trillion) in funding from both government and private sources over the same period.
To deliver the second goal, negotiators laid out a “Baku to Belém” roadmap. The details are due to be finalised at COP30. But with the US walking away from climate action and the European Union wavering, many eyes will be on China and whether it will step into the climate leadership vacuum left by developed countries. The EU has only just reached agreement on a 2040 emissions reduction target and an “indicative” cut for 2035.
Climate finance will be the priority for many countries, as worsening disasters such as Hurricane Melissa in Jamaica and Typhoon Kalmaegi in the Philippines once again demonstrate the enormous human and financial cost of climate change.
The latest UN assessment indicates the need for this funding is outpacing flows by 12–14 times. In Belém, poorer countries will be hoping to land agreement on greater finance and support for adaptation. Work on a global set of indicators to track progress on adaptation – including finance – will be key.
Brazilian organisers hope to rally countries around another flagship funding initiative set to launch at COP30. The Tropical Forests Forever Facility would compensate countries for preserving tropical forests, with 20% of funds directed to Indigenous peoples and local communities who protect tropical forest on their lands. If it gets up, this fund could offer a breakthrough in tackling deforestation by flipping the economics in favour of conservation and protecting a huge store of carbon.
2035 climate pledges
Belém was supposed to be a celebration of ambitious new emissions pledges which would keep alive the Paris Agreement goal of holding warming to 1.5°C. Nations were originally due to submit their 2035 pledges (formally known as Nationally Determined Contributions) by February, with an extension given to September after 95 per cent of countries missed the deadline.
When pledges finally arrived in September, they were broadly underwhelming. Only half the world’s emissions were covered by a 2035 pledge, meaning the remaining emissions gap could be very significant. Australia is pledging cuts of 62–70% from 2005 emissions levels.
That’s not to say there’s no progress. A new UN report suggests countries are bending the curve downward on emissions but at a far slower pace than is needed.
How negotiators handle this emissions gap will be a litmus test for whether countries are taking their Paris Agreement obligations seriously.
Rise of the courts
Even as some countries back away from climate action, courts are increasingly stepping into the breach. This year, the International Court of Justice issued a rousing Advisory Opinion on states’ climate obligations under international law, including that national targets have to make an adequate contribution to meeting the Paris Agreement’s temperature goal. The court warned failing to take “appropriate action” to safeguard the climate system from fossil fuel emissions – including from projects carried out by private corporations – may be “an internationally wrongful act”. That is, they could attract international liability.
It will be interesting to see how this ruling affects negotiating positions at COP30 over the fossil fuel phase-out. At COP28 in 2023, nations promised to begin “transitioning away from fossil fuels in energy systems”. If countries fail to progress the phase-out, accountability could instead be delivered via the courts. A new judgement in France found the net zero targets of oil and gas majors amount to greenwashing, while lawsuits aimed at making big carbon polluters liable for climate damage caused by their emissions are in the pipeline.
An Australia/Pacific COP?
A big question to be resolved is whether Australia’s long-running bid to host next year’s COP in Adelaide will get up. The bid to jointly host COP31 with Pacific nations has strong international support, but the rival bidder, Turkey, has not withdrawn.
If consensus is not reached at COP30, the host city would default back to Bonn in Germany, where the UN climate secretariat is based.
Outcome unknown
As climate change worsens, these sprawling, intense meetings may not seem like a solution. But despite headwinds and backsliding, they are essential. The world has made progress on climate change since 2015, due in large part to the Paris Agreement. What’s needed now on its tenth anniversary is a reinfusion of vigour to get the job done.
Neo-Fascist Climate Science Denier Donald Trump says Burn, Baby, Burn.Donald Trump urges you to be a Climate Science denier like him. He says that he makes millions and millions for destroying the planet, Burn, Baby, Burn and Flood, Baby, Flood.Nigel Farage urges you to ignore facts and reality and be a climate science denier like him and his Deputy Richard Tice. He says that Reform UK has received £Millions and £Millions from the fossil fuel industry to promote climate denial and destroy the planet.
Atmospheric carbon dioxide (CO₂) rose faster in 2024 than in any year since records began – far faster than scientists expected.
Our new satellite analysis shows that the Amazon rainforest, which has long been a huge absorber of carbon, is struggling to keep up. And worryingly, the satellite that made this discovery could soon be switched off.
Systematic measurements of CO₂ in the atmosphere began in the late 1950s, when the Mauna Loa observatory in Hawaii (chosen for its remoteness and untainted air) registered about 315 parts per million (ppm). Today, it’s more than 420ppm.
But just as important is the rate of change. The annual rise in global CO₂ has gone from below 1ppm in the 1960s to more than 2ppm a year in the 2010s. Every extra ppm represents about 2 billion tonnes of carbon – roughly four times the combined mass of every human alive today.
Across six decades of measurements, atmospheric CO₂ has gradually increased. There have been some large but temporary departures, typically associated with unusual weather caused by an El Niño in the Pacific. But the long-term trend is clear.
In 2023, CO₂ in the atmosphere grew by about 2.70ppm. That’s a large step up, but not too unusual. Yet in 2024, it was an unprecedented 3.73ppm.
How satellites observe atmospheric CO₂
Until recently, we could only monitor CO₂ through stations on the ground like the one in Hawaii. That changed with satellites such as Nasa’s Orbiting Carbon Observatory (OCO-2), launched in 2014.
The OCO-2 satellite analyses sunlight reflected from Earth. Carbon dioxide acts like a filter, absorbing specific wavelengths of light. By observing how much of that specific light is missing or dimmed when it reaches the satellite, scientists can accurately calculate how much CO₂ is in the atmosphere.
But air is always on the move. The CO₂ above any one point can come from many sources – local emissions, nearby forests, or air carried from far away. To untangle this mix, scientists use computer models that simulate how winds move CO₂ around the globe.
They then adjust these models until they match what the satellite sees. This gives us the most accurate estimate possible of where carbon is being released and where it’s being absorbed.
The decade-long data record from OCO-2 allows us to put 2023 and 2024 into historical context.
The result
From the satellite data, we infer that the largest changes in CO₂ emissions and absorption during 2023 and 2024, compared with the baseline year of 2022, were over tropical land.
Data from 2023 and 2024 shows the areas where more carbon was emitted (in red) and withdrawn (blue) compared with the ‘normal’ year of 2022. The Amazon stands out in both years. Feng et al
The largest change was over the Amazon, where much less CO₂ is being absorbed. Similar slowdowns also appeared over southern Africa and southeast Asia, parts of Australia, the eastern US, Alaska and western Russia.
Conversely, we detected more carbon being absorbed over western Europe, the US and central Canada.
Other data backs this up. For instance, plants emit a faint glow as they photosynthesise – remarkably, we can see this glow from space. Measurements of this glow along with vegetation greenness both show that tropical ecosystems were less active in 2023 and 2024.
Our analysis suggests that warmer temperatures explain most of the Amazon’s reduced capability to absorb carbon. Elsewhere in the tropics, changes in rainfall and soil moisture were more important.
Why 2023 and 2024 were special
In many ways, these years resembled previous El Niño years such as 2015-16, when drought and heat led to less carbon absorption and more wildfires. But what’s interesting about 2023-24 is that the responsible El Niño event was comparatively weak.
Something else must be amplifying the effect. The most likely culprit is the extensive, record-breaking drought that has gripped much of the Amazon basin. When plants are already stressed by a lack of water, even modest warming can push them beyond their tolerance, reducing their ability to absorb carbon.
Small boats left stranded as the Tapajós river (a major Amazon tributary) dries up in late 2023. Tarcisio Schnaider / shutterstock
Roughly half of the CO₂ emitted by humans stays in the atmosphere. The other half is absorbed, more or less equally, by the land and the oceans. If drought or heat means plants are less able to absorb carbon, even temporarily, more of our emissions will remain in the air.
Our ability to meet climate targets relies on nature continuing to provide this vital carbon storage.
Satellite shutdown
It’s not yet clear whether 2023-24 is a short-term blip or an early sign of a long-term shift. But evidence points to an increasingly fragile situation, as tropical forests are stressed by hot and dry conditions.
Understanding exactly how and where these ecosystems are changing is essential if we want to know their future role in the climate, and whether drought will delay their recovery. One step is to urgently send scientists to tropical ecosystems to document recent changes in person.
That’s also where satellites like OCO-2 come in. They offer global and almost real-time coverage of how carbon dioxide is moving between the land, oceans and atmosphere, helping us separate temporary effects like El Niño from deeper changes.
Yet, despite being fit and healthy and having enough fuel to keep it going until 2040, OCO-2 is at risk of being shut down due to proposed Nasa budget cuts.
We wouldn’t be blind without it – but we’d be seeing far less clearly. Losing OCO-2 would mean losing our best tool for monitoring changes in the carbon cycle, and we will all be scientifically poorer for it.
The Amazon is sending us a warning. We must keep watching – while we still can.
Orcas comment on killer apes destroying the planet by continuing to burn fossil fuels.Donald Trump urges you to be a Climate Science denier like him. He says that he makes millions and millions for destroying the planet, Burn, Baby, Burn and Flood, Baby, Flood.Nigel Farage urges you to ignore facts and reality and be a climate science denier like him and his Deputy Richard Tice. He says that Reform UK has received £Millions and £Millions from the fossil fuel industry to promote climate denial and destroy the planet.
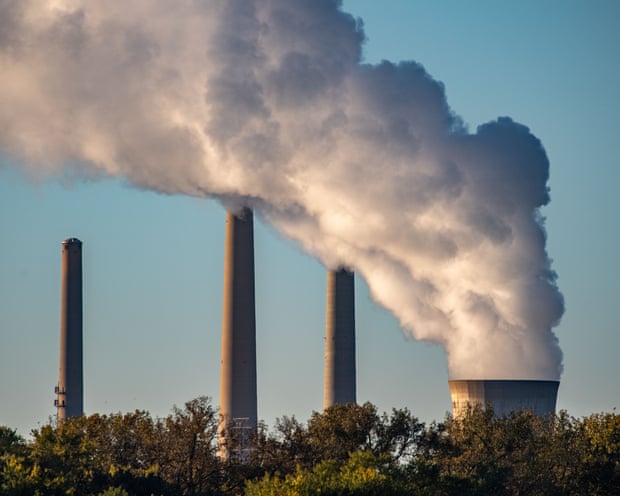
A coal power station in Ohio, US. Donald Trump has declared his support for coal and other fossil fuels. Photograph: Jason Whitman/NurPhoto/Shutterstock
Bleak report finds greenhouse gas emissions are still rising despite ‘exponential’ growth of renewables
Coal use hit a record high around the world last year despite efforts to switch to clean energy, imperilling the world’s attempts to rein in global heating.
The share of coal in electricity generation dropped as renewable energy surged ahead. But the general increase in power demand meant that more coal was used overall, according to the annual State of Climate Action report, published on Wednesday.
The report painted a grim picture of the world’s chances of avoiding increasingly severe impacts from the climate crisis. Countries are falling behind the targets they have set for reducing greenhouse gas emissions, which have continued to rise, albeit at a lower rate than before.
Clea Schumer, a research associate at the World Resources Institute thinktank, which led the report, said: “There’s no doubt that we are largely doing the right things. We are just not moving fast enough. One of the most concerning findings from our assessment is that for the fifth report in our series in a row, efforts to phase out coal are well off track.”
Orcas comment on killer apes destroying the planet by continuing to burn fossil fuels.Donald Trump urges you to be a Climate Science denier like him. He says that he makes millions and millions for destroying the planet, Burn, Baby, Burn and Flood, Baby, Flood.Nigel Farage urges you to ignore facts and reality and be a climate science denier like him and his Deputy Richard Tice. He says that Reform UK has received £Millions and £Millions from the fossil fuel industry to promote climate denial and destroy the planet.
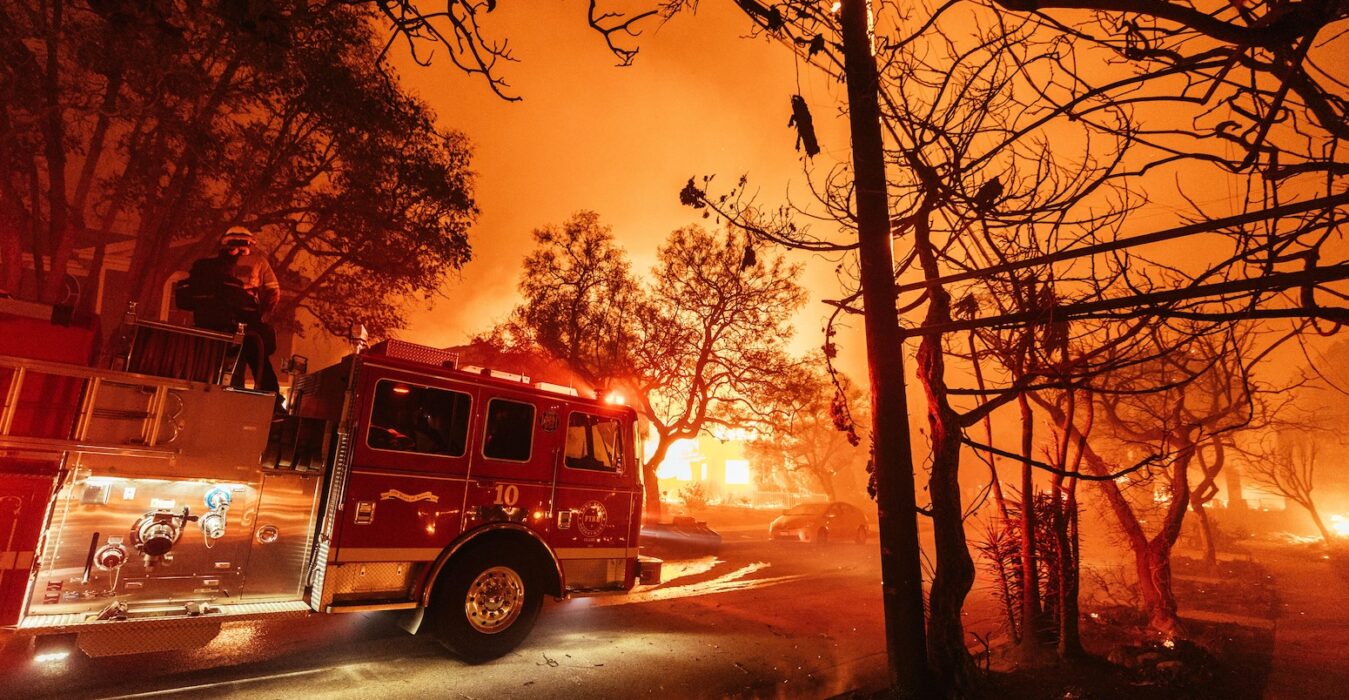
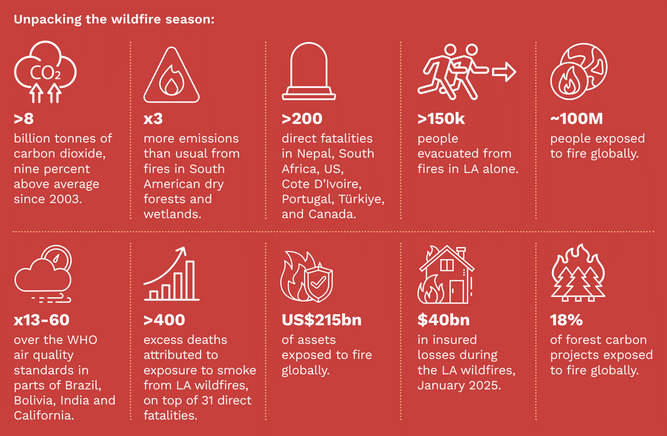
“Extreme” wildfires emitted more than 8bn tonnes of carbon dioxide during the 2024-25 “global fire season”, according to a new report.
The annual “state of wildfires” report from an international team of scientists finds that fires burned at least 3.7m square kilometres of land – an area larger than India – between March 2024 and February 2025.
This is almost 10% below the average annual area burned over the past two decades.
But, due to an increase in wildfires in carbon-rich forests, the CO2 emissions resulting from these fires were almost 10% above average.
The report also zooms in on four of the most prominent extreme wildfire events during this time: southern California; north-east Amazonia; South America’s Pantanal-Chiquitano region; and the Congo Basin.
All of these events were found to have been more likely to occur as a result of human-caused climate change.
The researchers identify that, in some cases, the area burned by these fires was 25-35 times larger than it would have been without global warming.
The report also estimates that more than 100 million people around the world were exposed to wildfires in 2024 and 2025.
These fires are “reshaping lives, economies and ecosystems on a global scale”, one of the report authors, Dr Carmen Steinmann from ETH Zürich, said in a statement.
‘Increasing extent and severity’
Scientists from dozens of institutions analyse “extreme wildfires” globally between March 2024 and February 2025 in the second annual edition of the report.
The report explains that the “March-February definition of the global fire season latest global fire season is chosen so as to align with an annual lull in the global fire calendar in the boreal spring months”.
According to the report, the authors “harness and adopt new methodologies brought forward by the scientific community”. They add that in future reports, they hope to “enhance the tools presented in this report to predict extremes with increasing lead times, monitor emerging situations in near-real time and explain their causes rapidly”.
“[The report] focuses on the global extreme wildfire events of the global fire season, explains why they happened and fingerprints the role of climate change as one of the key drivers of changing wildfire risk globally.”
The authors aim to “deliver actionable information” to policy experts and wider society about wildfires, the report says.
Using satellite data, the authors find that 3.7m square kilometres (km2) of land burned globally between March 2024 and February 2025. This means that the 2024-25 fire season ranks 16th out of all fire seasons since 2002, indicating below-average burned area compared to the rest of the 21st century.
However, the global fire emissions database shows that the 2024-25 wildfire season drove more than 8bn tonnes of CO2 emissions, according to the report. This is 10% above the average of wildfire seasons since 2002.
Jones explains that this is indicative of a trend towards “increasing extent and severity of fire in global forests, which are carbon-rich”, as opposed to less carbon-rich grassland biomes.
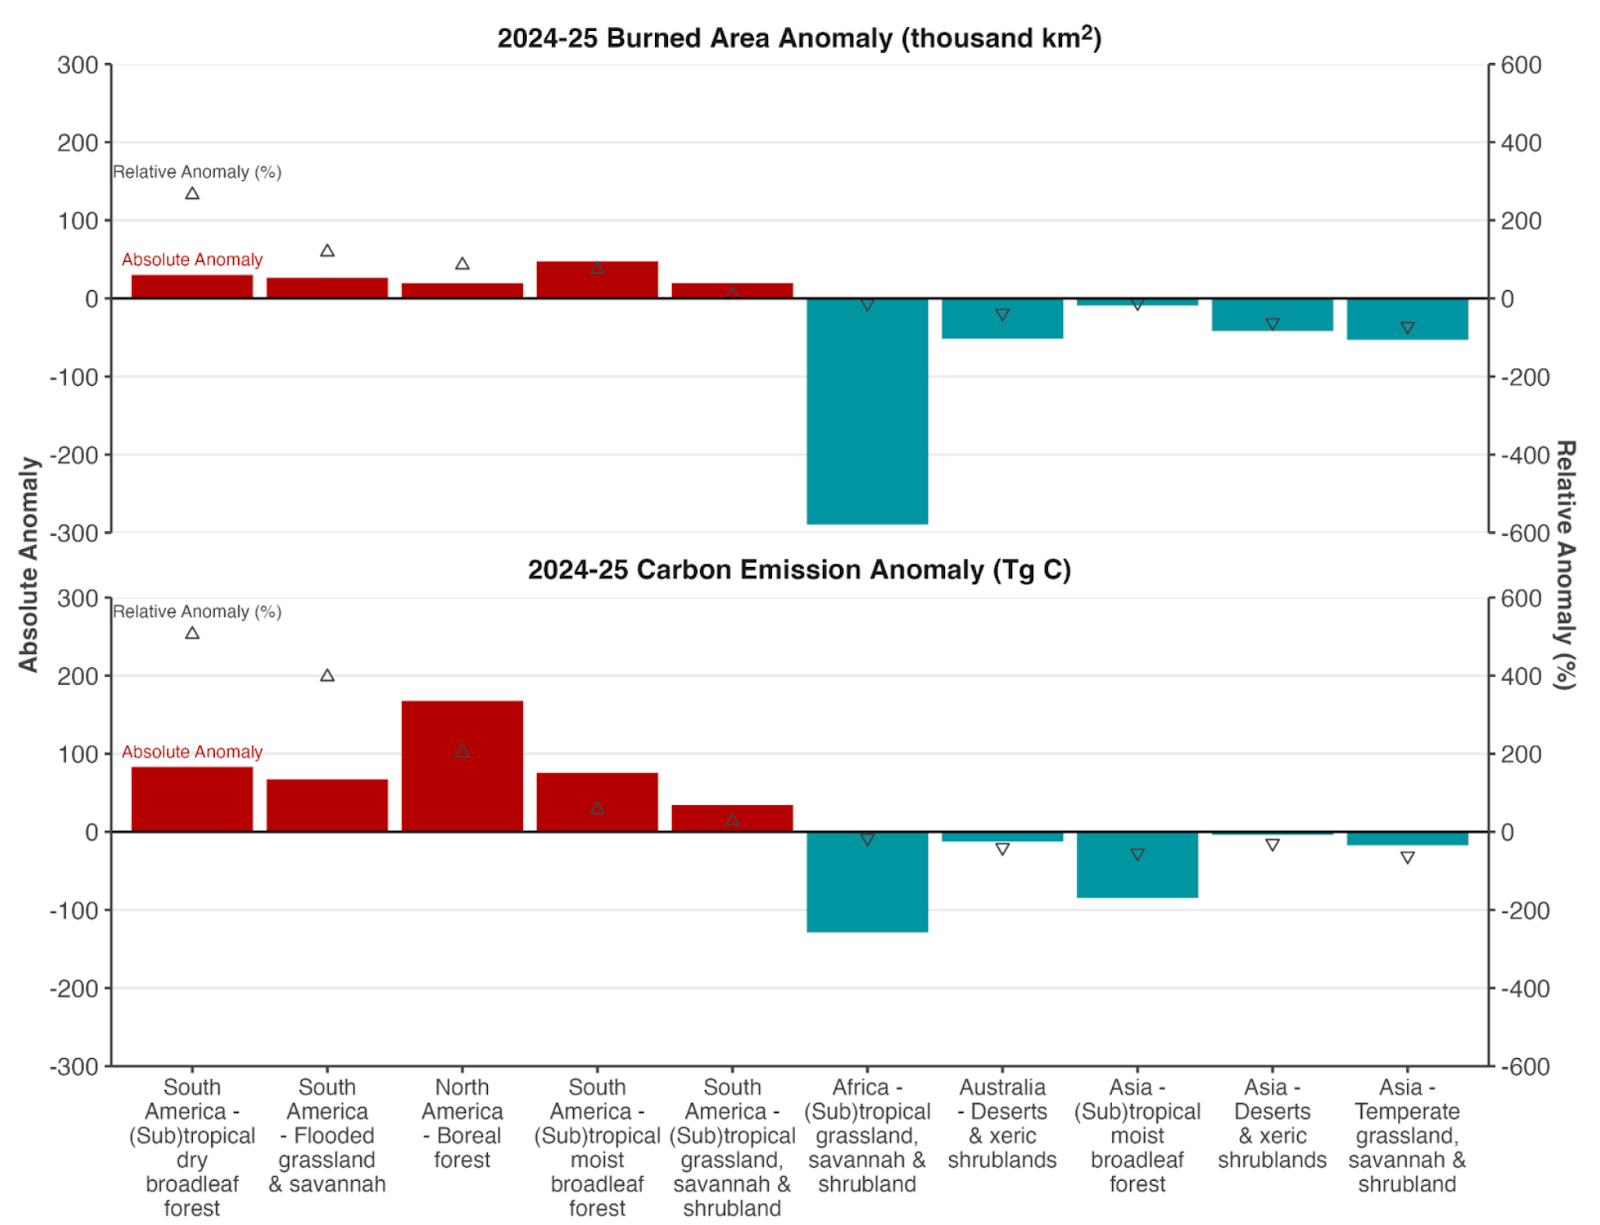
The chart below shows global burned area (top) and carbon emissions (bottom) during the 2024-25 wildfire season, compared to the average over 2002-24, for different world regions. Red bars indicate that the 2024-25 wildfire season had higher-than-average burned area or emissions for the given region, while blue indicates lower-than-average numbers.
Burned area, in thousands of km2 (top) and carbon emissions in teragrams (equivalent to millions of tonnes) of carbon (bottom) during the 2024-25 wildfire season, compared to the 2002-24 average, for different world regions and biomes. The triangles (right y-axis) indicate the percentage of the relative anomaly compared to the average. Source: Kelley et al. (2025)
Savannas, grasslands and shrublands account for more than 80% of the burned area in a typical year, with forests and croplands making up the rest.
According to the report, burned area in tropical and subtropical grasslands, savannah and shrublands was 10% below the 2002-24 average over 2024-25, but still contributed 70% towards the total global burned area.
The 2024-25 wildfire season was the second consecutive year that African savannahs “experienced a low fire season”, the report notes, with below average burned area and carbon emissions.
Meanwhile, the report finds that the greatest increases in burned area and carbon emissions during the 2024-25 wildfire season were seen in the Canada’s boreal forests, the moist tropical forests in the Amazon region, the Chiquitano dry forests of Bolivia and the Cerrado – a tropical savannah in central Brazil.
The graphic below shows some key figures from the 2024-25 wildfire season.
Key figures from the 2024-25 wildfire season. Source: State of wildfires project, summary for policymakers (2025).
The team identified four “focal events” – extreme wildfire events that were chosen both for the severity of the fire and the impacts on people and the environment.
For each focal point, the study authors assessed the drivers of the wildfire. They also used attribution – a field of climate science that aims to identify the “fingerprint” of climate change on an extreme event – to determine the contribution of human-caused climate change.
Finally, the authors estimated the likelihood of similar events occurring in the future as the climate continues to warm over the coming century.
Kelley told the press briefing that “capturing fires themselves can be quite tricky”, because they are affected by a range of different factors.
The report notes that wildfires are affected by changes in weather, with hot and dry weather providing the best conditions for wildfires. It adds that changes in land use are also important, as they can affect ignition.
Kelley explained that the report authors used “multiple types of attribution” to capture these different factors, using a range of fire models, weather forecasting models and land use data.
North America
In North America, 2024-25 was an “extreme” fire year, the report says.
Both burned area and carbon emissions reached their second-highest levels since records began in 2002 and 2003, respectively. Across the continent, the burned area was 35% higher than the average since 2002 and the carbon emissions were more than double the average emissions since 2003.
In Canada, 46,000km2 of land burned during the 2024-25 fire season, releasing 282m tonnes of carbon (Mt). The burned area was 85% higher than average, but the associated emissions were more than 200% higher than average, according to the report.
The report also notes that the wildfire season started early in Canada in 2024, due to earlier-than-normal snowmelt, as well as persistent, multiyear drought and “holdover fires” that reignited in the spring after smouldering through the winter months.
In the US, more than 64,000 individual wildfires contributed to a total burned area larger than 36,000km2. More than 8,000 wildfires in Mexico led to a record 16,500km2 of burned area.
The regions experiencing record or near-record burned area and carbon emissions were varied: from the Canadian tundra and the north-western US mountain ranges to California’s grasslands and Mexico’s tropical forests. In the far-northern boreal forest – which contains around 20% of the world’s forest carbon – the season trailed only the record-breaking 2023-24 fire season in burned area and associated emissions.
The researchers select the January 2025 southern California wildfires as one of the four “focal events” of the report.
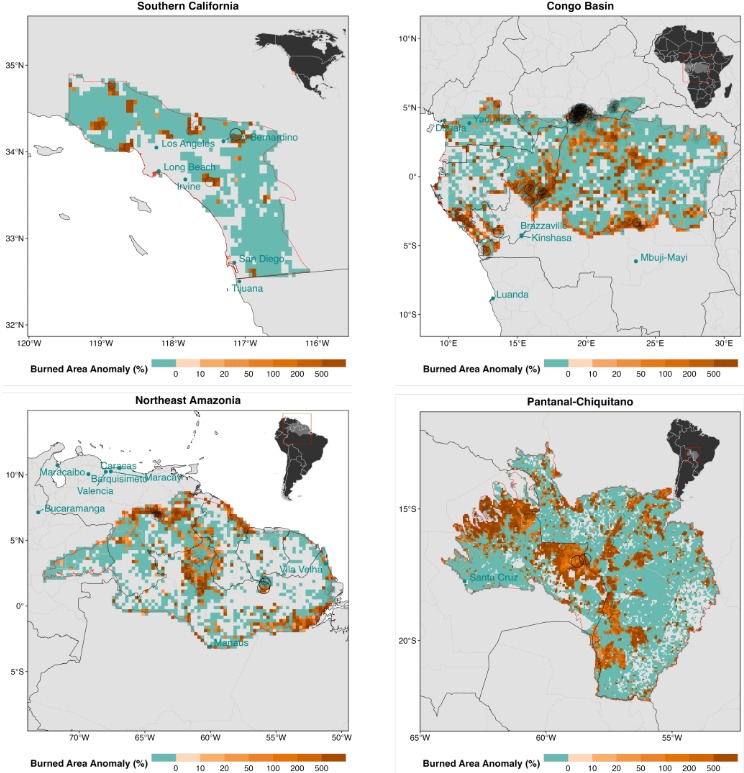
The maps below show the locations of the four focal events: southern California, the Congo Basin, north-east Amazonia and the Pantanal-Chiquitano. The colours show the percentage difference from the average burned area, with blue indicating less burned area than average and darker browns showing more burned area.
The burned area anomaly, expressed as a percentage difference from the 2002-24 average, for each of four focal events (clockwise from top left): southern California, Congo Basin, Pantanal-Chiquitano and north-east Amazonia. The inset on each chart shows the location of the event. Blue colours indicate negative anomalies (less burned area than usual) and browns indicate positive anomalies. Source: Kelley et al. (2025)
In early January 2025, more than a dozen fires broke out in and around Los Angeles. Although January is “well outside the typical fire period”, the fires “became the most expensive wildfires ever recorded in just a few short days”, Prof Crystal Kolden – a study author and the director of the University of California, Merced’sFire Resilience Center – wrote in the report.
The two largest fires, named the Palisades fire and the Eaton fire, resulted in at least 30 deaths, more than 11,500 homes destroyed and more than 153,000 people being evacuated from their homes.
The fires resulted in estimated economic losses of $140bn, placing “substantial pressure on the already volatile home insurance market in California”, according to the report. It notes that the fires also contributed to the “housing and affordability crisis” in southern California.
The report says that the severity of the January fires was largely due to intensifying extremes in the water cycle – an unusually wet period that allowed vegetation to flourish, followed by an unusually arid winter that dried out that vegetation, turning it into fuel. It notes:
“Between 5 and 25 January, favourable weather, fuel availability and ignition sources aligned, leading to create ideal conditions for ignition and rapid fire spread.
“The substantial suppression efforts deployed is unaccounted for in our modelling framework and could be one of the possible reasons the fires did not escalate even further.”
Previous attribution analysis found that the January 2025 fires were “likely influenced” by human-driven climate change. The report authors also find that the burned area in the southern California event was 25 times greater due to climate change.
However, whether extreme fire activity in southern California continues to intensify depends largely on how the region’s plants and trees respond to increased atmospheric CO2, the report says. It also notes that climate models disagree as to whether wintertime rainfall will increase or decrease in future climates.
South America
The report finds that South America had a total area burned by wildfires of 120,000km2 during the 2024-25 fire season – 35% higher than average.
That translated into the release of 263Mt of carbon – the “highest carbon emissions on record for the continent” and 84% above average, the report says.
Jones, a study author, said in a press briefing that South America “hasn’t seen carbon emissions like this on record before”.
The report underlines that South America’s fire season was “unprecedented” in many ways, such as fire extent, emission levels, intensity and their impacts on society and the environment, although not in the number of fires.
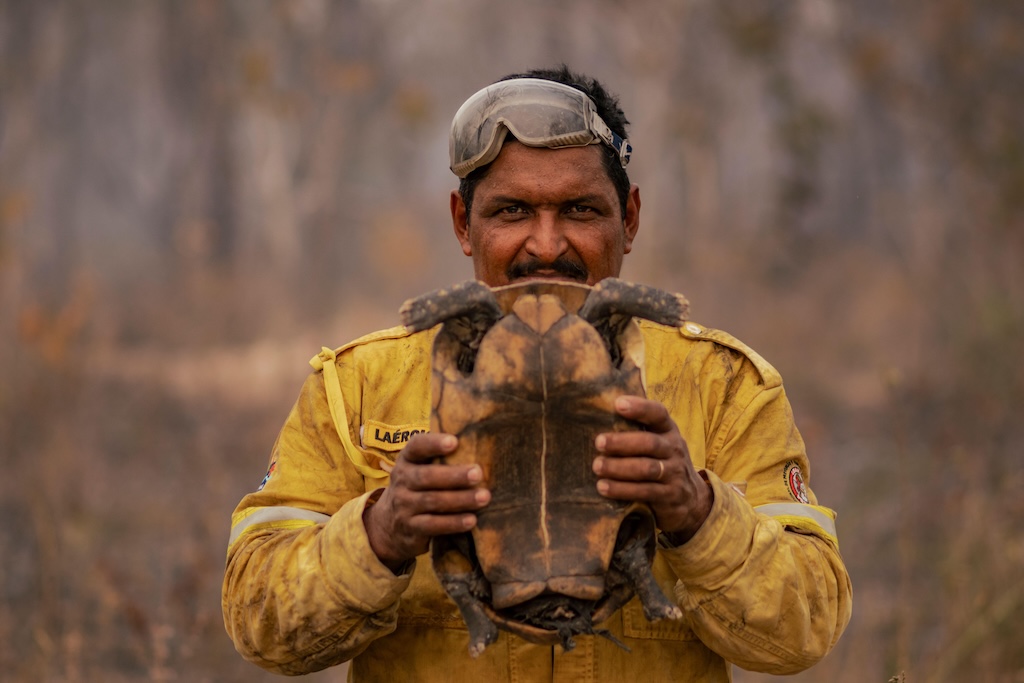
For example, fires in the north-east Amazon impacted air quality, crops, houses and native vegetation, affecting people living in the region, including Indigenous peoples such as the Yanomami, the report says.
Laercio Fernandes, a volunteer firefighter and Indigenous man, holds a shell of a turtle found dead after a forest fire hit the Kadiwéu Indigenous land, in Mato Grosso do Sul, Brazil, in 2024. Credit: Diego Cardoso / Alamy Stock Photo
The country with the largest area burned by wildfires during the 2024-25 fire season was Brazil, with a total burned area of 243,000km2, followed by Bolivia, with a total of 107,000km2 of burned area, and Venezuela, with a total of 43,000km2 of burned area.
The most-affected biomes in the region were the Amazon rainforest, with 47,000km2 of wildfires above the average since 2002.
Second was the Chiquitano and Chaco dry forests – encompassing parts of Bolivia, Brazil, Paraguay and Argentina. These biomes experienced a “record-breaking” fire season with more than 46,000km2 of burned area. These fires resulted in 100Mt of carbon emissions – six times higher than the average since 2003.
More than 46,000km2 of the Pantanal – the largest tropical wetland located in Brazil, Bolivia and Paraguay – burned in 2024-25, with associated carbon emissions of 67Mt above the average.
According to the report, fire activity in the region was primarily driven by “anomalous dry weather”.
In the north-eastern Amazon, the severity of the fire season between January and April 2024 was compounded by natural sources of climate variability, such as El Niño and the Atlantic Meridional Mode, which contributed to very high temperatures and absence of rainfall. There, deep soil moisture dropped to 1%.
Meanwhile, in Pantanal and Chiquitano, “extreme dry weather” since 2023 and “multiple years of below-average rainfall” contributed to the severe fires, the report says. Study author Dr Francesca Di Giuseppe said in a briefing that the “wet season that usually happens between February and May failed completely to recharge the soil that kept completely dry and this drove most of the fire season” in the region.
The authors conduct an attribution analysis and find that the fire weather conditions in the north-eastern Amazon that season were “significantly more likely” due to climate change. In the Pantanal and Chiquitano, the conditions were 4.2-5.5 times more likely due to climate change.
Africa
Overall, the scale of fires across Africa was “well-below average” in 2024 and 2025, the report finds, except in certain areas, including the Congo Basin, northern Angola and South Africa.
In 2024, a record-high amount of land was burned in the Congo Basin – a biodiverse region in central Africa spanning six countries that holds the world’s second-largest tropical forest. This burned area was 28% higher than the annual average and there were 4,000 fires in total, 20% more than usual, in 2024.
Fires also caused “hazardous” air pollution and contributed to the Congo Basin’s highest loss of primary forest in a decade.
The analysis in the report finds that it is “virtually certain” that human-caused climate change contributed to the extreme fire weather in this region in July and August 2024.
The hot, dry and windy conditions were 3-8 times more likely to occur as a result of climate change and the area scorched by fires was three times greater than it would have been otherwise, the findings show.
Climate change has also driven an increase of more than 50% in the average annual burned area in the Congo Basin, which the researchers say is “one of the most robust signals of climate influence” in the fire trends they analysed.
Drought was a major factor behind the fires, the report finds, and water stress is expected to be the main driver shaping future fires in the Congo Basin.
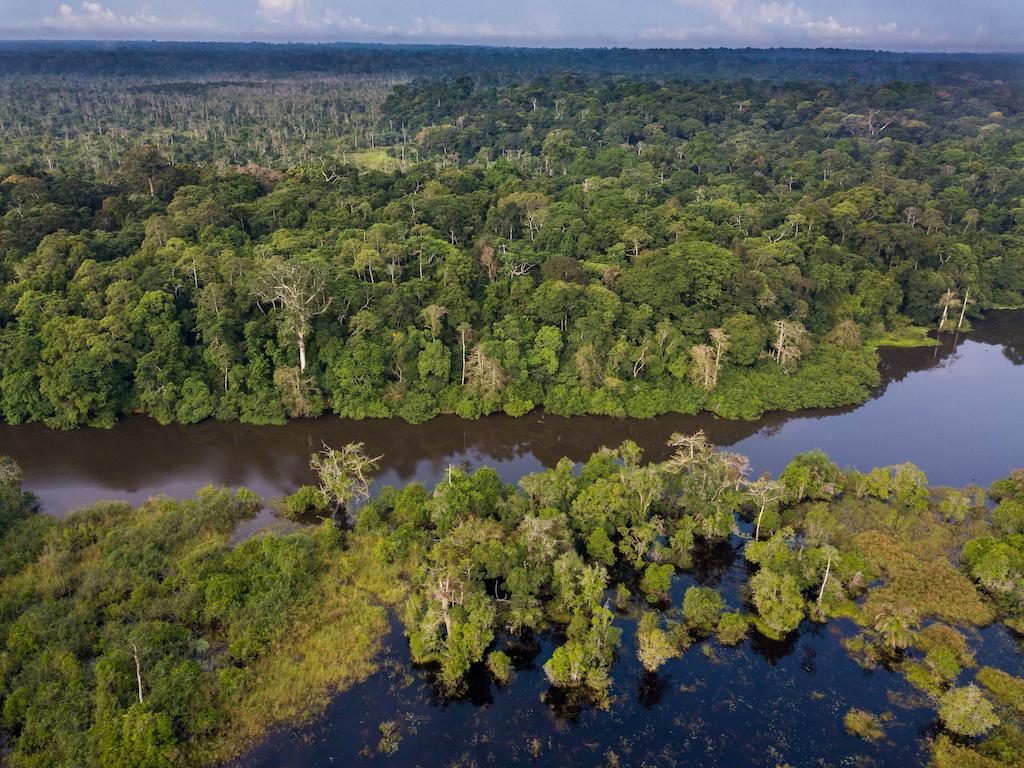
Congo rainforest along Rembo Ngowe river in Akaka, Loango National Park, Gabon. Credit: Lee Dalton / Alamy Stock Photo.
These fires are “part of a long-term trend of increasing fire encroachment into African moist forests, driven by climate change and human pressure”, says Prof Michael Wimberly, a professor at the University of Oklahoma who was not involved in the report, but has researched wildfires in Africa. He tells Carbon Brief:
“The increased fire activity in the Congo Basin is troubling because of the vast expanses of unfragmented forests and peatlands that store massive amounts of carbon, provide habitat for threatened species and supply vital resources to local populations.”
The report notes that there is “sparse reporting and poor media coverage” on the impacts of fires in the Congo Basin in 2024, despite millions of people being impacted.
In South Africa, 34 people were killed and thousands of livestock and homes were destroyed in fires last year. In Ivory Coast, 23 people were killed and 50km2 of land was burned.
Dr Glynis Humphrey, a postdoctoral research fellow at the University of Cape Town, who was not involved in the study, adds that a below-average burned area across Africa “does not necessarily indicate a decline in fire risk or impact”. She tells Carbon Brief:
“In some ecosystems, fewer but more intense fires are being observed, which can still have severe ecological and atmospheric consequences.”
Using climate models, the researchers project that fires to the extent of those in the Congo Basin last year could occur up to 50% more often by 2100, under a medium-emissions pathway.
The region is also projected to see more increases in extreme wildfire risk by the end of this century. Gabon, Equatorial Guinea and the central part of the Democratic Republic of the Congo could see some of the largest increases in burned area, which, the report estimates, could double or quadruple in some cases.
Humphrey notes that fire patterns are “shifting” in response to climate change, which is “leading to significant consequences for ecosystems that don’t typically burn – like the forests in the Congo Basin”. She tells Carbon Brief:
“This is of concern, as primary forests harbour critical biodiversity that supports ecosystem functioning and provide services to people…These forests are also sanctuaries for endangered species.”
Nigel Farage urges you to ignore facts and reality and be a climate science denier like him and his Deputy Richard Tice. He says that Reform UK has received £Millions and £Millions from the fossil fuel industry to promote climate denial and destroy the planet.Donald Trump urges you to be a Climate Science denier like him. He says that he makes millions and millions for destroying the planet, Burn, Baby, Burn and Flood, Baby, Flood.Elon Musk urges you to be a Fascist like him, says that you can ignore facts and reality then.
Human-caused greenhouse gas (GHG) emissions in 2024 continued to drive global warming to record levels.
This is the stark picture that emerges in the third edition of the “Indicators of Global Climate Change” (IGCC) report, published in Earth System Science Data.
In doing so, the IGCC fills the gap between the IPCC’s sixth assessment (AR6) in 2021 and the seventh assessment, expected in 2028.
Following IPCC methods, this year’s assessment brings together a team of over 60 international scientists, including former IPCC authors and curators of vital global datasets.
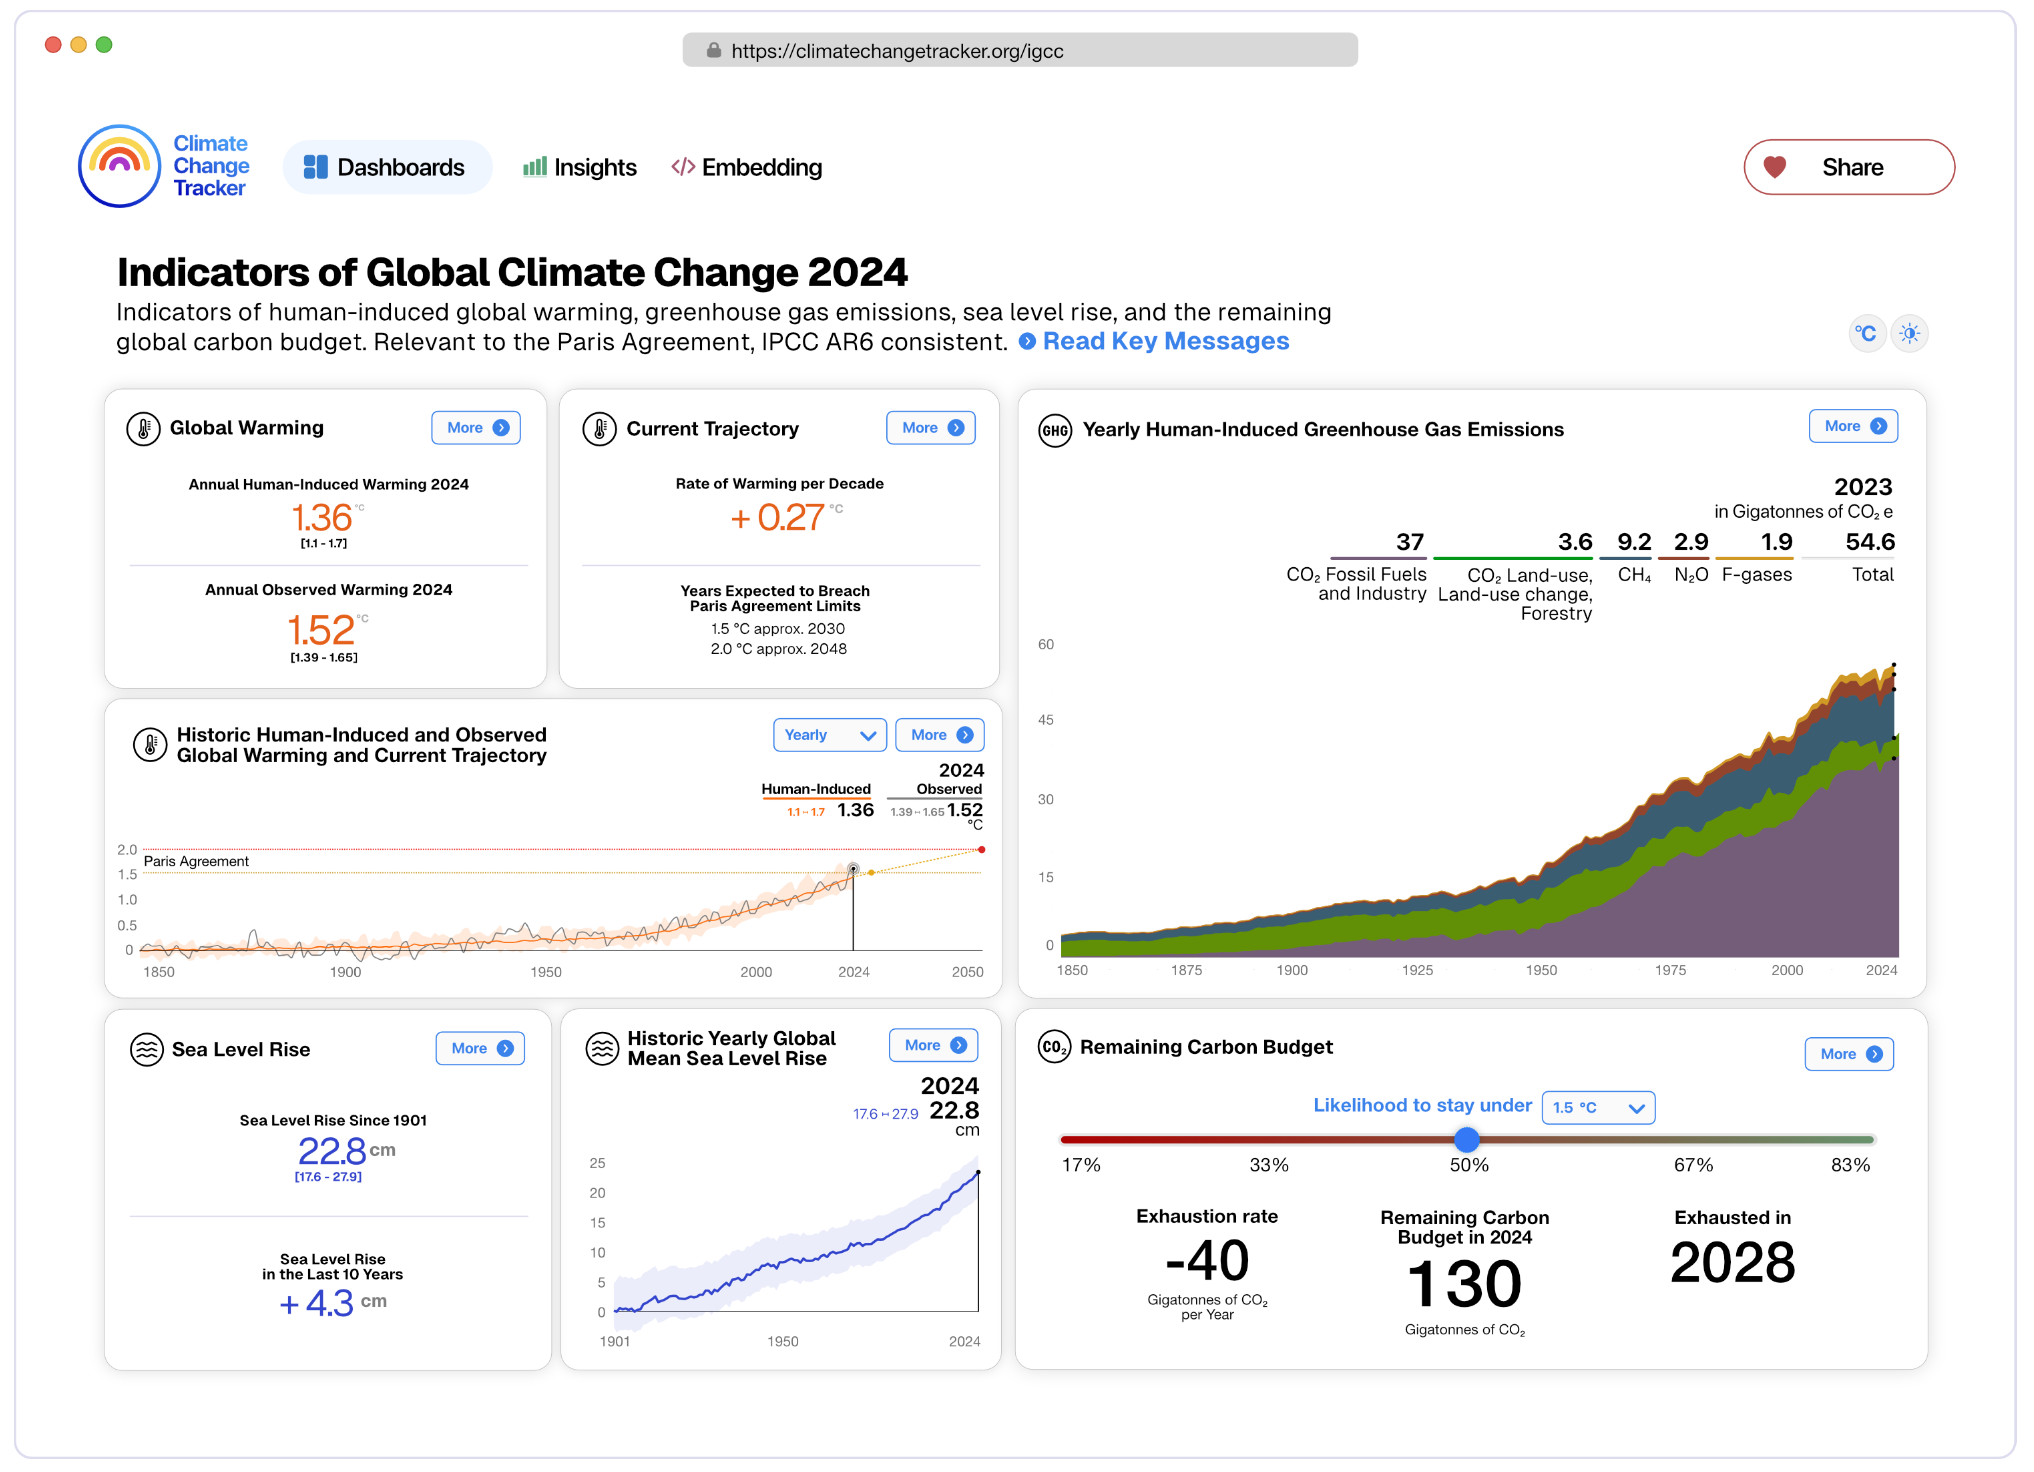
As in previous years, it is accompanied by a user-friendly data dashboard focusing on the main policy-relevant climate indicators, including GHG emissions, human-caused warming, the rate of temperature change and the remaining global carbon budget.
Below, we explain this year’s findings, highlighting the role that humans are playing in some of the fundamental changes the global climate has seen in recent years.
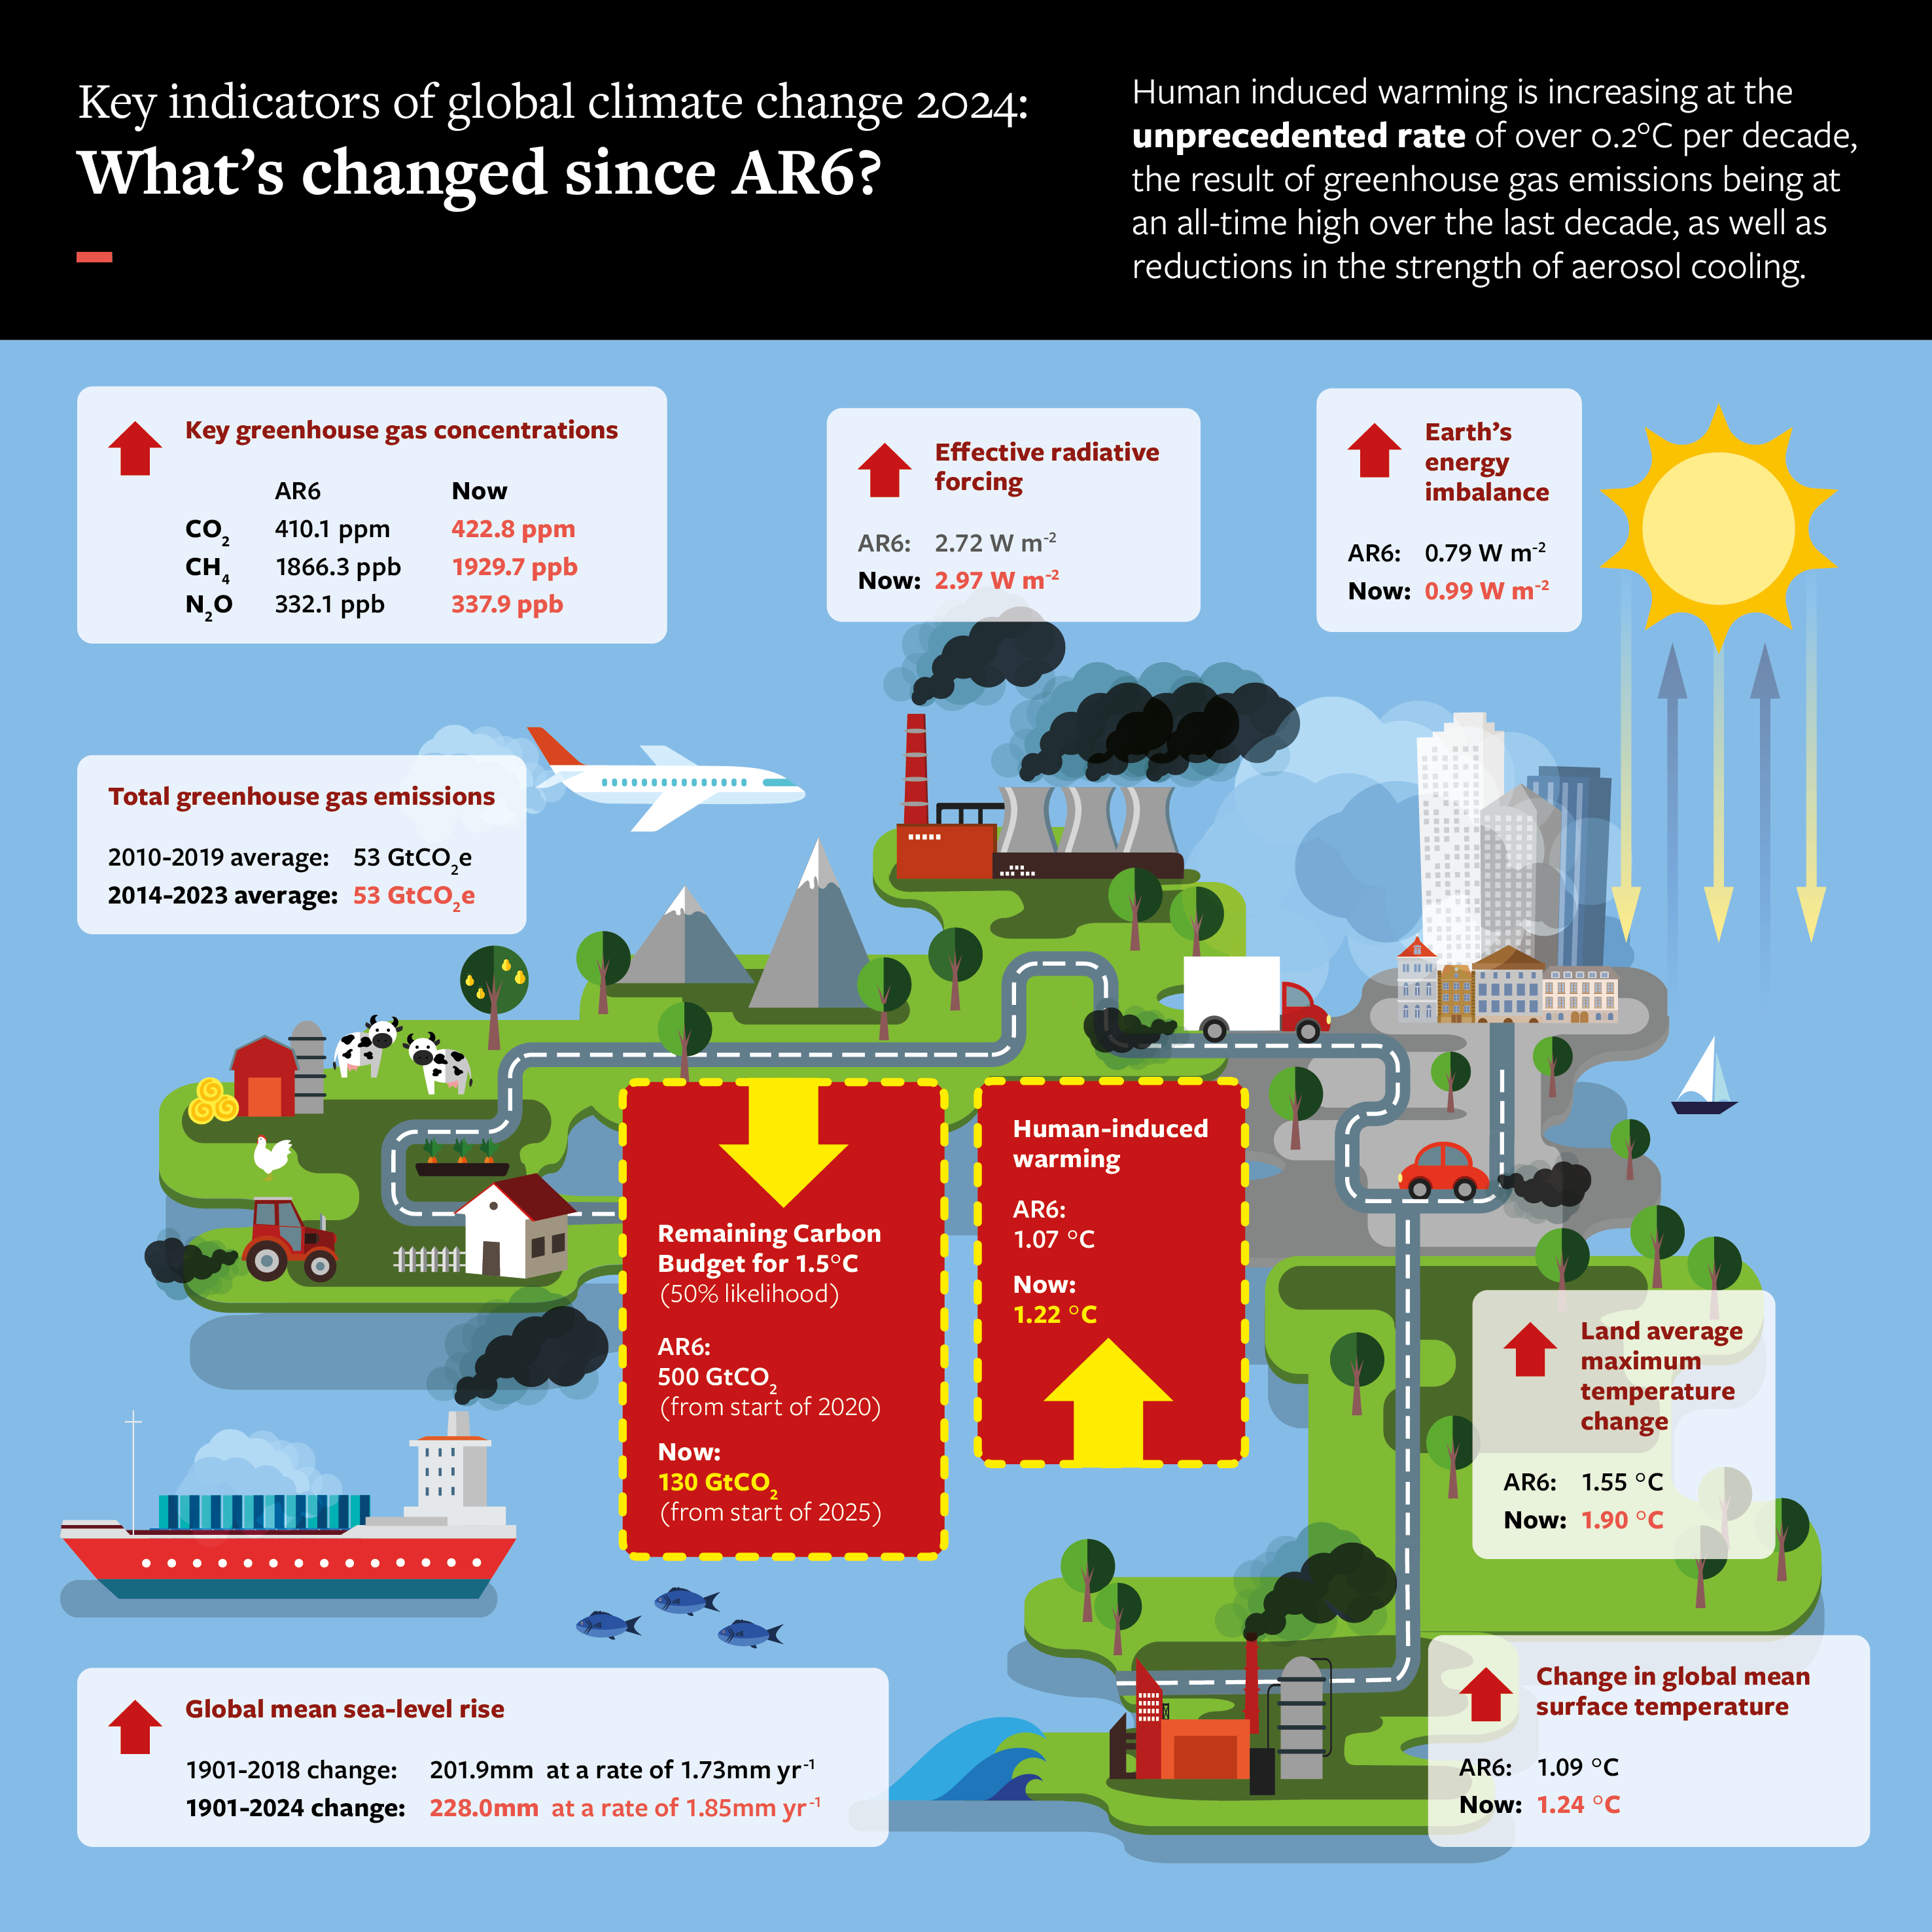
Headline results from an analysis of key climate indicators in 2024, compared to the IPCC AR6 climate science report. Source: Forster et al. (2025)
(For previous IGCC reports, see Carbon Brief’s detailed coverage in 2023 and 2024.)
Our best estimate is a rise of 1.52C (with a range of 1.39-1.65C), of which human activity contributed around 1.36C. The rest is the result of natural variability in the climate system, which also plays a role in shaping global temperatures from one year to the next.
Our estimate of 1.52C differs slightly from the 1.55C given by the World Meteorological Organisation (WMO) state of the global climate 2024 report, published earlier this year. This is because they make slightly different selections on which of the available global land and ocean temperature datasets to include. (The warming estimate has varied by similar amounts in past years and future work will aim to harmonise the approaches.)
The height of 2024’s temperatures, while unprecedented in at least the last 2,000 years, is not surprising. Given the high level of human-induced warming, we might currently expect to see annual temperatures above 1.5C on average one year in six.
However, with 2024 following an El Niño year, waters in the North Atlantic were warmer than average. These conditions raise this likelihood to an expectation that 1.5C is surpassed every other year.
From now on, we should regard 2024’s observed temperatures as unexceptional. Temperature records will continue to be broken as human-caused temperature rise also increases.
Longer-term temperature change
Despite observed global temperatures likely rising by more than 1.5C in 2024, this does not equate to a breach of the Paris Agreement’s temperature goal, which refers to long-term temperature change caused by human activity.
IGCC also looks at how temperatures are changing over the most recent decade, in line with IPCC assessments.
Over 2015-24, global average temperatures were 1.24C higher than pre-industrial levels. Of this, 1.22C was caused by human activity. So, essentially, all the global warming seen over the past decade was caused by humans.
Observed global average temperatures over 2015-24 were also 0.31C warmer than the previous decade (2005-14). This is unsurprising given the high rates of human-caused warming over the same period, reaching a best estimate of 0.27C per decade.
This rate of warming is large and unprecedented. Over land, where people live, temperatures are rising even faster than the global average, leading to record extreme temperatures.
But every fraction of a degree matters, increasing climate impacts and loss and damage that is already affecting billions of people.
Driven by emissions
Undoubtedly, these changes are being caused by GHG emissions remaining at an all-time high.
Over the last decade, human activities have released, on average, the equivalent of around 53bn tonnes of CO2 into the atmosphere each year. (The figure of 53bn tonnes expresses the total warming effect of CO2 and other greenhouse gases, such as methane and nitrous oxide, using CO2 as a reference point.)
Emissions have shown no sign of the peak by 2025 and rapid decline to net-zero required to limit global warming to 1.5C with no or limited “overshoot”.
Most of these emissions were from fossil fuels and industry. There are signs that energy use and emissions are rising due to air conditioning use during summer heatwaves. Last year also saw high levels of emissions from tropical deforestation due to forest fires, partly related to dry conditions caused by El Niño.
The amount of CO2 in the atmosphere, alongside the other major GHGs of methane (CH4) and nitrous oxide (N2O), is continuing to build up to record levels. Their concentrations have increased by 3.1, 3.4 and 1.7%, respectively, since the 2019 values reported in the last IPCC assessment.
At the same time, aerosol emissions, which have a cooling effect, are continuing to fall as a result of important efforts to tackle air pollution. This is currently adding to the rate of GHG warming.
Notably, cutting CH4 emissions, which are also short-lived in the atmosphere, could offset this rise. But, again, there is no real sign of a fall – despite major initiatives such as the Global Methane Pledge.
The effect of all human drivers of climate change on the Earth’s energy balance is measured as “radiative forcing”. Our estimate of this radiative forcing in 2024 is 2.97 Watts per square metre (W/m2), 9% above the value recorded in 2019 that was quoted in the last IPCC assessment.
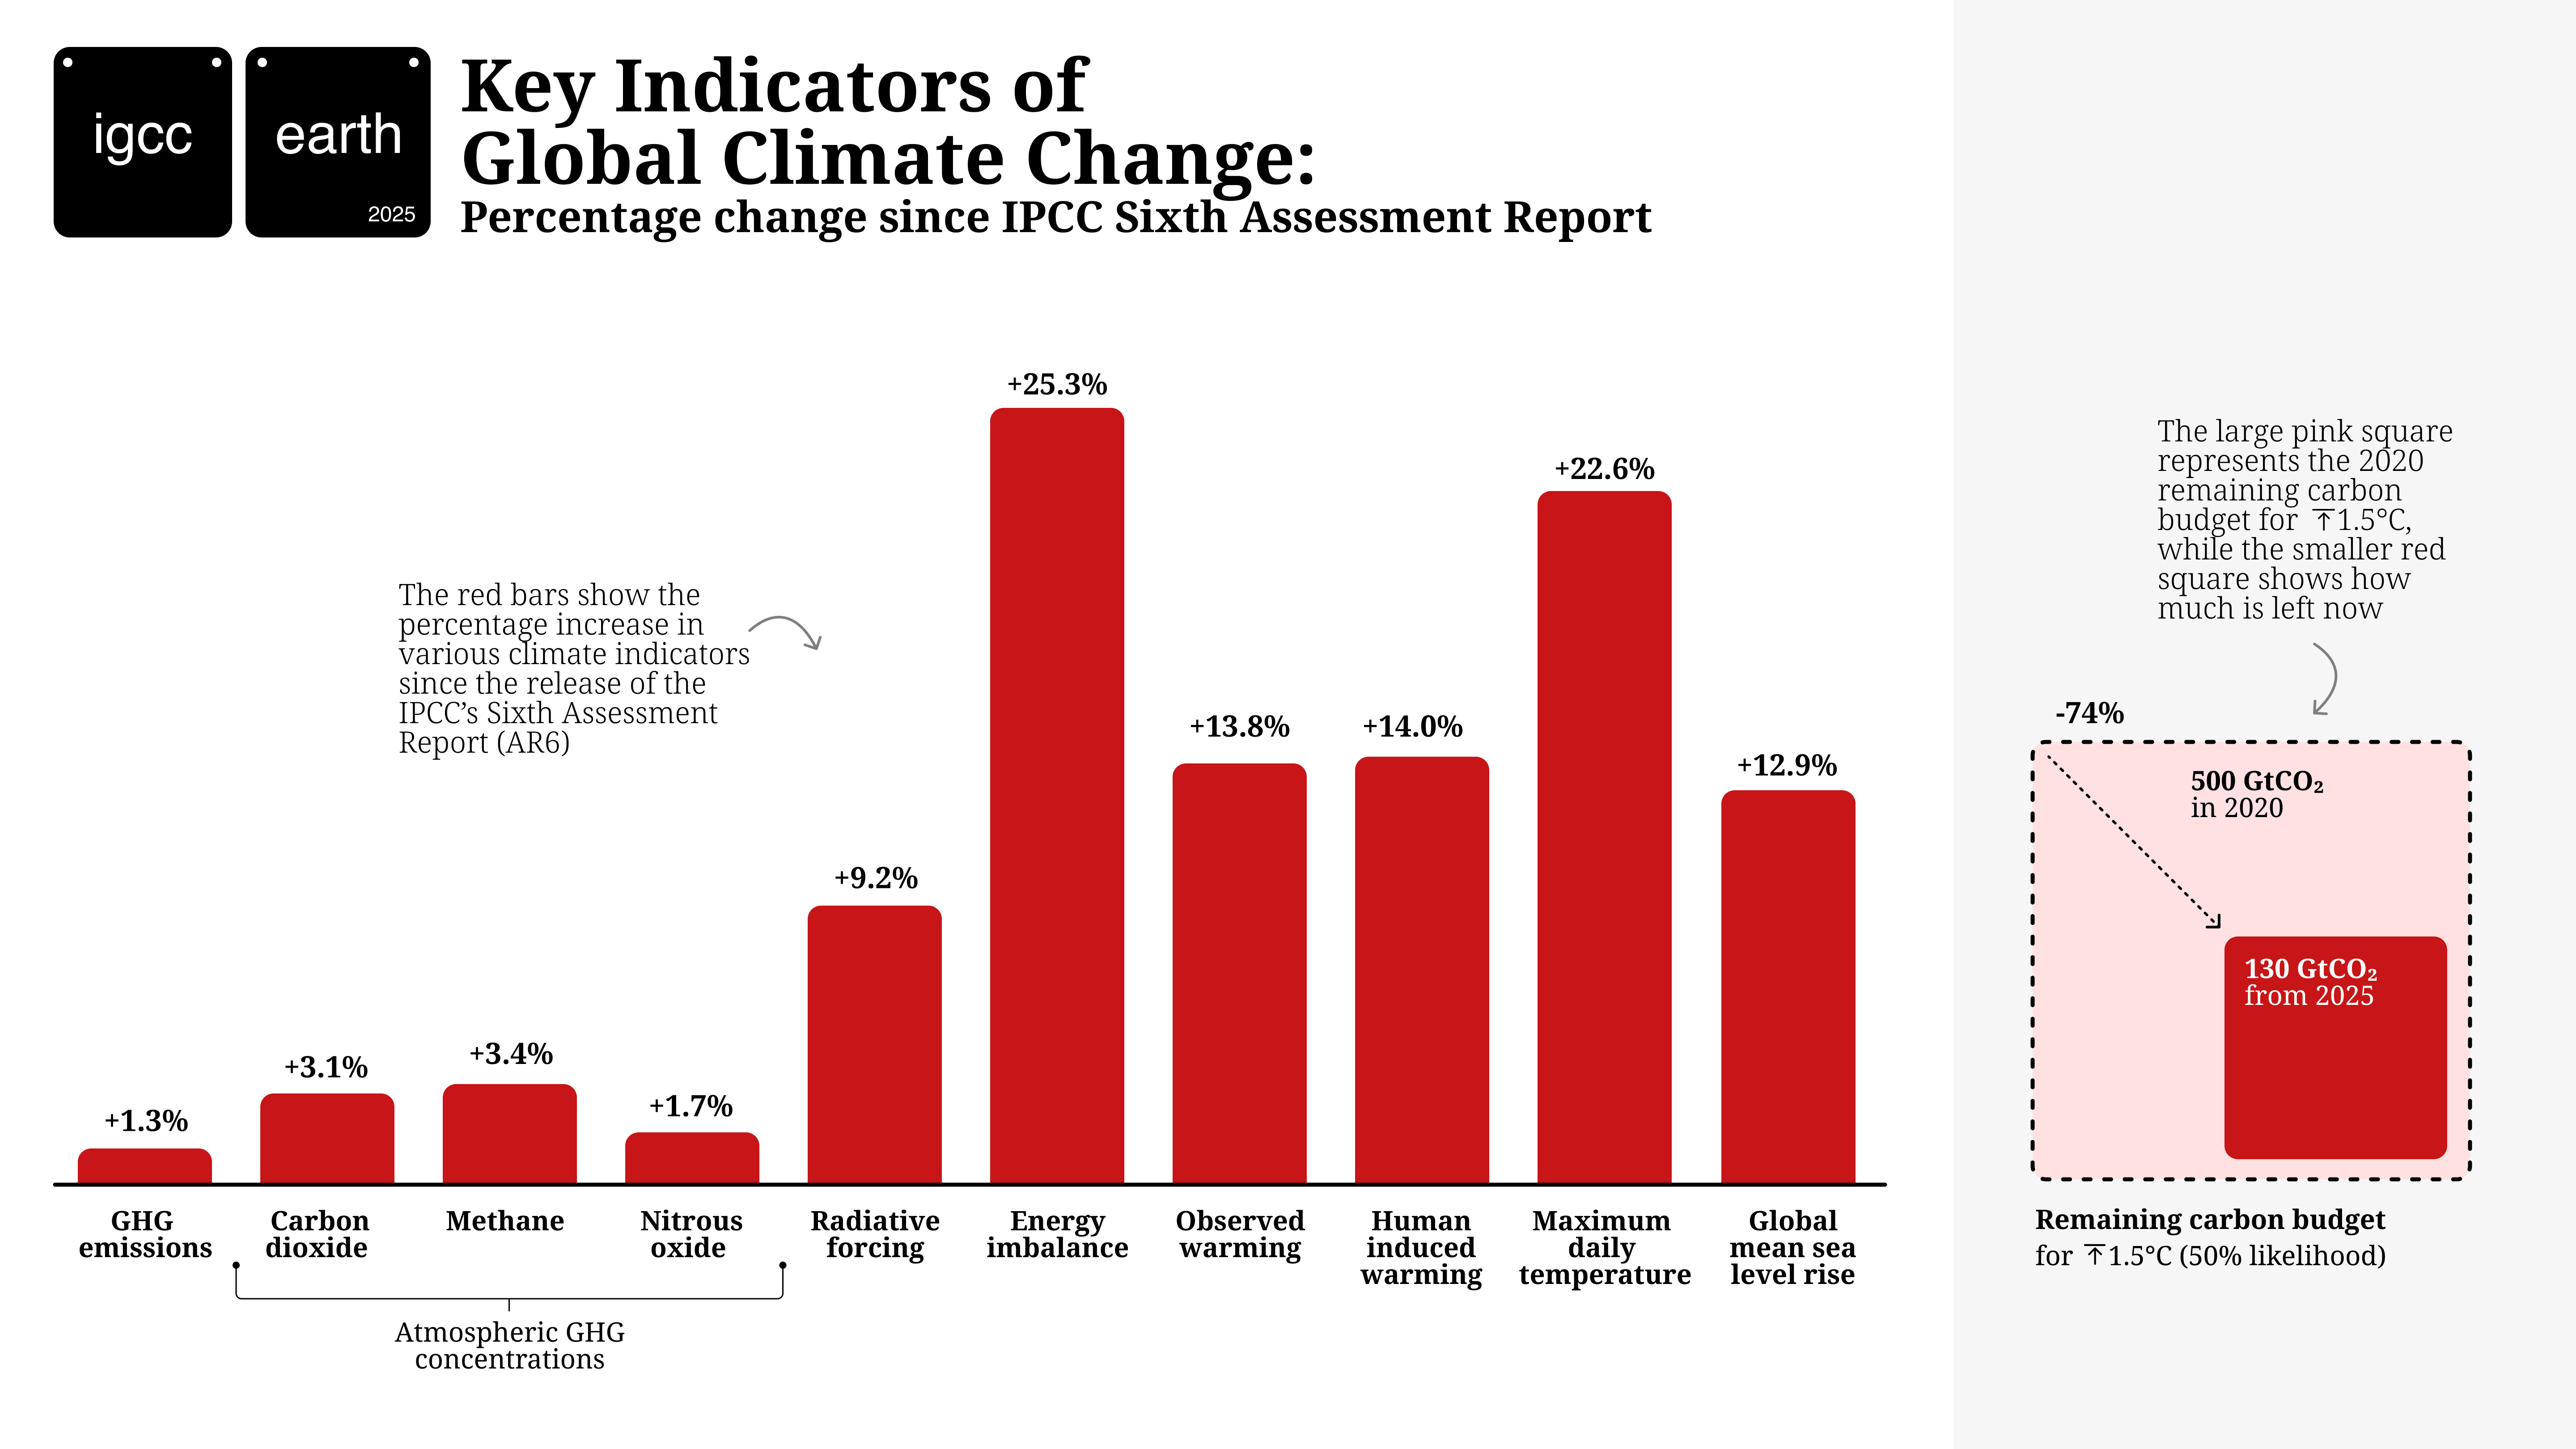
This is shown in the figure below, which illustrates the percentage change in an array of climate indicators since the data update given in the last IPCC climate science report.
Percentage changes in key climate indicators in 2024, compared to the IPCC AR6 climate science report. The remaining carbon budget given on the right is the only indicator to show a reduction and is the change since IPCC AR6, presented as a shrinking box. Source: Forster et al. (2025)
Continued emissions and rising temperatures are meanwhile rapidly eating into the remaining carbon budget, the total amount of CO2 that can be emitted if global warming is to be kept below 1.5C.
Our central estimate of the remaining carbon budget from the start of 2025 is 130bn tonnes of CO2.
This has fallen by almost three-quarters since the start of 2020. It would be exhausted in a little more than three years of global emissions, at current levels.
However, given the uncertainties involved in calculating the remaining carbon budget, the actual value could lie between 30 and 320bn tonnes, meaning that it could also be exhausted sooner – or later than expected.
Beyond global temperatures
Our assessment also shows how surplus heat is accumulating in the Earth’s system at an accelerating rate, becoming increasingly out of balance and driving changes around the world.
The data and their changes are displayed on a dedicated Climate Change Tracker platform, shown below.
Snapshot of Climate Change Tracker
The radiative forcing of 2.97 W/m2 adds heat to the climate system. As the world warms in response, much of this excess heat radiates to space, until a new balance is restored. The residual level of heating is termed the Earth’s “energy imbalance” and is an indication of how far out of balance the climate system is and the warming still to come.
This residual rate of heat entering the Earth system has now approximately doubled from levels seen in the 1970s and 1980s, to around 1W/m2on average during the period 2012-24.
Although the ocean is storing an estimated 91% of this excess heat, mitigating some of the warming we would otherwise see at the Earth’s surface, it brings other impacts, including sea level rise and marine heatwaves.
Global average sea level rise, from both the melting of ice sheets and thermal expansion due to deep ocean warming, is included in the IGCC assessment for the first time.
We find that it has increased by around 26mm over the last six years (2019-24), more than double the long-term rate. This is the indicator that shows the clearest evidence of an acceleration.
Overall, our indicators provide multiple lines of evidence all pointing in the same direction to provide a clear and consistent – but unsurprising and worsening – picture of the climate system.
It is also now inevitable that global temperatures will reach 1.5C of long-term warming in the next few years unless society takes drastic, transformative action – both in cutting GHG emissions and stopping deforestation.
Every year of delay brings reaching 1.5C – or even higher temperatures – closer.
This year, countries are unveiling new “nationally determined contributions” (NDCs), the national climate commitments aimed at collectively reducing GHG emissions and tackling climate change in line with the Paris Agreement.
While the plans put forward so far represent a step in the right direction, they still fall far short of what is needed to significantly reduce, let alone stop, the rate of warming.
At the same time, evidence-based decision-making relies on international expertise, collaboration and global datasets.
Our annual update relies on data from NASA and the National Oceanic and Atmospheric Administration (NOAA) and input from many of their highly respected scientists. It is this type of collaboration that allows scientists to generate well-calibrated global datasets that can be used to produce trusted data on changes in the Earth system.
It would not be possible to maintain the consistent long-term datasets employed in our study if their work is interrupted.
At a time when the planet is changing at the fastest rate since records began, we are at risk of failing to track key indicators – such as greenhouse gas concentrations or deep ocean temperatures – and losing core expertise that is vital for understanding the data.
Forster, P. M. et al. (2025) Indicators of Global Climate Change 2024: Annual update of key indicators of the state of the climate system and human influence, Earth System Science Data, doi:10.5194/essd-17-2641-2025
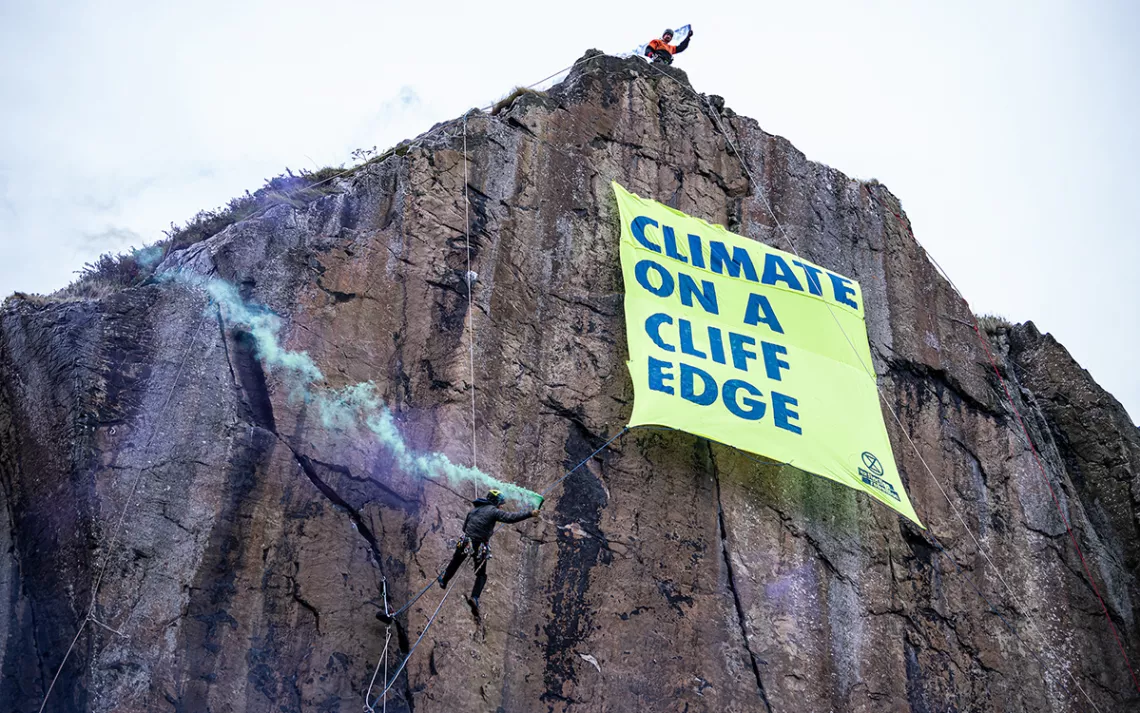
Neo-Fascist Climate Science Denier Donald Trump says Burn, Baby, Burn.Experienced climbers scale a rock face near the historic Dumbarton castle in Glasgow, releasing a banner that reads “Climate on a Cliff Edge.” One activist, dressed as a globe, symbolically looms near the edge, while another plays the bagpipes on the shores below. | Photo courtesy of Extinction Rebellion and Mark RichardsElon Musk urges you to be a Fascist like him, says that you can ignore facts and reality then.