Analysis: The climate papers most featured in the media in 2025

Spread the love

Original article republished from Carbon Brief under a CC license

The year 2025 saw the return to power of Donald Trump, a jewellery heist at the Louvre museum in Paris and an engagement that “broke the internet”.

Amid the biggest stories of the year, climate change research continued to feature prominently in news and social media feeds.

Using data from Altmetric, which scores research papers according to the attention they receive online, Carbon Brief has compiled its annual list of the 25 most talked-about climate-related studies of the past year. 

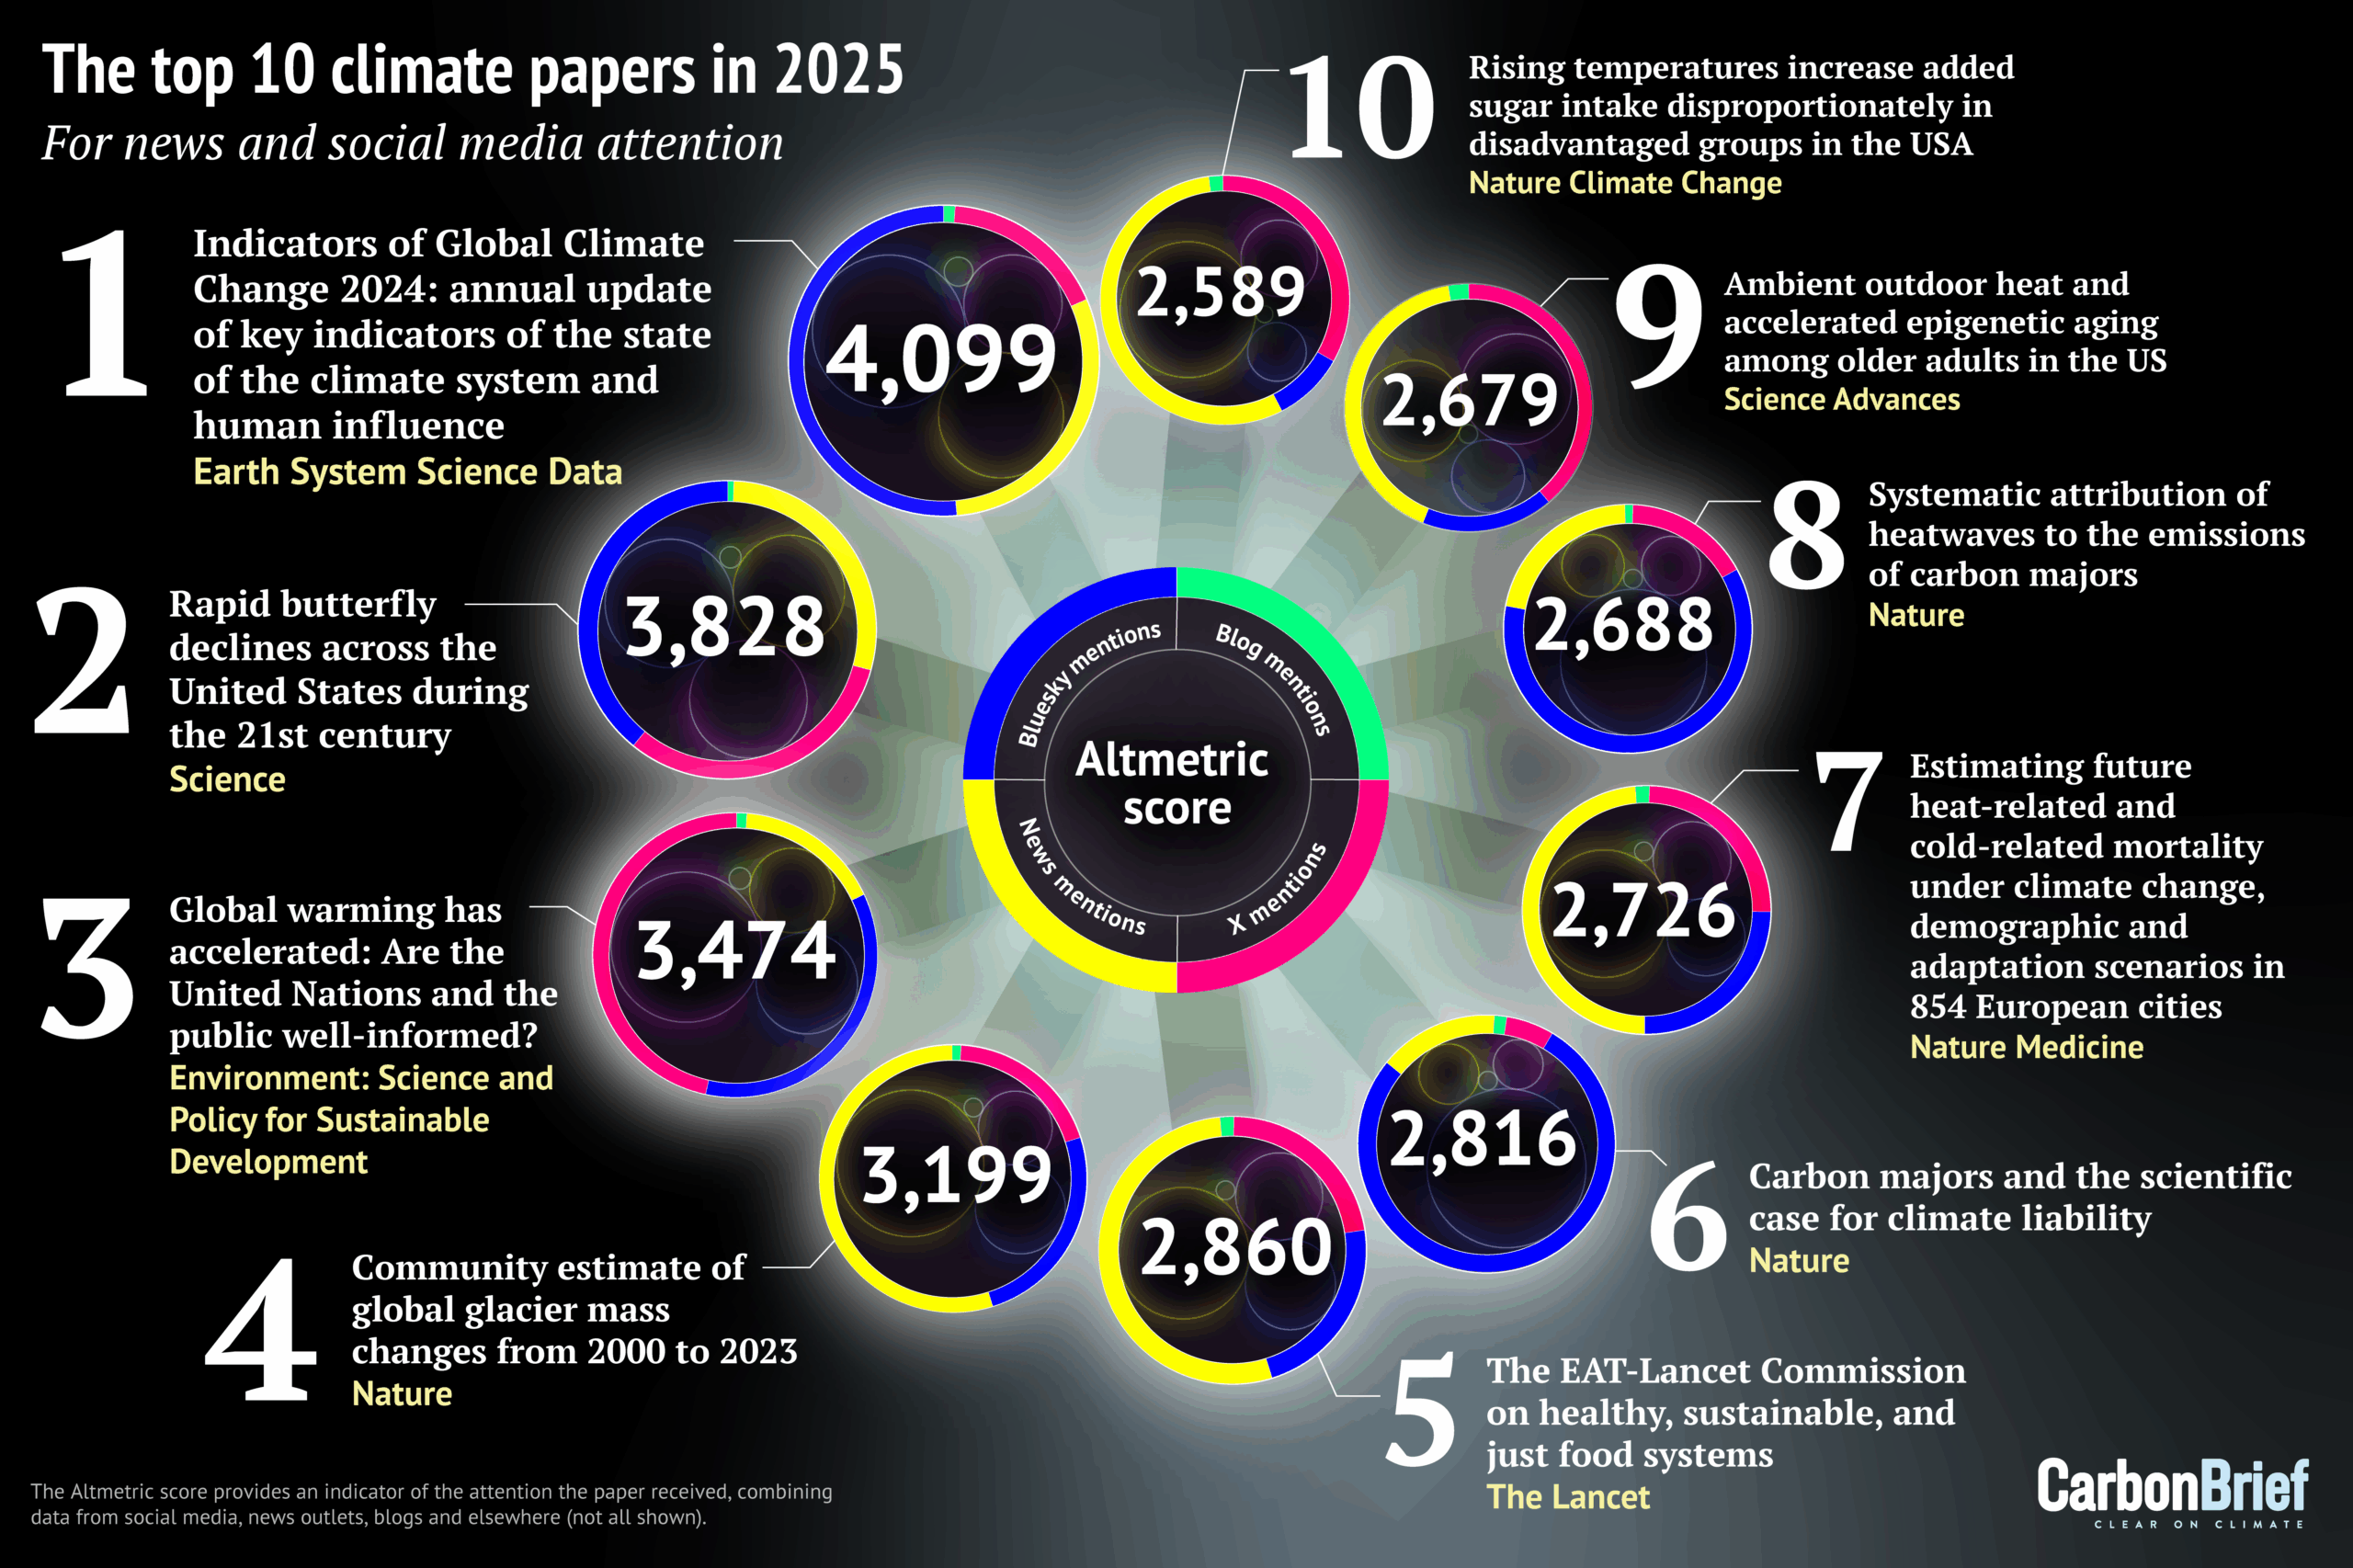
The top 10 – shown in the infographic above and list below – include research into declining butterflies, heat-related deaths, sugar intake and the massive loss of ice from the world’s glaciers:

  1. Indicators of Global Climate Change 2024: annual update of key indicators of the state of the climate system and human influence
  2. Rapid butterfly declines across the US during the 21st century
  3. Global warming has accelerated: Are the UN and the public well informed?
  4. Community estimate of global glacier mass changes from 2000 to 2023 
  5. The EAT-Lancet Commission on healthy, sustainable and just food systems 
  6. Carbon majors and the scientific case for climate liability 
  7. Estimating future heat-related and cold-related mortality under climate change, demographic and adaptation scenarios in 854 European cities 
  8. Systematic attribution of heatwaves to the emissions of carbon majors 
  9. Ambient outdoor heat and accelerated epigenetic aging among older adults in the US 
  10. Rising temperatures increase added sugar intake disproportionately in disadvantaged groups in the US

Later in this article, Carbon Brief looks at the rest of the top 25 and provides analysis of the most featured journals, as well as the gender diversity and country of origin of authors.

New for this year is the inclusion of Altmetric’s new “sentiment analysis”, which scores how positive or negative a paper’s social media attention has been.

(For Carbon Brief’s previous Altmetric articles, see the links for 202420232022202120202019201820172016 and 2015.) 

Global indicators

The top-scoring climate paper of 2025, ranking 24th of any research paper on any topic, is the annual update of the “Indicators of Global Climate Change” (IGCC) report.

The report was established in 2023 to help fill the gap in climate information between assessments of the Intergovernmental Panel on Climate Change (IPCC), which can take up to seven years to complete. It includes the latest data on global temperatures, the remaining carbon budget, greenhouse gas emissions and – for the first time – sea level rise. 

Ragout: Indicators of Global Climate Change 2024: annual update of key indicators of the state of the climate system and human influence

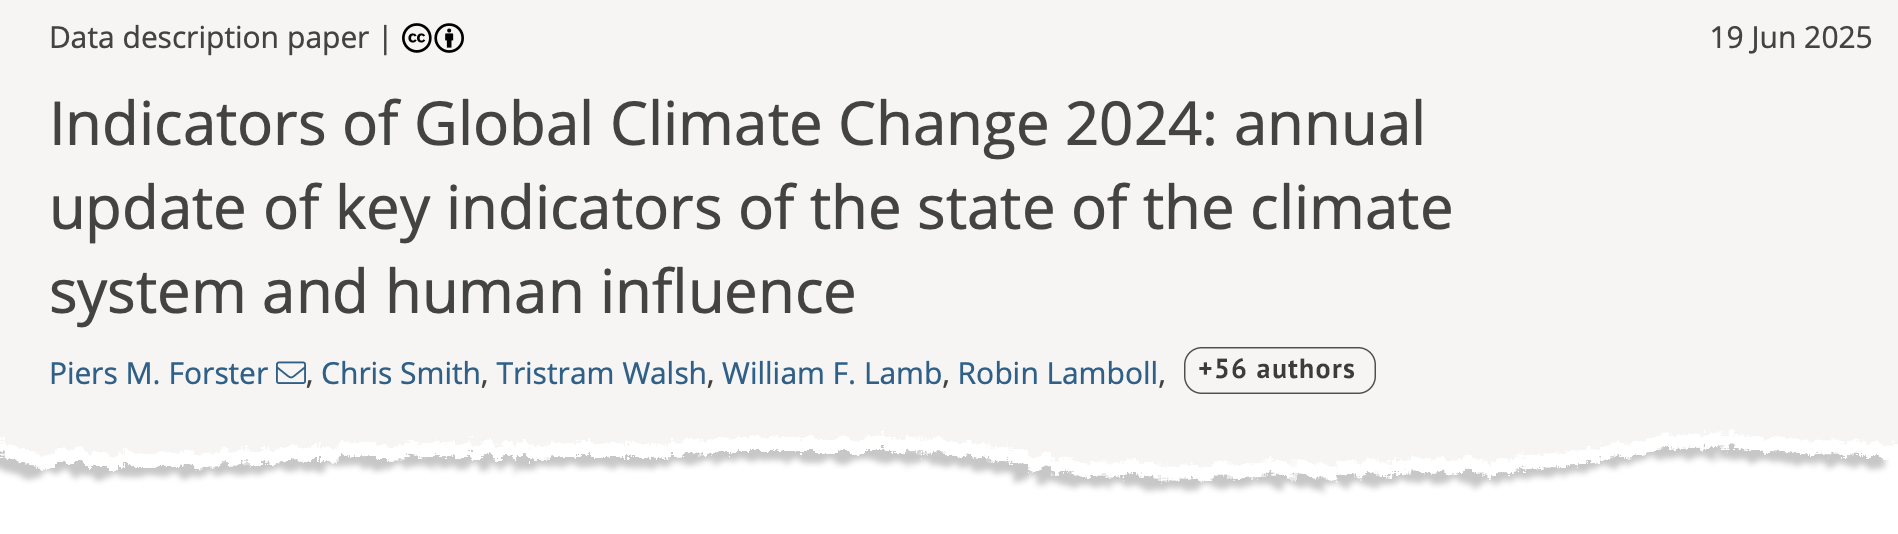
The paper, published in Earth System Science Data, has an Altmetric score of 4,099. This makes it the lowest top-scoring climate paper in Carbon Brief’s list since 2017.

(An Altmetric score combines the mentions that published peer-reviewed research has received from online news articles, blogs, Wikipedia and on social media platforms such as Facebook, Reddit, Twitter and Bluesky. See an earlier Carbon Brief article for more on how Altmetric’s scoring system works.)

Previous editions of the IGCC have also appeared in Carbon Brief’s list – the 2024 and 2023 iterations ranked 17th and 18th, respectively.

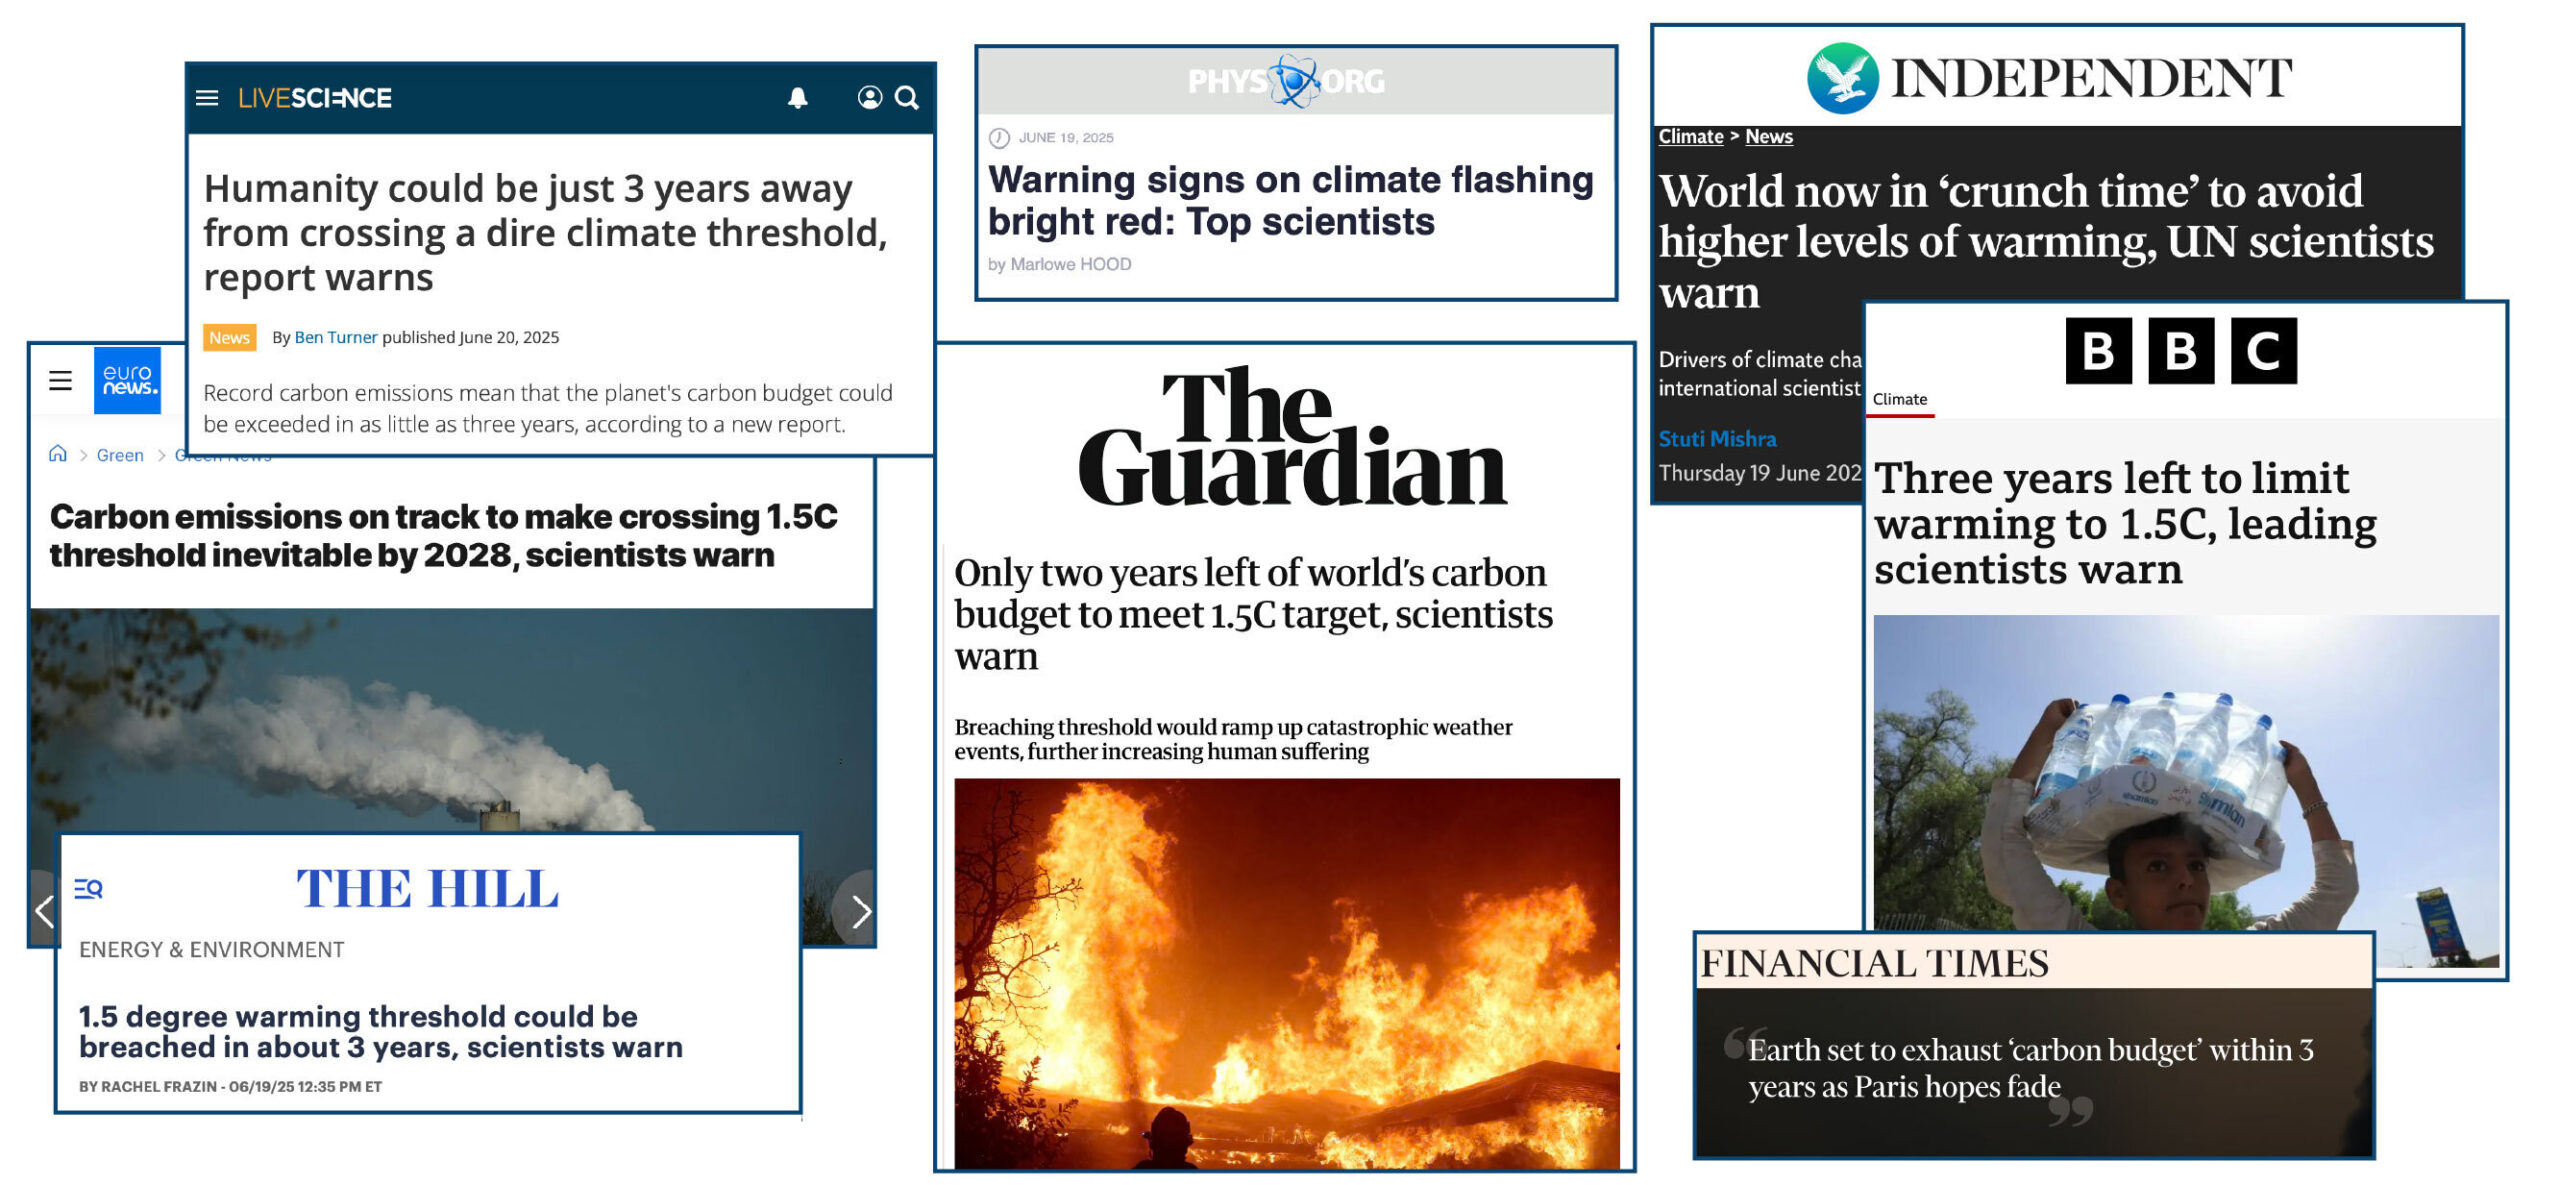
This year’s paper was mentioned 556 times in online news stories, including in the Associated PressGuardianIndependentHill and BBC News

Many outlets led their coverage with the study’s findings on the global “carbon budget”. This warned that the remaining carbon budget to limit warming to 1.5C will be exhausted in just three years if global emissions continue at their current rate.

Headline_Montage

In a Carbon Brief guest post about the study, authors Prof Piers Forster and Dr Debbie Rosen from the University of Leeds wrote:

“It is also now inevitable that global temperatures will reach 1.5C of long-term warming in the next few years unless society takes drastic, transformative action…Every year of delay brings reaching 1.5C – or even higher temperatures – closer.”

Forster, who was awarded a CBE in the 2026 new year honours list, tells Carbon Brief that media coverage of the study was “great” at “putting recent extreme weather in the context of rapid long-term rates of global warming”. 

However, he adds:

“Climate stories are not getting the coverage they deserve or need at the moment so the community needs to get all the help we can for getting clear consistent messages out there.”

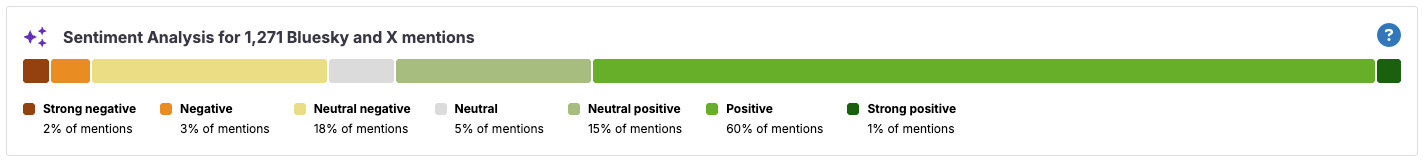
The paper was tweeted more than 300 times and posted on Bluesky more than 950 times. It also appeared in 22 blogs. 

Using AI, Altmetric now analyses the “sentiment” of this social media attention. As the summary figure below shows, the posts about this paper were largely positive, with an approximate 3:1 split of positive and negative attention.

Altmetric’s AI-generated summary of the sentiment of social media posts regarding the Forster et al.
Altmetric’s AI-generated summary of the sentiment of social media posts regarding the Forster et al. (2025) paper. Totals may add up to more than 100% because of rounding. Source: Altmetric

Butterfly decline

With an Altmetric score of 3,828, the second-highest scoring climate paper warns of “widespread” declines in butterfly numbers across the US since the turn of the century.

The paper, titled “Rapid butterfly declines across the US during the 21st century” and published in Science, identifies a 22% fall in butterfly numbers across more than 500 species between 2000 and 2020.

(There is a higher-scoring paper, “The 2025 state of the climate report: a planet on the brink”, in the journal BioScience, but it is a “special report” and was not formally peer reviewed.)

Ragout: Rapid butterfly declines across the United States during the 21st
century

The scale of the decline suggests “multiple and broadly acting threats, including habitat loss, climate change and pesticide use”, the paper says. The authors find that “species generally had stronger declines in more southerly parts of their ranges”, with some of the most negative trends in the driest and “most rapidly warming” US states.

The research was covered in 560 news articles, including the New York TimesGuardianAssociated PressNPREl País and BBC News. Much of the news coverage led with the 22% decline figure.

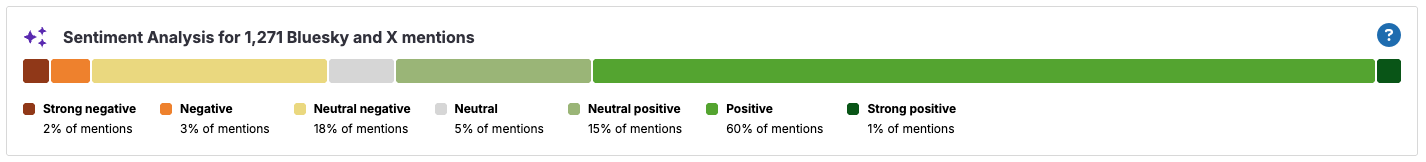
The paper was also mentioned in 13 blogs, more than 750 Bluesky posts and more than 600 tweets.

The sentiment analysis reveals that social media posts about the paper were largely negative. However, closer inspection reveals that this negativity is predominantly towards the findings of the paper, not the research itself. 

For example, a Bluesky post on the “distressing” findings by one of the study’s authors is designated as “neutral negative” by Altmetric’s AI analysis.

In a response to a query from Carbon Brief, Altmetric explains that the “goal is to measure how people feel about the research paper itself, not the topic it discusses”. However, in some cases the line can be “blurred” as the AI “sometimes struggles to separate the subject matter from the critique”. The organisation adds that it is “continuously working on improving our models to better distinguish between the post’s content and the research output”. 

Altmetric’s AI-generated summary of the sentiment of social media posts regarding the Forster et al.
Altmetric’s AI-generated summary of the sentiment of social media posts regarding the Forster et al. (2025) paper. Totals may add up to more than 100% because of rounding. Source: Altmetric

On the attention that the paper received, lead author Dr Collin Edwards of the Washington Department of Fish & Wildlife says that “first and foremost, people care about butterflies and our results are broad-reaching, unequivocal and, unfortunately, very concerning”. 

Edwards tells Carbon Brief he hopes the clarity of the writing made the paper accessible to readers, noting that he and his co-authors “sweat[ed] over every word”. 

The resulting news coverage “accurately captured the science”, Edwards says: 

“Much as I wish our results were less consistently grim, the consistency and simplicity of our findings mean that even if a news story only provides the highest level summary, it isn’t misleading readers by skipping some key caveat or nuance that changes the interpretation.”

Warming ‘acceleration’

In third place in Carbon Brief’s list for 2025 is the latest scientific paper from veteran climatologist Dr James Hansen, former director of the NASA Goddard Institute for Space Studies and now adjunct professor at Columbia University’s Earth Institute.

The paper, titled “Global warming has accelerated: Are the UN and the public well-informed?” was published in the journal Environment: Science and Policy for Sustainable Development. It generated an Altmetric score of 3,474.

Ragout: Global Warming Has Accelerated: Are the United Nations and the Public Well-Informed

The study estimates that the record-high global temperatures in the last few years were caused by a combination of El Niño and a reduction in air pollution from international shipping

The findings suggest that the cooling effect of aerosols – tiny, light‑scattering particles produced mainly by burning fossil fuels – has masked more of the warming driven by greenhouse gases than previously estimated by the IPCC.

As efforts to tackle air pollution continue to reduce aerosol emissions, warming will accelerate further – reaching 2C by 2045, according to the research.

The paper was covered by almost 400 news stories – driven, in part, by Hansen’s comments in a press briefing that the Paris Agreement’s 2C warming limit was already “dead”. 

Hansen’s analysis received a sceptical response from some scientists. For example, Dr Valerie Masson-Delmotte, an IPCC co-chair for its most recent assessment report on climate science, told Agence France-Presse the research “is not published in a climate science journal and it formulates a certain number of hypotheses that are not consistent with all the available observations”.

In addition, other estimates, including by Carbon Brief, suggest new shipping regulations have made a smaller contribution to warming than estimated by Hansen.

Hansen tells Carbon Brief that the paper “did ok” in terms of media coverage, although notes “it’s on [scientists] to do a better job of making clear what the core issues are in the physics of climate change”.

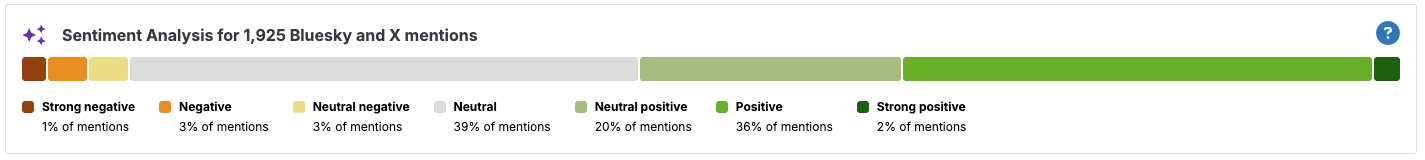
With more than 1,000 tweets, the paper scored highest in the top 25 for posts on Twitter. It was also mentioned in more than 800 Bluesky posts and on 27 blogs. 

The sentiment analysis suggests that these posts were largely positive, with just a small percentage of negative comments.

Altmetric’s AI-generated summary of the sentiment of social media posts regarding the Hansen et al.
Altmetric’s AI-generated summary of the sentiment of social media posts regarding the Hansen et al. (2025) paper. Totals may add up to more than 100% because of rounding. Source: Altmetric

Making the top 10

Ranking fourth in Carbon Brief’s analysis is a Nature paper calculating changes in global glacier mass over 2000-23. The study finds glaciers worldwide lost 273bn tonnes of ice annually over that time – with losses increasing by 36% between 2000-11 and 2012-23.

The study has an Altmetric score of 3,199. It received more news coverage than any other paper in this year’s top 25, amassing 1,187 mentions. with outlets including the GuardianAssociated Press and Economic Times

At number five, with an Altmetric score of 2,860, is the EAT-Lancet Commission on healthy, sustainable and just food systems.

Carbon Brief’s coverage of the report highlights that “a global shift towards ‘healthier’ diets could cut non-CO2 greenhouse gas emissions, such as methane, from agriculture by 15% by 2050”. It adds:

“The findings build on the widely cited 2019 report from the EAT-Lancet Commission – a group of leading experts in nutrition, climate, economics, health, social sciences and agriculture from around the world.”

Also making the top 10 – ranking sixth and eighth – are a pair of papers published in Nature, which both link extreme heat to the emissions of specific “carbon majors” – large producers of fossil fuels, such as ExxonMobil, Shell and Saudi Aramco,.

The first is a perspective, titled “Carbon majors and the scientific case for climate liability”, published in April. It begins:

“Will it ever be possible to sue anyone for damaging the climate? Twenty years after this question was first posed, we argue that the scientific case for climate liability is closed. Here we detail the scientific and legal implications of an ‘end-to-end’ attribution that links fossil fuel producers to specific damages from warming.”

The authors find “trillions (of US$) in economic losses attributable to the extreme heat caused by emissions from individual companies”.

The paper was mentioned 1,329 times on Bluesky – the highest in this year’s top 25. It was also mentioned in around 270 news stories.

Published four months later, the second paper uses extreme event attribution to assess the impact of climate change on more than 200 heatwaves recorded since the year 2000.

The authors find one-quarter of the heatwaves would have been “virtually impossible” without human-caused global warming. They add that the heatwaves were, on average, 1.7C hotter due to climate change, with half of this increase due to emissions stemming from the operations and production of carbon majors. 

This study was mentioned in almost 300 news stories – including by Carbon Brief – as well as 222 tweets and 823 posts on Bluesky.

In seventh place is a Nature Medicine study, which quantifies how heat-related and cold-related deaths will change over the coming century as the climate warms. 

A related research briefing explains the main findings of the paper:

“Heat-related deaths are estimated to increase more rapidly than cold-related deaths are estimated to decrease under future climate change scenarios across European cities. An unrealistic degree of adaptation to heat would be required to revert this trend, indicating the need for strong policies to reduce greenhouse gases emissions.”

The paper was mentioned 345 times in the news, including in the Financial TimesNew ScientistGuardian and Bloomberg.

The paper in ninth place also analyses the health impacts of extreme heat. The study, published in Science Advances, finds that extreme heat can speed up biological ageing in older people. 

Rounding out the top 10 is a Nature Climate Change study, titled “Rising temperatures increase added sugar intake disproportionately in disadvantaged groups in the US”. 

The study finds that at higher temperatures, people in the US consume more sugar – mainly due to “higher consumption of sugar-sweetened beverages and frozen desserts”. The authors project that warming of 5C would drive additional sugar consumption of around 3 grams per day, “with vulnerable groups at an even higher risk”.

Elsewhere in the top 25

The rest of the top 25 includes a wide range of research, from “glacier extinction” and wildfires to Amazon drought and penguin guano.

In 13th place is a Nature Climate Change study that finds the wealthiest 10% of people – defined as those who earn at least €42,980 (£36,605) per year – contributed seven times more to the rise in monthly heat extremes around the world than the global average.

The authors also explore country-level emissions, finding that the wealthiest 10% in the US produced the emissions that caused a doubling in heat extremes across “vulnerable regions” globally. 

(See Carbon Brief’s coverage of the paper for more details.)

In 15th place is the annual Lancet Countdown on health and climate change – a lengthy report with more than 120 authors.

The study warns that “climate change is increasingly destabilising the planetary systems and environmental conditions on which human life depends”.

This annual analysis from the Lancet often features in Carbon Brief’s top 25 analysis. After three years in the Carbon Brief’s top 10 over 2020-23, the report landed in 20th place in 2023 and missed out on a spot in the top 25 altogether in 2024. 

In 16th place is a Science Advances study, titled “Increasing rat numbers in cities are linked to climate warming, urbanisation and human population”. The study uses public complaint and inspection data from 16 cities around the world to estimate changes in rat populations.

It finds that “warming temperatures and more people living in cities may be expanding the seasonal activity periods and food availability for urban rats”.

The study received 320 new mentions, including in the Washington PostNew Scientist and National Geographic.

In 21st place is a Nature Climate Change paper, titled “Peak glacier extinction in the mid-21st century”. The study authors “project a sharp rise in the number of glaciers disappearing worldwide, peaking between 2041 and 2055 with up to ~4,000 glaciers vanishing annually”.

Completing the top 25 is a Nature study on the “prudent planetary limit for geological carbon storage” – where captured CO2 is injected deep underground, where it can stay trapped for thousands of years. 

In a Carbon Brief guest post, study authors Dr Matthew Gidden and Prof Joeri Rogelj explain that carbon dioxide removal will only be effective at limiting global temperature rise if captured CO2 is injected “deep underground, where it can stay trapped for thousands of years”. 

The guest post warns that “geological carbon storage is not limitless”. It states that “if all available safe carbon storage capacity were used for CO2 removal, this would contribute to only a 0.7C reduction in global warming”. 
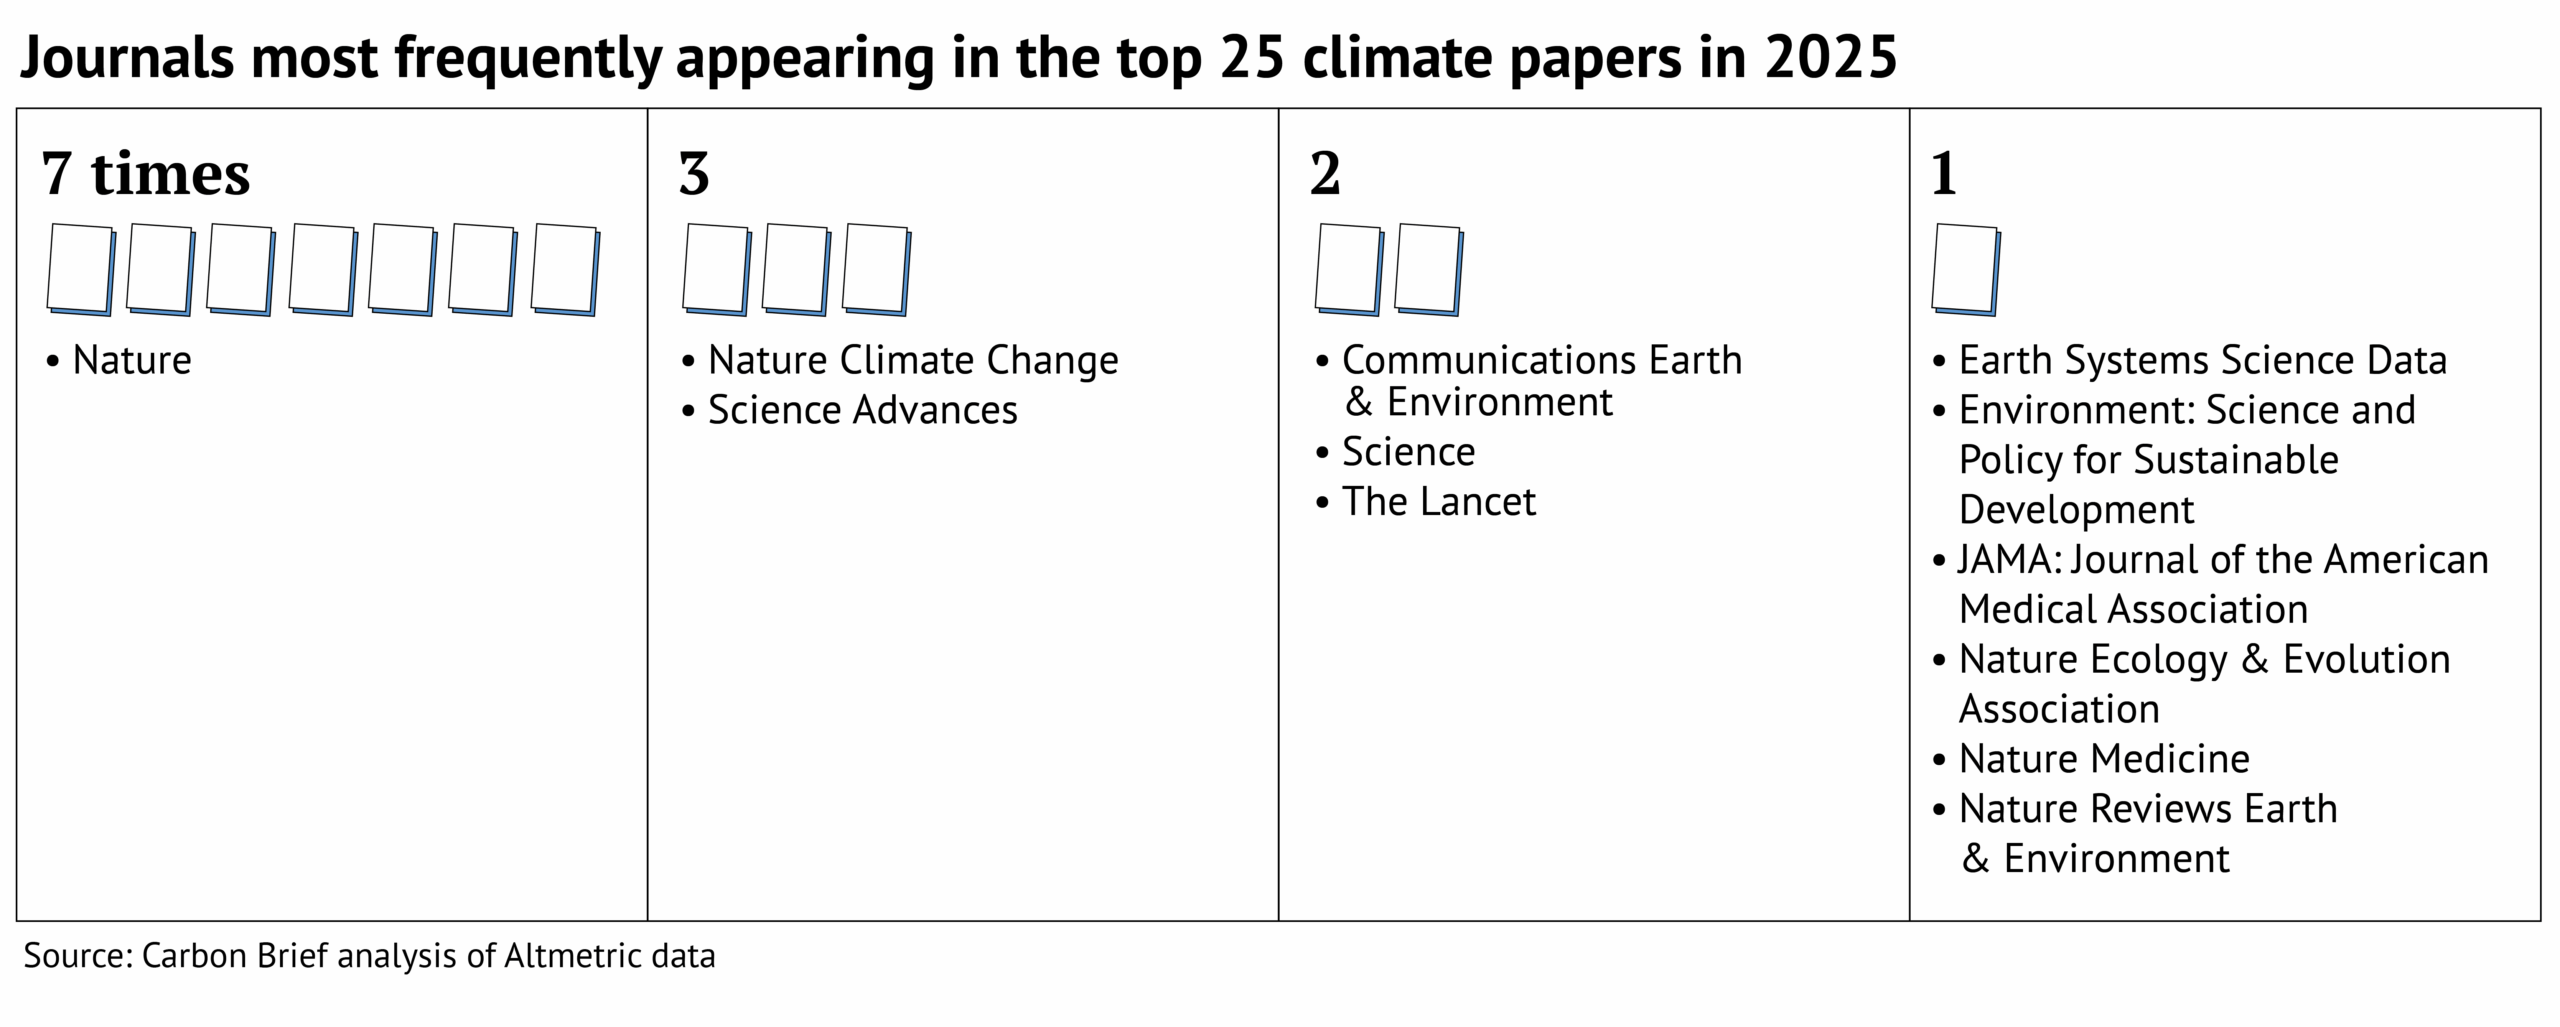
Top journals

The journal Nature dominates Carbon Brief’s top 25, with seven papers featured.

Many other journals in the Springer Nature stable also feature, including Nature Climate Change (three), Communications Earth & Environment (two), as well as Nature Ecology & Evolution, Nature Medicine and Nature Reviews Earth & Environment (one each).

Also appearing more than once in the top 25 are Science Advances (three), Science (two) and the Lancet (two). 

This is shown in the graphic below.

Graphic: Journals most frequently appearing in the top 25 climate papers in 2025

All the final scores for 2025 can be found in this spreadsheet.

Diversity in the top 25

The top 25 climate papers of 2025 cover a huge range of topics and scope. However, analysis of their authors reveals a distinct lack of diversity.

In total, the top 25 includes more than 650 authors – the highest number since Carbon Brief began this analysis in 2022.

This is largely due to a few publications with an exceptionally high number of authors. For example, the 2025 report of the Lancet Countdown on health and climate change has almost 130 authors alone, accounting for almost one-fifth of authors in this analysis. 

Carbon Brief recorded the gender and country of affiliation for each of these authors. (The methodology used was developed by Carbon Brief for analysis presented in a special 2021 series on climate justice.)

The analysis reveals that 88% of the authors of the climate papers most featured in the media in 2025 are from institutions in the global north. 

Global South: The “global south” is a term used to broadly describe lower-income countries in regions such as Africa, Asia and Latin America. It is often used to denote nations that are either in… Read More

Carbon Brief defines the global north as North America, Europe, Japan, Australia and New Zealand. It defines the global south as Asia (excluding Japan), Africa, Oceania (excluding Australia and New Zealand), Latin America and the Caribbean.

The analysis shows that 53% of authors are from European institutions, while only 1% of authors are from institutions in Africa.

Further data analysis shows that there are also inequalities within continents. The map below shows the percentage of authors from each country, where dark blue indicates a higher percentage. Countries that are not represented by any authors in the analysis are shown in grey.

The number of all authors from the climate papers most featured in the media in 2025.
The number of all authors from the climate papers most featured in the media in 2025. The designations employed and the presentation of the material on this map do not imply the expression of any opinion whatsoever on the part of Carbon Brief concerning the legal status of any country, territory, city or area or of its authorities, or concerning the delimitation of its frontiers or boundaries. Map by Carbon Brief using Datawrapper.

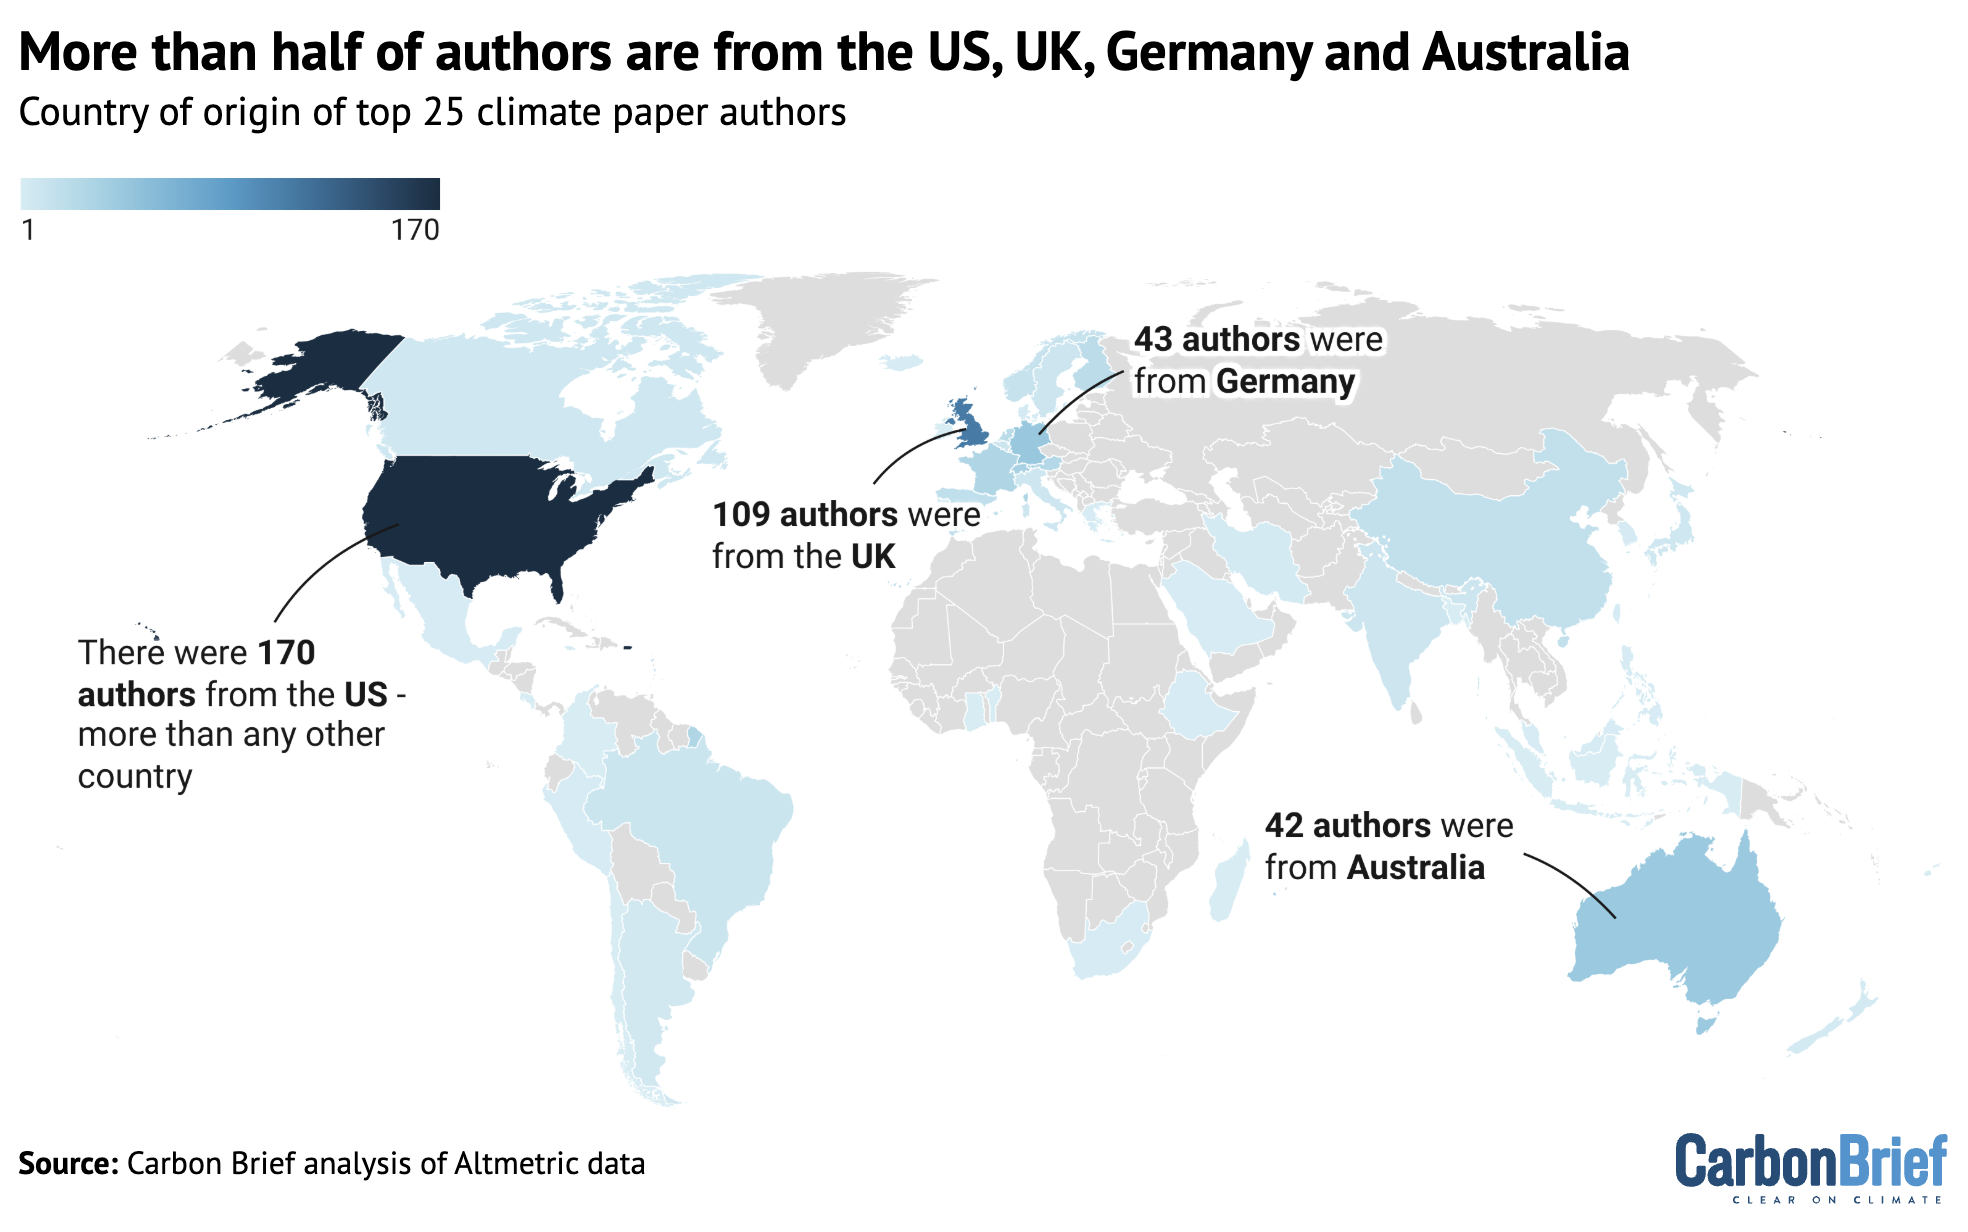
The top-ranking countries on this map are the US and the UK, which account for 26% and 16% of the authors, respectively.

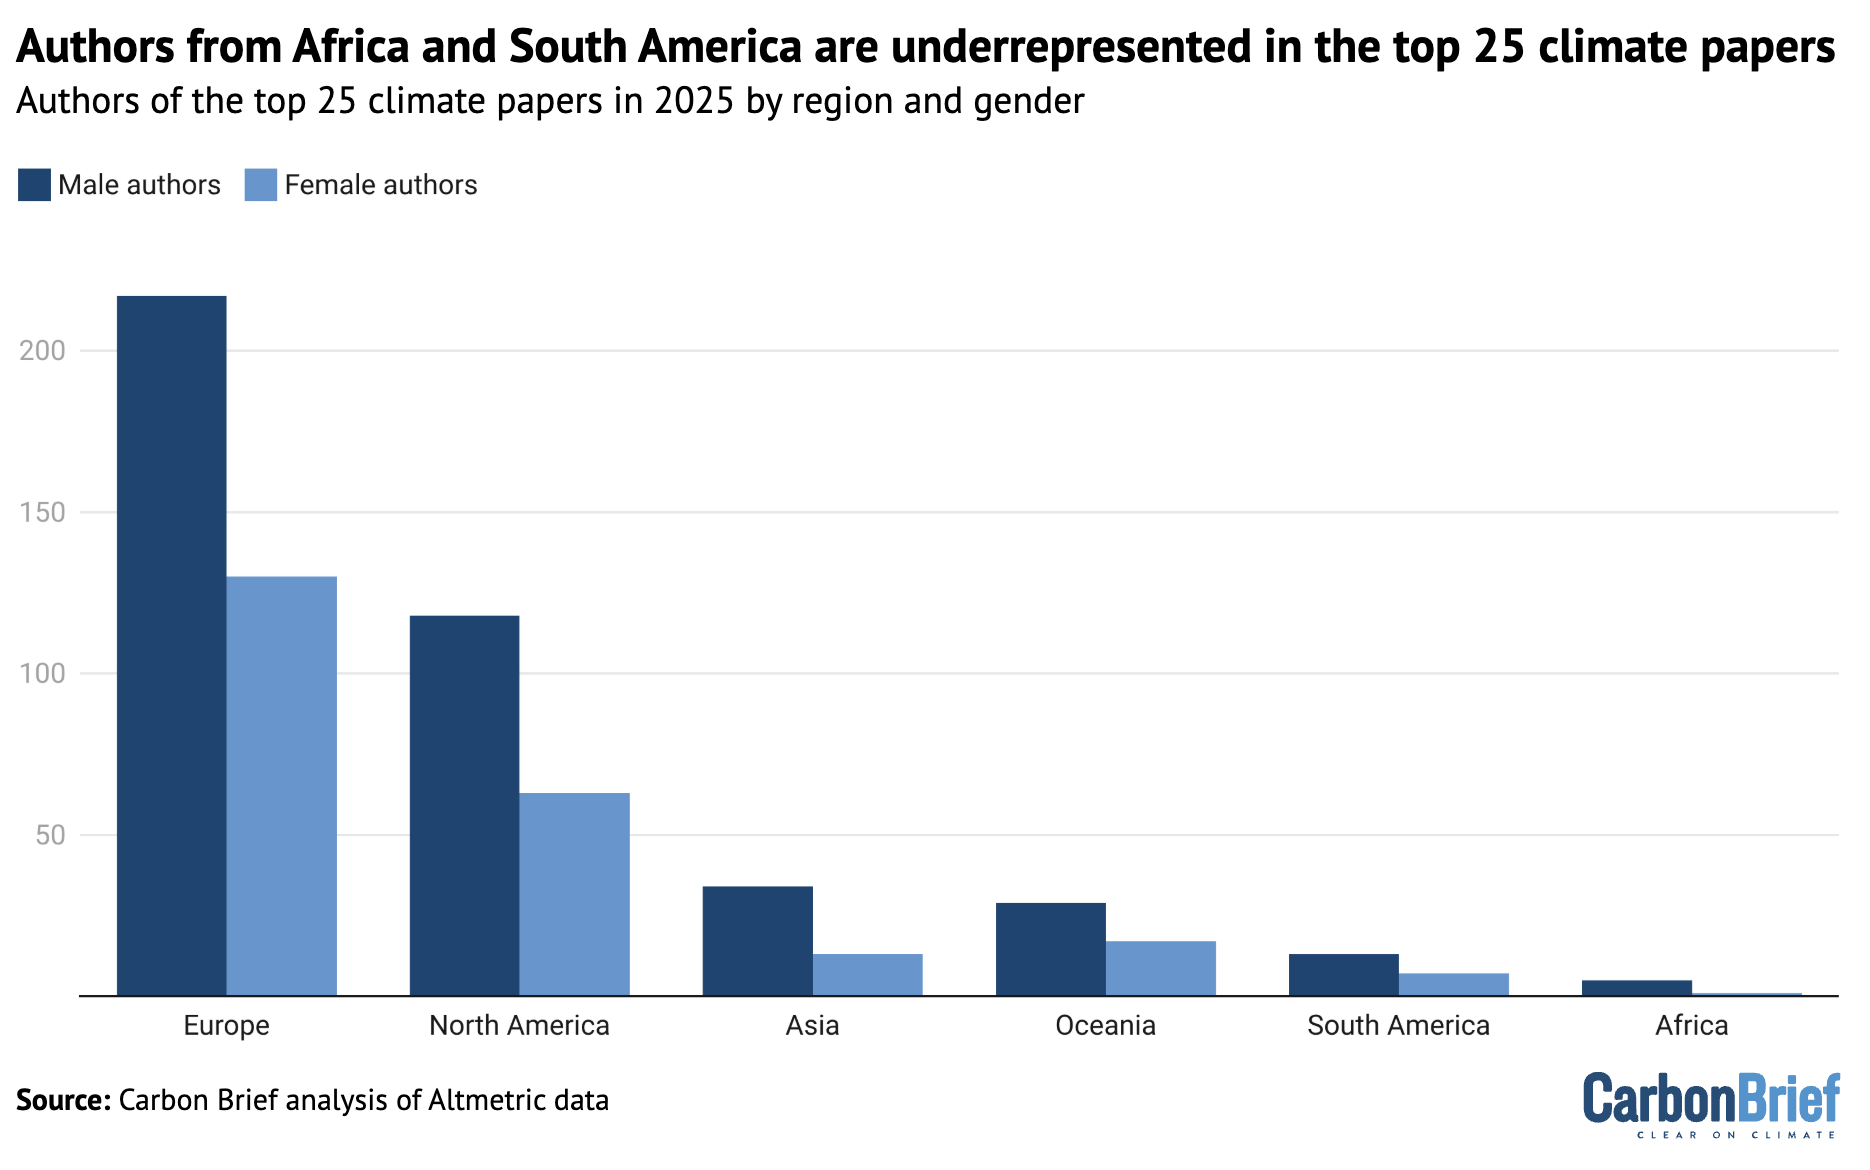
Carbon Brief also analysed the gender of the authors. 

Only one-third of authors from the top 25 climate papers of 2025 are women and only five of the 25 papers list a woman as lead author.

The plot below shows the number of authors from each continent, separated into men (dark blue) and women (light blue).

The number of men (dark blue) and women (light blue) listed as authors in the climate papers most featured in the media in 2025, shown by continent.
The number of men (dark blue) and women (light blue) listed as authors in the climate papers most featured in the media in 2025, shown by continent. Chart by Carbon Brief using Datawrapper.

The full spreadsheet showing the results of this data analysis can be found here. For more on the biases in climate publishing, see Carbon Brief’s article on the lack of diversity in climate-science research.

Elon Musk urges you to be a Fascist like him, says that you can ignore facts and reality then.
Donald Trump urges you to be a Climate Science denier like him. He says that he makes millions and millions for destroying the planet, Burn, Baby, Burn and Flood, Baby, Flood.
Orcas discuss Donald Trump and the killer apes' concept of democracy. Front Orca warns that Trump is crashing his country's economy and that everything he does he does for the fantastically wealthy.
Orcas discuss Donald Trump and the killer apes’ concept of democracy. Front Orca warns that Trump is crashing his country’s economy and that everything he does he does for the fantastically wealthy.

Original article republished from Carbon Brief under a CC license

Continue ReadingAnalysis: The climate papers most featured in the media in 2025

Analysis: World’s biggest historic polluter – the US – is pulling out of UN climate treaty

Spread the love

Original article by Simon Evans republished from Carbon Brief under a CC license

Satellite image of US at night. Credit: Delphotos / Alamy Stock Photo

The US, which has announced plans to withdraw from the global climate treaty – the UN Framework Convention on Climate Change (UNFCCC) – is more historically responsible for climate change than any other country or group.

Carbon Brief analysis shows that the US has emitted a total of 542bn tonnes of carbon dioxide (GtCO2) since 1850, by burning fossil fuels, cutting down trees and other activities.

This is the largest contribution to the Earth’s warming climate by far, as shown in the figure below, with China’s 336GtCO2 significantly behind in second and Russia in third at 185GtCO2.

Chart showing that the US is more responsible for climate change than anyone else
Top 10 countries in terms of their cumulative historical CO2 emissions from fossil fuels, cement, land use, land use change and forestry, 1850-2025, billion tonnes. Source: Source: Carbon Brief analysis of figures from Jones et al (2023), Lamboll et al (2023), the Global Carbon ProjectCDIACOur World in Data, the International Energy Agency and Carbon Monitor.

The US is responsible for more than a fifth of the 2,651GtCO2 that humans have pumped into the atmosphere between 1850 and 2025 as a result of fossil fuels, cement and land-use change.

China is responsible for another 13%, with the 27 nations of the EU making up another 12%.

In total, these cumulative emissions have used up more than 95% of the carbon budget for limiting global warming to 1.5C and are the predominant reason the Earth is already nearly 1.5C hotter than in pre-industrial times.

The US share of global warming is even more disproportionate when considering that its population of around 350 million people makes up just 4% of the global total.

On the basis of current populations, the US’s per-capita cumulative historical emissions are around 7 times higher than those for China, more than double the EU’s and 25 times those for India.

The US’s historical emissions of 542GtCO2 are larger than the combined total of the 133 countries with the lowest cumulative contributions, a list that includes Saudi Arabia, Spain and Nigeria. Collectively, these 133 countries have a population of more than 3 billion people.

See Carbon Brief’s previous detailed analysis of historical responsibility for climate change for more details on the data sources and methodology, as well as consumption-based emissions.

Additionally, in 2023, Carbon Brief published an article that looked at the “radical” impact of reassigning responsibility for historical emissions to colonial rulers in the past.

This approach has a very limited impact on the US, which became independent before the vast majority of its historical emissions had taken place.

Original article by Simon Evans republished from Carbon Brief under a CC license

Donald Trump urges you to be a Climate Science denier like him. He says that he makes millions and millions for destroying the planet, Burn, Baby, Burn and Flood, Baby, Flood.
Orcas discuss Donald Trump and the killer apes' concept of democracy. Front Orca warns that Trump is crashing his country's economy and that everything he does he does for the fantastically wealthy.
Orcas discuss Donald Trump and the killer apes’ concept of democracy. Front Orca warns that Trump is crashing his country’s economy and that everything he does he does for the fantastically wealthy.
Continue ReadingAnalysis: World’s biggest historic polluter – the US – is pulling out of UN climate treaty

IEA: Fossil-fuel use will peak before 2030 – unless ‘stated policies’ are abandoned

Spread the love

Original article by Simon Evans and Ho Woo Nam republished from Carbon Brief.

The giant Kooragang Coal Loader at Port Newcastle Australia. Credit: IconsAustralia / Alamy Stock Photo

The world’s fossil-fuel use is still on track to peak before 2030, despite a surge in political support for coal, oil and gas, according to data from the International Energy Agency (IEA).

The IEA’s latest World Energy Outlook 2025, published during the opening days of the COP30 climate summit in Brazil, shows coal at or close to a peak, with oil set to follow around 2030 and gas by 2035, based on the stated policy intentions of the world’s governments.

Under the same assumptions, the IEA says that clean-energy use will surge, as nuclear power rises 39% by 2035, solar by 344% and wind by 178%.

Still, the outlook has some notable shifts since last year, with coal use revised up by around 6% in the near term, oil seeing a shallower post-peak decline and gas plateauing at higher levels.

This means that the IEA expects global warming to reach 2.5C this century if “stated policies” are implemented as planned, up marginally from 2.4C in last year’s outlook.

In addition, after pressure from the Trump administration in the US, the IEA has resurrected its “current policies scenario”, which – effectively – assumes that governments around the world abandon their stated intentions and only policies already set in legislation are continued.

If this were to happen, the IEA warns, global warming would reach 2.9C by 2100, as oil and gas demand would continue to rise and the decline in coal use would proceed at a slower rate.

This year’s outlook also includes a pathway that limits warming to 1.5C in 2100, but says that this would only be possible after a period of “overshoot”, where temperature rise peaks at 1.65C.

The IEA will publish its “announced pledges scenario” at a later date, to illustrate the impact of new national climate pledges being implemented on time and in full.

(See Carbon Brief’s coverage of previous IEA world energy outlooks from 202420232022202120202019201820172016 and 2015.)

World energy outlook

The IEA’s annual World Energy Outlook (WEO) is published every autumn. It is regarded as one of the most influential annual contributions to the understanding of energy and emissions trends.

The outlook explores a range of scenarios, representing different possible futures for the global energy system. These are developed using the IEA’s “global energy and climate model”.

The latest report stresses that “none of [these scenarios] should be regarded as a forecast”.

However, this year’s outlook marks a major shift in emphasis between the scenarios – and it reintroduces a pathway where oil and gas demand continues to rise for many decades.

This pathway is named the “current policies scenario” (CPS), which assumes that governments abandon their planned policies, leaving only those that are already set in legislation.

If the world followed this path, then global temperatures would reach 2.9C above pre-industrial levels by 2100 and would be “set to keep rising from there”, the IEA says.

The CPS was part of the annual outlook until 2020, when the IEA said that it was “difficult to imagine” such a pathway “prevailing in today’s circumstances”.

It has been resurrected following heavy pressure from the US, which is a major funder of the IEA that accounts for 14% of the agency’s budget.

For example, in July Politico reported “a ratcheted-up US pressure campaign” and “months of public frustrations with the IEA from top Trump administration officials”. It noted:

“Some Republicans say the IEA has discouraged investment in fossil fuels by publishing analyses that show near-term peaks in global demand for oil and gas.”

The CPS is the first scenario to be discussed in detail in the report, appearing in chapter three. The CPS similarly appears first in Annex A, the data tables for the report.

The second scenario is the “stated policies scenario” (STEPS), featured in chapter four of this year’s outlook. Here, the outlook also includes policies that governments say they intend to bring forward and that the IEA judges as likely to be implemented in practice.

In this world, global warming would reach 2.5C by 2100 – up marginally from the 2.4C expected in the 2024 edition of the outlook.

Beyond the STEPS and the CPS, the outlook includes two further scenarios.

One is the “net-zero emissions by 2050” (NZE) scenario, which illustrates how the world’s energy system would need to change in order to limit warming in 2100 to 1.5C.

The NZE was first floated in the 2020 edition of the report and was then formally featured in 2021.

The report notes that, unlike in previous editions, this scenario would see warming peak at more than 1.6C above pre-industrial temperatures, before returning to 1.5C by the end of the century.

This means it would include a high level of temporary “overshoot” of the 1.5C target. The IEA explains that this results from the “reality of persistently high emissions in recent years”. It adds:

“In addition to very rapid progress with the transformation of the energy sector, bringing the temperature rise back down below 1.5C by 2100 also requires widespread deployment of CO2 removal technologies that are currently unproven at large scale.”

Finally, the outlook includes a new scenario where everyone in the world is able to gain access to electricity by 2035 and to clean cooking by 2040, named “ACCESS”.

While the STEPS appears second in the running order of the report, it is mentioned slightly more frequently than the CPS, as shown in the figure below. The CPS is a close second, however, whereas the IEA’s 1.5C pathway (NZE) receives a declining level of attention.

Number of mentions of each scenario per 100 pages of text.
Number of mentions of each scenario per 100 pages of text. Source: Carbon Brief analysis.

US critics of the IEA have presented its stated policies scenario as “disconnected from reality”, in contrast to what they describe as the “likely scenario” of “business as usual”.

Yet the current policies scenario is far from a “business-as-usual” pathway. The IEA says this explicitly in an article published ahead of the outlook:

“The CPS might seem like a ‘business-as-usual’ scenario, but this terminology can be misleading in an energy system where new technologies are already being deployed at scale, underpinned by robust economics and mature, existing policy frameworks. In these areas, ‘business as usual’ would imply continuing the current process of change and, in some cases, accelerating it.”

In order to create the current policies scenario, where oil and gas use continues to surge into the future, the IEA therefore has to make more pessimistic assumptions about barriers to the uptake of new technologies and about the willingness of governments to row back on their plans. It says:

“The CPS…builds on a narrow reading of today’s policy settings…assuming no change, even where governments have indicated their intention to do so.”

This is not a scenario of “business as usual”. Instead, it is a scenario where countries around the world follow US president Donald Trump in dismantling their plans to shift away from fossil fuels.

More specifically, the current policies scenario assumes that countries around the world renege on their policy commitments and fail to honour their climate pledges.

For example, it assumes that Japan and South Korea fail to implement their latest national electricity plans, that China fails to continue its power-market reforms and abandons its provincial targets for clean power, that EU countries fail to meet their coal phase-out pledges and that US states such as California fail to extend their clean-energy targets.

Similarly, it assumes that Brazil, Turkey and India fail to implement their greenhouse gas emissions trading schemes (ETS) as planned and that China fails to expand its ETS to other industries.

The scenario also assumes that the EU, China, India, Australia, Japan and many others fail to extend or continue strengthening regulations on the energy efficiency of buildings and appliances, as well as those relating to the fuel-economy standards for new vehicles.

In contrast to the portrayal of the stated policies scenario as blindly assuming that all pledges will be met, the IEA notes that it does not give a free pass to aspirational targets. It says:

“[T]argets are not automatically assumed to be met; the prospects and timing for their realisation are subject to an assessment of relevant market, infrastructure and financial constraints…[L]ike the CPS, the STEPS does not assume that aspirational goals, such as those included in the Paris Agreement, are achieved.”

Only in the “announced pledges scenario” (APS) does the IEA assume that countries meet all of their climate pledges on time and full – regardless of how credible they are.

The APS does not appear in this year’s report, presumably because many countries missed the deadlines to publish new climate pledges ahead of COP30.

The IEA says it will publish its APS, assessing the impact of the new pledges, “once there is a more complete picture of these commitments”.

Fossil-fuel peak

In recent years, there has been a significant shift in the IEA’s outlook for fossil fuels under the stated policies scenario, which it has described as “a mirror to the plans of today’s policymakers”.

In 2020, the agency said that prevailing policy conditions pointed towards a “structural” decline in global coal demand, but that it was too soon to declare a peak in oil or gas demand.

By 2021, it said global fossil-fuel use could peak as soon as 2025, but only if all countries got on track to meet their climate goals. Under stated policies, it expected fossil-fuel use to hit a plateau from the late 2020s onwards, declining only marginally by 2050.

There was a dramatic change in 2022, when it said that Russia’s invasion of Ukraine and the resulting global energy crisis had “turbo-charged” the shift away from fossil fuels.

As a result, it said at the time that it expected a peak in demand for each of the fossil fuels. Coal “within a few years”, oil “in the mid-2030s” and gas ”by the end of the decade”.

This outlook sharpened further in 2023 and, by 2024, it was saying that each of the fossil fuels would see a peak in global demand before 2030.

This year’s report notes that “some formal country-level [climate] commitments have waned”, pointing to the withdrawal of the US from the Paris Agreement.

The report says the “new direction” in the US is among “major new policies” in 48 countries. The other changes it lists include Brazil’s “energy transition acceleration programme”, Japan’s new plan for 2040 and the EU’s recently adopted 2040 climate target.

Overall, the IEA data still points to peaks in demand for coal, oil and gas under the stated policies scenario, as shown in the figure below.

Alongside this there is a surge in clean technologies, with renewables overtaking oil to become the world’s largest source of energy – not just electricity – by the early 2040s.

Total energy demand chart

In this year’s outlook under stated policies, the IEA sees global coal demand as already being at – or very close to – a definitive peak, as the chart above shows.

Coal then enters a structural decline, where demand for the fuel is displaced by cheaper alternatives, particularly renewable sources of electricity.

The IEA reiterates that the cost of solar, wind and batteries has respectively fallen by 90%, 70% and 90% since 2010, with further declines of 10-40% expected by 2035.

(The report notes that household energy spending would be lower under the more ambitious NZE scenario than under stated policies, despite the need for greater investment.)

However, this year’s outlook has coal use in 2030 coming in some 6% higher than expected last year, although it ultimately declines to similar levels by 2050.

For oil, the agency’s data still points to a peak in demand this decade, as electric vehicles (EVs) and more efficient combustion engines erode the need for the fuel in road transport.

While this sees oil demand in 2030 reaching similar levels to what the IEA expected last year, the post-peak decline is slightly less marked in the latest outlook, ending some 5% higher in 2050.

The biggest shift compared with last year is for gas, where the IEA suggests that global demand will keep rising until 2035, rather than peaking by 2030.

Still, the outlook has gas demand in 2030 being only 7% higher than expected last year. It notes:

“Long-term natural gas demand growth is kept lower than in recent decades by the expanding deployment of renewables, efficiency gains and electrification of end-uses.”

In terms of clean energy, the outlook sees nuclear power output growing to 39% above 2024 levels by 2035 and doubling by 2050. Solar grows nearly four-fold by 2035 and nearly nine-fold by 2050, while wind power nearly triples and quadruples over the same periods.

Notably, the IEA sees strong growth of clean-energy technologies, even in the current policies scenario. Here, renewables would still become the world’s largest energy source before 2050.

This is despite the severe headwinds assumed in this scenario, including EVs never increasing from their current low share of sales in India or the US.

The CPS would see oil and gas use continuing to rise, with demand for oil reaching 11% above current levels by 2050 and gas climbing 31%, even as renewables nearly triple.

This means that coal use would still decline, falling to a fifth below current levels by 2050.

Finally, while the IEA considers the prospect of global coal demand continuing to rise rather than falling as expected, it gives this idea short shrift. It explains:

“A growth story for coal over the coming decades cannot entirely be ruled out but it would fly in the face of two crucial structural trends witnessed in recent years: the rise of renewable sources of power generation, and the shift in China away from an especially coal-intensive model of growth and infrastructure development. As such, sustained growth for coal demand appears highly unlikely.”

Original article by Simon Evans and Ho Woo Nam republished from Carbon Brief.

Elon Musk urges you to be a Fascist like him, says that you can ignore facts and reality then.
Donald Trump urges you to be a Climate Science denier like him. He says that he makes millions and millions for destroying the planet, Burn, Baby, Burn and Flood, Baby, Flood.
Nigel Farage urges you to ignore facts and reality and be a climate science denier like him and his Deputy Richard Tice. He says that Reform UK has received £Millions and £Millions from the fossil fuel industry to promote climate denial and destroy the planet.
Continue ReadingIEA: Fossil-fuel use will peak before 2030 – unless ‘stated policies’ are abandoned

Experts: The key ‘unknowns’ of overshooting the 1.5C global-warming limit

Spread the love

Original article by Cecilia Keating and Robert McSweeney republished from Carbon Brief under a CC license

Demonstrators from Extinction Rebellion push self-made cart in the shape of the 1.5C climate target in Berlin, Germany. Credit: dpa picture alliance / Alamy Stock Photo

Last week, around 180 scientists, researchers and legal experts gathered in Luxenburg, Austria to attend the first-ever international conference focused on the controversial topic of climate “overshoot”.

This hypothesised scenario would see global temperatures initially “overshoot” the Paris Agreement’s aspirational limit of 1.5C, before they are brought back down through techniques that would remove carbon dioxide from the atmosphere.

(For more on the key talking points, new research and discussions that emerged from the three-day conference, see Carbon Brief’s full write-up of the event.)

On the sidelines of the conference, Carbon Brief asked a range of delegates what they consider to be the key “unknowns” around overshoot.

Below are their responses, first as sample quotes, then, in full:

  • Dr James Fletcher: “Yes, there will be overshoot, but at what point will that overshoot peak? Are we peaking at 1.6C, 1.7C, 2.1C?”
  • Prof Shobha Maharaj: “There are lots of places in the world where adaptation plans have been made to a 1.5C ceiling. The fact is that these plans are going to need to be modified or probably redeveloped.”
  • Sir Prof Jim Skea: “There are huge knowledge gaps around overshoot and carbon dioxide removal.”
  • Prof Kristie Ebi: “If there is going to be a peak – and, of course, we don’t know what that peak is – then how do you start planning?”
  • Prof Lavanya Rajamani: “To me, a key governance unknown is the extent to which our current legal and regulatory architecture…will actually be responsive to the needs of an overshoot world.”
  • Prof Nebojsa Nakicenovic: “One of my major concerns has been for a long time…is whether, even after reaching net-zero, negative emissions can actually produce a temperature decline.”
  • Prof Debra Roberts: “For me, the big unknown is how all of these areas of increased impact and risk actually intersect with one another and what that means in the real world.”
  • Dr Oliver Geden: “[A key unknown] is whether countries are really willing to commit to net-negative trajectories.”
  • Dr Carl-Friedrich Schleussner: “This is a bigger concern that I have – that we are pushing the habitability in our societies on this planet above that limit and towards maybe existential limits.”
  • Dr Anna Pirani: “I think that tracking global mean surface temperature on an overshoot pathway will be an important unknown.”
  • Prof Richard Betts: “One of the key unknowns is are we going to continue to get the land carbon sink that the models produce.”
  • Prof Hannah Daly: “The biggest unknown is whether countries can translate these global [overshoot] pathways into sustained domestic action…that is politically and socially feasible.”
  • Dr Andrew King: “[W]e still have a lot of uncertainty around other elements in the climate system that relate more to what people actually live through.”
Dr James Fletcher

Dr James Fletcher
Former minister for public service, sustainable development, energy, science and technology for Saint Lucia and negotiator at COP21 in Paris.

The key unknown is where we’re going to land. At what point will we peak [temperatures] before we start going down, and how long will we stay in that overshoot period? That is a scary thing. Yes, there will be overshoot, but at what point will that overshoot peak? Are we peaking at 1.6C, 1.7C, 2.1C? All of these are scary scenarios for small island developing states – anything above 1.5C is scary. Every fraction of a degree matters to us. Where we peak is very important and how long we stay in this overshoot period is equally important. That’s when you start getting into very serious, irreversible impacts and tipping points.

Prof Shobha Maharaj

Prof Shobha Maharaj
Adjunct professor at the University of Fiji and a coordinating lead author for Working Group II of the IPCC’s seventh assessment

First of all, there is an assumption that we’re going to go back down from overshoot. Back down is not a given. And secondly, we are still in the phase where we are talking about uncertainty. Climate scientists don’t like uncertainty. We are not acknowledging that uncertainty is the new normal… But because we’re so bogged down in terms of uncertainties, we are not moving towards [the issue of] what we do about it. We know it’s coming. We know the temperatures are going to be high. But there is little talk about the action. 

The focus seems to be more on how we can understand this or how we can model this, but not what we do on the ground. Especially when it comes to adaptation planning – [and around] how does this modify whatever the plans are? There are lots of places in the world where adaptation plans have been made to a 1.5C ceiling. The fact is that these plans are going to need to be modified or probably redeveloped. And no one is talking about this, especially in the areas that are least resourced in the world – which sets up a big, big problem.

Sir Prof Jim Skea

Sir Prof Jim Skea
Chair of the Intergovernmental Panel on Climate Change (IPCC) and emeritus professor at Imperial College London’s Centre for Environmental Policy

There are huge knowledge gaps around overshoot and carbon dioxide removal. As it’s very clear from the themes of this conference, we don’t altogether understand how the Earth would react in taking carbon dioxide out of the atmosphere. We don’t understand the nature of the irreversibilities and we don’t understand the effectiveness of CDR techniques, which might themselves be influenced by the level of global warming, plus all the equity and sustainability issues surrounding using CDR techniques.

Prof Kristie Ebi

Prof Kristie Ebi
Professor of global health at the University of Washington‘s Center for Health and the Global Environment

There are all kinds of questions about adaptation and how to approach effective adaptation. At the moment, adaptation is primarily assuming a continual increase in global mean surface temperature. If there is going to be a peak – and of course, we don’t know what that peak is – then how do you start planning? Do you change your planning? There are places, for instance when thinking about hard infrastructure, [where overshoot] may result in a change in your plan – because as you come down the backside, maybe the need would be less. For example, when building a bridge taller. And when implementing early warning systems, how do you take into account that there will be a peak and ultimately a decline? There is almost no work in that. I would say that’s one of the critical unknowns.

Prof Lavanya Rajamani

Prof Lavanya Rajamani
Professor of international environmental law at the University of Oxford

I think there are several scientific unknowns, but I would like to focus on the governance unknowns with respect to overshoot. To me, a key governance unknown is the extent to which our current legal and regulatory architecture – across levels of governance, so domestic, regional and international – will actually be responsive to the needs of an overshoot world and the consequences of actually not having regulatory and governance architectures in place to address overshoot.

Prof Nebojsa Nakicenovic

Prof Nebojsa Nakicenovic
Distinguished emeritus research scholar at the International Institute for Applied Systems Analysis and executive director of The World In 2050.

One of my major concerns has been for a long time – as it was clear that we are heading for an overshoot, as we are not reducing the emissions in time – is whether, even after reaching net-zero, negative emissions can actually produce a temperature decline…In other words, there might be asymmetry on the way down [in the global-temperature response to carbon removal] – it might not be symmetrical to the way up [as temperature rise in response to carbon emissions]. And this is really my major concern, that we are planning measures that are so uncertain that we don’t know whether they will reach the goal. 

The last point I want to make is that I think that the scientific community should, under all conditions, make sure that the highest priority is on mitigation.

Prof Debra Roberts

Prof Debra Roberts
Honorary professor at the University of KwaZulu-Natal, coordinating lead author on the IPCC’s forthcoming special report on climate change and cities, board chair of the Red Cross Red Crescent Climate Centre and co-chair of Working Group II for the IPCC’s sixth assessment

Well, I think coming from the policy and practitioner community, what I’m hearing a lot about are the potential impacts that come from the exceedance component of overshoot. What I’m not hearing a lot about is the responses to overshoot and their impacts – and how those impacts might interact with the impacts from temperature exceedance. So there’s quite a complex risk landscape emerging. It’s three dimensional in many ways, but we’re only talking about one dimension and, for policymakers, we need to understand that three dimensional element in order to understand what options remain on the table. For me, the big unknown is how all of these areas of increased impact and risk actually intersect with one another and what that means in the real world.

Prof Oliver Geden

Dr Oliver Geden
Senior fellow and head of the climate policy and politics research cluster at the German Institute for International and Security Affairs and vice-chair of IPCC Working Group III

[A key unknown] is whether countries are really willing to commit to net-negative trajectories. We are assuming, in science, global pathways going net negative, with hardly any country saying they want to go there. So maybe it is just an academic thought experiment. So we don’t know yet if [overshoot] is even relevant. It is relevant in the sense that if we do, [the] 1.5C [target] stays on the table. But I think the next phase needs to be that countries – or the UNFCCC as a whole – needs to decide what they want to do. 

Dr Carl-Friedrich Schleussner

Dr Carl-Friedrich Schleussner
Research group leader and senior research scholar at the International Institute for Applied Systems Analysis

I’m convinced that there’s an upper limit of overshoot that we can afford – and it might be not far outside the Paris range [1.5C-2C] – before human societies will be overwhelmed with the task of bringing temperatures back down again. This [societal limit] is lower than the geophysical limits or the CDR limit.

The impacts of climate change and the challenges that will come with it will undermine society’s abilities to cooperatively engage in what is required to achieve long-term temperature reversal. This is a bigger concern that I have – that we are pushing the habitability in our societies on this planet above that limit and towards maybe existential limits. We may not be able to walk back from it, even if we wanted to. That is a big unknown to me.

I’m convinced that there is an upper limit to how much overshoot we can afford, and it might be just about 2C or a bit above – it might not be much more than that. But we do not have good evidence for this. But I think these scenarios of going to 3C and then assuming we can go back down – I have doubts that future societies grappling with the impacts of climate change will be in the position to embark on such an endeavour.

Dr Anna Pirani

Dr Anna Pirani
Senior research associate at the Euro-Mediterranean Center on Climate Change (CMCC) and former head of the Technical Support Unit for Working Group I of the IPCC

I think that tracking global mean surface temperature on an overshoot pathway will be an important unknown – how to take account of natural variability in that context, to inform where we are on an overshoot pathway and how well we’re doing on it. I think, methodologically, that would prove to be a challenge. The fact that it occurs over many, many years – many decades – and, yet, we sort of think about it as a nice curve. We see these graphs that say “by the 2050s, we will be here and we’ll start declining and so on”. I think that what that actually translates to in the evolution of global surface temperatures is going to be very difficult to measure and track. Even how we report on that, internationally, in the UNFCCC [UN Framework Convention on Climate Change] context and what the WMO [World Meteorological Organization] does in terms of reporting an overshoot trajectory, that would be quite a challenge. 

Prof Richard Betts

Prof Richard Betts
Head of climate impacts research in the Met Office Hadley Centre and professor at the University of Exeter

One of the key unknowns is are we going to continue to get the land carbon sink that the models produce. We have got model simulations of returning from an overshoot. 

If you are lowering temperatures, you have got to reduce emissions. The amount you reduce emissions depends on how much carbon is taken up naturally by the system – by forests, oceans and so on. The models will do this; they give you an answer. But we don’t know whether they are doing the right thing. They have never been tested in this kind of situation.

In my field of expertise, one of the key [unknowns] is how these carbon sinks are going to behave in the future. That is why we are trying to get real-world data into the models – including through the Amazon FACE project – so we can really try and narrow the uncertainties in future carbon sinks. If the carbon sinks are weaker than the models think, it is going to be even harder to reduce emissions and we will need to remove even more by carbon capture and removal. 

Prof Hannah Daly

Prof Hannah Daly
Professor of sustainable energy at University College Cork

We know ever more about the profound – and often irreversible – damages that will be felt as we overshoot 1.5C. Yet we seem no closer to understanding what will unlock the urgent decarbonisation that remains our only way to avoid the worst impacts of climate change. 

Global models can show, on paper, what returning temperatures to safer levels after overshoot might look like. The biggest unknown is whether countries can translate these global pathways into sustained domestic action – over decades and without precedent in history – that is politically and socially feasible.

Dr Andrew King

Dr Andrew King
Associate professor in climate science at the University of Melbourne

I think, firstly, can we actually achieve net-negative emissions to bring temperatures down past a peak? It’s a completely different world and, unfortunately, it’s likely to be challenging and we’re setting ourselves up to need to do it more. So I think that’s a huge unknown. 

But then, beyond that, I think also, whilst we’ve built some understanding of how global temperature would respond to net-zero or net-negative emissions, we still have a lot of uncertainty around other elements in the climate system that relate more to what people actually live through. In our warming world, we’ve seen that global warming relates to local warming being experienced by everyone at different amounts. But, in an overshoot climate, we would see quite diverse changes for different people, different areas of the world, experiencing very different changes in our local climates. And also definitely worsening of some climate hazards and possibly reversibility in others, so a very different risk landscape as well, emerging post net-zero – and I think we still don’t know very much about that as well.

Original article by Cecilia Keating and Robert McSweeney republished from Carbon Brief under a CC license

Nigel Farage urges you to ignore facts and reality and be a climate science denier like him and his Deputy Richard Tice. He says that Reform UK has received £Millions and £Millions from the fossil fuel industry to promote climate denial and destroy the planet.
Donald Trump urges you to be a Climate Science denier like him. He says that he makes millions and millions for destroying the planet, Burn, Baby, Burn and Flood, Baby, Flood.
Elon Musk urges you to be a Fascist like him, says that you can ignore facts and reality then.

Continue ReadingExperts: The key ‘unknowns’ of overshooting the 1.5C global-warming limit

Analysis: Clean energy just put China’s CO2 emissions into reverse for first time

Spread the love

Original article by Lauri Myllyvirta republished from Carbon Brief under a CC license

Workers install solar photovoltaic panels in Yinchuan, China. Credit: Cynthia Lee / Alamy Stock Photo

For the first time, the growth in China’s clean power generation has caused the nation’s carbon dioxide (CO2) emissions to fall despite rapid power demand growth.

The new analysis for Carbon Brief shows that China’s emissions were down 1.6% year-on-year in the first quarter of 2025 and by 1% in the latest 12 months.

Electricity supply from new wind, solar and nuclear capacity was enough to cut coal-power output even as demand surged, whereas previous falls were due to weak growth.

The analysis, based on official figures and commercial data, shows that China’s CO2 emissions have now been stable, or falling, for more than a year.

However, they remain only 1% below the latest peak, implying that any short-term jump could cause China’s CO2 emissions to rise to a new record.

Other key findings include:

  • Growth in clean power generation has now overtaken the current and long-term average growth in electricity demand, pushing down fossil fuel use.
  • Power-sector emissions fell 2% year-on-year in the 12 months to March 2025.
  • If this pattern is sustained, then it would herald a peak and sustained decline in China’s power-sector emissions.
  • The trade “war” initiated by US president Donald Trump has prompted renewed efforts to shift China’s economy towards domestic consumption, rather than exports.
  • A new pricing policy for renewables has caused a rush to install before it takes effect.
  • There is a growing gap that would need to be bridged if China is to meet the 2030 emissions targets it pledged under the Paris Agreement.

If sustained, the drop in power-sector CO2 as a result of clean-energy growth could presage the sort of structural decline in emissions anticipated in previous analysis for Carbon Brief.

The trend of falling power-sector emissions is likely to continue in 2025.

However, the outlook beyond that depends strongly on the clean energy and emissions targets set in China’s next five-year plan, due to be published next year, as well as the economic policy response to the Trump administration’s hostile trade policy.

China’s emissions decline due to clean power

Over the past decade, China’s CO2 emissions from fossil fuels and cement have risen by nearly a fifth, but there have been ups and downs along the way.

The shallow decline in 2015 and 2016 was due to a slump that followed a round of stimulus measures, while zero-Covid controls caused a sharper fall in 2022. Overall, however, emissions have continued to increase, pausing only during periods of economic stress.

More recently, there have been signs that China’s CO2 emissions could be close to reaching a peak and plateau, or even a period of structural decline.

The latest data, for the first quarter of 2025, shows that China’s CO2 emissions have now been stable or falling for more than a year, as shown in the figure below.

However, with emissions remaining just 1% below the recent peak, it remains possible that they could jump once again to a new record high.

China's CO2 emissions drop due to clean energy for first time
China’s emissions from fossil fuels and cement, million tonnes of CO2, rolling 12-month totals. Source: Emissions are estimated from National Bureau of Statistics data on production of different fuels and cement, China Customs data on imports and exports and WIND Information data on changes in inventories, applying emissions factors from China’s latest national greenhouse gas emissions inventory and annual emissions factors per tonne of cement production until 2024. Sector breakdown of coal consumption is estimated using coal consumption data from WIND Information and electricity data from the National Energy Administration.

Therefore, the future path of China’s CO2 emissions hangs in the balance, depending on trends within each sector of its economy, as well as China’s response to Trump’s tariffs.

These sectoral trends are explored further in the sections below, along with signals on what could be coming next from Chinese policymakers as they consider the country’s international climate pledge for 2035 and the five-year plan for 2026-2030.

Power-sector emissions fall while other sectors rebound

The reduction in China’s first-quarter CO2 emissions in 2025 was due to a 5.8% drop in the power sector. While power demand grew by 2.5% overall, there was a 4.7% drop in thermal power generation – mainly coal and gas.

Increases in solar, wind and nuclear power generation, driven by investments in new generating capacity, more than covered the growth in demand. The increase in hydropower, which is more related to seasonal variation, helped push down fossil power generation.

Power-sector emissions fell by more than total generation from fossil fuels, as the share of biomass and gas increased, while average coal power plant efficiency improved.

Specifically, the average amount of coal needed to generate each unit of electricity at coal-fired power plants fell by 0.9% year-on-year.

The first-quarter reduction in CO2 emissions from coal use in the power sector is shown at the bottom of the figure below, below CO2 changes in other sectors.

Chart: Falling CO2 due to clean power outweighed rises elsewhere
Year-on-year change in China’s CO2 emissions from fossil fuels and cement, for the period January-March 2025, million tonnes of CO2. Source: Emissions are estimated from National Bureau of Statistics data on production of different fuels and cement, China Customs data on imports and exports and WIND Information data on changes in inventories, applying emissions factors from China’s latest national greenhouse gasemissions inventory and annual emissions factors per tonne of cement production until 2024. Sector breakdown of coal consumption is estimated using coal consumption data from WIND Information and electricity data from the National Energy Administration.

Outside of the power sector, emissions increased 3.5%, with the largest rises in the use of coal in the metals and chemicals industries.

The coal-to-chemicals industry is undergoing rapid expansion, driven by concerns about dependence on imported oil and gas. During the first quarter of 2025, it was also benefiting from more favourable economics due to lower coal prices and relatively high oil prices.

Crude steel production increased 0.6% year-on-year, metal products output by 6% and non-ferrous metals production by 2%. All of these increases were mainly due to a jump in March. Metals demand was boosted by the bump in exports ahead of the tariffs, but high output has continued well into April.

Real-estate construction “starts” fell by 24% and sales of new properties by 3%, indicating that the demand for cement, steel and glass from the construction sector continues to decline.

In contrast, economic output in vehicle and machinery production increased by 12% and 13%, respectively, signalling increased demand for metals.

Cement production fell by 1.4%, a slower rate of decrease than in previous years, likely due to an earlier start to weather-dependent construction activity thanks to warm weather.

Gas consumption increased by an estimated 6% in the power sector, due to a 14% increase in gas-fired power generation capacity, even as the average utilisation of the plants fell. However, gas consumption fell in other sectors, outweighing the increase for power.

Oil products consumption increased slightly, as shown by the bar at the top in the figure above. Warmer weather meant that weather-dependent construction and agricultural activity rose earlier in the year than usual.

However, structural factors, particularly vehicle electrification and the shift to liquified natural gas (LNG) in the freight sector, point to continued declines in oil demand.

Have China’s emissions peaked?

Following the 1.6% decline in the first quarter of 2025, China’s emissions have now been stable or falling for more than a year, starting from the beginning of March 2024.

However, emissions in the 12 months to the end of March 2025 were down only 1% from their recent peak, implying that any short-term jump could lead to a new record high.

After the sharp reduction in the first quarter, emissions from power generation are now down year-on-year for the most recent 12 months.

This has happened four times before over the past four decades – in 2009, 2012, 2015 and 2022. However, the current drop is the first time that the main driver is growth in clean power generation.

The falls in 2009 and 2012 were related to the global financial crisis and the Euro area crisis, while the drop in 2015 was driven by the construction and industrial sector slump that followed the 2008-12 stimulus program.

These economic shocks resulted in the sharp reduction in electricity demand shown in the figure below. The drop in 2022 was a combination of slow power demand growth due to strict “zero-Covid” measures and relatively strong clean-power additions.

Chart: For the first time, clean energy growth has cut China's fossil-fuel power in the face of surging electricity demand
Year-on-year change in electricity generation from fossil fuels and clean energy, terawatt hours, rolling 12-month totals. The total annual change in demand is shown by the solid line and the average annual increase is shown by the dotted line. Sources: China Electricity Council; Ember; analysis for Carbon Brief by Lauri Myllyvirta.

Importantly, the growth in clean power generation in the first quarter of 2025 was not only larger than the rise in demand overall, it was also higher than the average increase in demand over the past 15 years, marked by the dashed line in the figure above.

Moreover, hydropower has been stable year-on-year in the past six months, implying that the clean-energy growth has been driven by increases in solar, wind and nuclear power capacity, not year-to-year variation in hydropower output.

Looking beyond electricity generation, all sectors registered a fall in emissions over the most recent four months from December 2024 to March 2025, except for coal-to-chemicals.

In order for China’s emissions overall to peak and then start declining, CO2 cuts in declining sectors will need to outweigh continued growth elsewhere.

For example, process emissions from cement production peaked in 2021 and have declined by 27% since then, as shown in the top left chart in the figure below.

Six line charts of China's sectoral emissions: CO2 emissions have fallen in most sectors this year
Sectoral emissions from fossil fuels and cement, million tonnes of CO2, rolling 12-month totals. Source: Emissions are estimated from National Bureau of Statistics data on production of different fuels and cement, China Customs data on imports and exports and WIND Information data on changes in inventories, applying emissions factors from China’s latest national greenhouse gas emissions inventory and annual emissions factors per tonne of cement production until 2024. Sector breakdown of coal consumption is estimated using coal consumption data from WIND Information and electricity data from the National Energy Administration.

Coal use outside the power and chemicals sectors peaked at the same time as cement, but has been rebounding since then and is now close to previous peak levels.

The China Coal Association expects coal use in the steel and building materials industries to fall, while coal consumption in the chemical industry is projected to continue growing.

Hopes of future growth in demand for coal are pinned on the chemical sector, described as a shift from using coal primarily as a fuel to a role as both a fuel and a raw material.

The association also believes that coal-fired power generation will resume growth – at least in the short term – but it recently revised down its projections for 2025 compared with the outlook at the end of 2024.

The tariff “war” may have affected expectations. One analysis suggests a 0.5 to 1 percentage point reduction in China’s GDP growth rate due to the tariffs could result in a similar reduction in demand for thermal coal – mainly used at power stations.

Oil product consumption has been declining since the post-Covid rebound ended in March 2024, falling 2% from its peak. The long-term trend is expected to be downwards, due to the electrification of transportation, despite rising demand for chemicals and aviation.

Gas use has been falling for a few months, but the trend is likely still increasing.

The table below lists the 12-month periods with the highest emissions for each sector, as well as the reduction since the latest peak in each case.

SectorDate of highest emissionsReduction since peak
CementApril 2021-28.2%
Coal and gas: PowerNovember 2024-1.7%
Coal-to-chemicalsMarch 2025Still increasing
Coal: Other sectorsApril 2021-3.0%
Gas: Other sectorsDecember 2024-0.8%
Oil productsApril 2024-1.0%
Total CO2February 2024-0.8%

For all of the sectors other than cement production, it is too early to declare a definitive peak in emissions. Still, there are signs that other sectoral peaks could be past their peak, too.

Indeed, for oil products consumption and steel production, industry projections indicate that the future trend is likely to be falling.

For the power sector, clean-energy additions at or above current levels would likely lead to a structural peak, as clean-energy growth would more than cover electricity demand growth.

Together, these sectors cover more than 80% of China’s total emissions. If all of them enter a structural decline, then total emissions are very likely to do so too.

China pushes domestic demand in response to US tariffs

The economic and emissions outlook for this year and beyond will be affected by the Trump administration’s unprecedented trade tariffs – and China’s counter-measures.

The initial impact was a drop in emissions due to lower factory output in export-oriented coastal provinces and possible knock-on impacts on investment and consumer spending.

Conversely, the temporary easing of tariffs for 90 days will lead to a rush of orders from the US to make up for the short-lived slowdown in trade and to stockpile goods before the relief ends.

China’s reactions to the tariffs focused on counteracting the economic impacts with stimulus.

An anonymous comment piece in People’s Daily, the main Communist party affiliated newspaper, says the country should “strive to make consumption the main driving force and ballast stone of economic growth”, leveraging China’s large domestic market.

(The piece has the byline “People’s Daily commentator”, which implies that it is written by someone with authority.)

The article says that this will involve increasing consumer income, while easing financial and social burdens to boost purchasing power and willingness to consume.

While the temporary easing of tariffs will reduce the urgency of these measures, the US tariff rate on China, at 40%, remains much higher than it was before Trump’s presidency – and China’s leaders will likely want to prepare against the risk of renewed tariff hikes.

The focus will be creating domestic markets for the products China exports to the US. The long-held aim of rebalancing China’s economy towards consumption could finally become reality as a result. A successful rebalancing could mean less energy-intensive growth.

China’s response also includes redoubling its focus on “new quality productive forces”, a concept that emphasises new technology.

The concept includes the clean-energy industry, which has become such an important economic driver in China that it would be hard to leave out of stimulus plans.

A new list of low-carbon demonstration projects, published by the National Development and Reform Commission, provides a look at China’s priorities for clean-energy investment. Green hydrogen, energy storage, “virtual power plants” and industrial decarbonisation based on hydrogen are new growth areas.

In terms of the emissions implications of China’s response to Trump’s tariffs, the big question is whether stimulus focused at these favoured sectors – including the new low-carbon focus areas and other clean-energy industries – is deemed sufficient.

Some traditional recipients of stimulus spending, such as shipbuilding and public infrastructure, have already posted strong growth in the first quarter of this year as a result of stimulus measures announced in 2024.

New wind and solar pricing policy increases uncertainty

An additional source of uncertainty for China’s emissions comes in the form of its new electricity pricing policy for renewable energy, which enters into force in June.

The new policy removes price guarantees pegged to coal-power prices, with new wind and solar projects supposed to secure direct contracts with electricity buyers. This is likely to lead to lower prices being paid to new wind and solar projects.

However, it offers more favourable pricing – via “contracts for difference” – to the amount of new capacity needed to meet central government energy targets.

The immediate effect of the policy will likely be a rush of projects rushing to complete installation before the June deadline, so as to secure guaranteed prices.

This rush was already apparent in the latest data: 23 gigawatts (GW) of solar and 13GW of wind was added in March alone, up 80% and 110% from previous records for the month.

Furthermore, this year’s installations are likely to be very strong, even topping last year’s record, as a lot of centralised solar power and wind-power projects are racing to complete before the end of the 14th five-year plan period. 

The China Wind Energy Association expects a new record of 105-115GW installed this year across onshore and offshore wind projects – up from the record-breaking 80GW last year – based on very active bidding last year. It also expects volumes to stay at that level even in 2026 and to then grow further towards 2030. 

The China Electricity Council predicts an even larger wind-power capacity addition of 120GW in 2025. Another analyst projects a 20% drop in wind-power capacity additions in 2026, but after an even steeper increase in 2025 to 120-130GW of capacity added. So he also expects 2026 installations to be far above the current record year of 2024.

For solar, the China Photovoltaic Industry Association forecasts a drop in installations of 8-23% this year, from the staggering record of 278GW last year. Even the low end of this projection would see installations stay at 2023 levels in 2025 and then recover from there.  The China Electricity Council’s projection for solar additions in 2025 matches the low end of the industry association’s forecast.

The figure below, based on these various projections, shows that additional electricity generation from new clean power capacity is expected to remain above last year’s record-breaking levels in both 2025 and 2026.

Bar chart: Newly added clean generation is set to remain above the record levels set in 2024
Annual electricity generation from clean power capacity newly added each year, terawatt hours by source. Two alternative projections for 2025 are taken from a range of different organisations, while the 2026 projection is a combined total from the wind and solar industry associations. Power generation from new capacity is projected using average capacity factors for each technology over 2015–2024. Sources: Historical data from China Electricity Council; projections from China Wind Energy Association, China Photovoltaic Industry Association and China Electricity Council; analysis for Carbon Brief by Lauri Myllyvirta.

The projections shown in the figure above illustrate that the energy industry expects to be able to navigate the new renewable pricing policy and to maintain a high level of wind and solar additions over the next two years.

The policy has, however, created a lot more uncertainty. The stop-go cycle of a flood of installations in the first half of this year and then a slowdown in the second half – likely especially in the distributed solar segment – is likely to be a tough time for the industry. 

The uncertainty relates above all to two things. First is the local implementation of the policy, as provincial governments have a lot of leeway here. Given the economic significance of clean energy for many provinces, they can be expected to seek to implement the policy in a way that minimises disruptions to the industry.

The other source of uncertainty is central government targets. The pricing policy ties the availability of more favorable pricing to central government energy targets, after clean-energy growth outpaced those targets by a wide margin in the past few years. 

This emphasises the importance of the targets set for the next five year plan. The National Energy Administration (NEA) is targeting “more than 200GW” per year of clean-energy capacity added, which is far lower than the 360GW added last year. 

The effect of the pricing policy also depends on market conditions, of course, with a risk of oversupply of coal-fired power due to the ongoing rapid addition of new coal-fired power plants.

China’s nuclear construction also keeps accelerating, with another 10GW of reactor projects approved in April, on top of 10GW approved in each of the previous two years. These projects will contribute to clean power supply towards 2030 as they are completed.

China faces widening gap to Paris pledge

The uncertainty around wind and solar expansion also has implications for China’s international climate pledges under the Paris Agreement.

After exceptionally slow progress in 2020-23, China is significantly off track for its 2030 commitment to reduce carbon intensity – the emissions per unit of economic output. It is almost certain to miss its 2025 target. Carbon intensity fell by 3.4% in 2024, falling short of the rate of improvement needed to meet the 2025 and 2030 targets.

The government work plan for 2025 did not set a carbon intensity target. It only included a target for reducing the intensity per unit of GDP for energy supply from fossil fuels by 3%, excluding use for raw materials.

This provides an indirect indication of the targeted improvement in carbon intensity. In 2024, carbon intensity fell by 3.4%, while fossil energy intensity fell by 3.8%. If the ratio is similar in 2025, then carbon intensity would need to fall by around 2.5% at a minimum, allowing CO2 emissions to increase by more than 2%, if the target for 5% GDP growth is also met.

The absence of a carbon intensity target and the lack of emphasis on reducing carbon intensity also signals that meeting the target is not seen as a priority at the moment.

The government work plan emphasised the “dual-carbon” goals of peaking CO2 emissions before 2030 and achieving carbon neutrality before 2060.

However, these goals allow CO2 emissions to continue to increase until the end of the decade, implying the potential for a significant absolute emission increase from 2024 levels by 2030. The “dual-carbon” goals, even if met, therefore do not guarantee the delivery of China’s current key international climate commitment, the 2030 carbon-intensity target.

Even if emissions fell this year, improvements to carbon intensity would need to accelerate sharply in the next five years to meet China’s 2030 Paris commitment.

If China remains committed to its 2030 pledge, then this acceleration would need to be reflected in the targets set in the country’s next five-year plan.

Outlook for 2025 and beyond

The past 12 months mark a potentially significant turning point for China’s CO2 emissions, with clean-energy growth for the first time outpacing demand growth and displacing fossil fuel use in the power sector.

Record-breaking clean energy additions expected in 2025, despite new pricing policy uncertainties, suggest that the trend will continue this year.

The longer-term trajectory depends heavily on the targets set in the upcoming five-year plan and on the economic policy response to US tariffs and other economic headwinds.

In the short term, the US tariffs will dampen energy demand growth and emissions. Economic policy designed to offset the impacts of Trump’s tariffs will likely boost the clean-energy sector further and might lead to a shift towards domestic consumption as an economic driver, implying lower energy consumption growth relative to GDP. 

On the other hand, previous rounds of economic stimulus in China have led to sharp increases in emissions. If China is to deliver stimulus that targets consumption and new technology, rather than emissions-intensive construction and heavy industry, then it will require a significant break with earlier patterns.

Whether power-sector emissions have peaked will be determined by a race between growth in clean energy supply and total power demand growth. 

The new renewable electricity pricing policy, which ties the volume of “contracts for difference” given out to new solar and wind projects to national clean energy targets, further increases the importance of target-setting in China’s upcoming 2035 climate targets under the Paris Agreement and in the next 15th five-year plan, covering 2026-2030.

Sector-by-sector analysis suggests that, in addition to the power sector, emissions have likely also peaked in the building materials and steel sectors, as well as oil products consumption.

These sectors together represent over 80% of China’s fossil fuel-related CO2 emissions. However, there are uncertainties and potential for short-term rebound in all of these sectors.

The sector with remaining potential for substantial emissions growth is coal-to-chemicals. The drop in oil prices after US tariff announcements will undermine the profitability of this sector and likely lead to lower utilisation of plants, even as more capacity is added. China’s counter-tariffs on imports of petrochemical products from the US could have benefited the industry – but these have reportedly been waived.

All of this suggests that there is potential for China’s emissions to continue to fall and for the country to achieve substantial absolute emissions reductions over the next five years.

However, policy choices working in the opposite direction could just as easily see emissions increase further towards 2030.

About the data

Data for the analysis was compiled from the National Bureau of Statistics of China, National Energy Administration of China, China Electricity Council and China Customs official data releases, and from WIND Information, an industry data provider.

Wind and solar output, and thermal power breakdown by fuel, was calculated by multiplying power generating capacity at the end of each month by monthly utilisation, using data reported by China Electricity Council through Wind Financial Terminal.

Total generation from thermal power and generation from hydropower and nuclear power was taken from National Bureau of Statistics monthly releases.

Monthly utilisation data was not available for biomass, so the annual average of 52% for 2023 was applied. Power sector coal consumption was estimated based on power generation from coal and the average heat rate of coal-fired power plants during each month, to avoid the issue with official coal consumption numbers affecting recent data. 

When data was available from multiple sources, different sources were cross-referenced and official sources used when possible, adjusting total consumption to match the consumption growth and changes in the energy mix reported by the National Bureau of Statistics.

CO2 emissions estimates are based on National Bureau of Statistics default calorific values of fuels and emissions factors from China’s latest national greenhouse gas emissions inventory, for the year 2018. Cement CO2 emissions factor is based on annual estimates up to 2024.

For oil consumption, apparent consumption is calculated from refinery throughput, with net exports of oil products subtracted.

Original article by Lauri Myllyvirta republished from Carbon Brief under a CC license

Orcas comment on killer apes destroying the planet by continuing to burn fossil fuels.
Continue ReadingAnalysis: Clean energy just put China’s CO2 emissions into reverse for first time