Reeves’s Heathrow third runway report was commissioned by London airport

Spread the love

https://www.theguardian.com/environment/2025/feb/01/reevess-heathrow-third-runway-report-was-commissioned-by-london-airport

The chancellor is under fire after a study cited as evidence for expanding the terminal to boost the UK’s economic growth was ordered by Heathrow itself

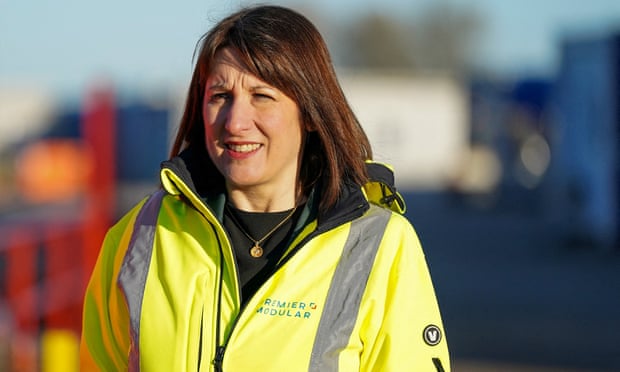
Rachel Reeves was facing criticism on Saturday night as it was confirmed that a report she cited as evidence that a third ­runway at Heathrow would boost the UK economy was commissioned by the airport itself.

Experts and green groups also challenged Reeves’s view that advances in the production of ­sustainable aviation fuel (SAF) had been a “gamechanger” that would substantially limit the environmental damage of flying, ­saying the claims were overblown and did not stand up to scrutiny.

Alex Chapman, senior economist at the NEF, said: “It is very concerning that the chancellor appears to be basing her support for Heathrow expansion on a figure from a report commissioned by Heathrow airport.

“Even more worrying is the fact that the methodology they have applied is one that the Department for Transport has previously decided is not fit for purpose, and that the report uses forecast data supplied by the airport itself.

“Heathrow expansion represents a major threat to the UK’s climate goals and flies in the face of scientific advice. To ensure that the claimed economic benefits are concrete, assessments should be carried out by independent government economists following best-practice methodology.

“NEF’s analysis has identified a wide range of weaknesses in the economic case, which have emerged since it was last fully appraised in 2015. Not least, the decline of business air travel, the surge in outbound leisure travel and the negative impacts on wider regions of the UK – all of which erode the potential growth benefit.”

Analysis by climate crisis website Carbon Brief suggests that, using the government’s own figures, SAF will barely cut emissions by 2040, and any reduction will be wiped out by rising flight numbers.

https://www.theguardian.com/environment/2025/feb/01/reevess-heathrow-third-runway-report-was-commissioned-by-london-airport

Continue ReadingReeves’s Heathrow third runway report was commissioned by London airport

Analysis: UK would need forest ‘twice size of London’ to offset new airport expansion

Spread the love

Original article by Josh Gabbatiss Verner Viisainen republished from Carbon Brief.

Planes queuing for takeoff at Heathrow airport in Britain. Credit: david pearson / Alamy Stock Photo

A forest twice the size of Greater London would need to be planted in the UK to cancel out the extra emissions from the expansion of Heathrow, Gatwick and Luton airports, Carbon Brief analysis reveals.

New runaways at these airports surrounding London would result in cumulative emissions of around 92m tonnes of extra carbon dioxide equivalent (CO2e) by 2050, if the number of flights increases in line with their operating company targets.

If the UK is to remain on track for net-zero, it would need to cut emissions further in other sectors of the economy or remove an equivalent amount from the atmosphere.

For example, offsetting these emissions would require more than 300,000 hectares of trees to be planted within just a few years. This equates to all the trees planted in the UK since 2000.

The Labour government is set to back all three airport expansions, according to media reporting ahead of a speech by chancellor Rachel Reeves this week. 

This is in spite of opposition from within the Labour party and the government’s climate advisors recommending against airport expansion. 

Reeves has stressed that “sustainable aviation fuels” (SAFs) and electric planes could help to offset these emissions.

However, such technologies are still in the early stages of deployment and previous Carbon Brief analysis suggests the role of SAFs in achieving net-zero may be limited.

Two Londons

Reeves is expected to reveal plans for a third runway at Heathrow in a speech on Wednesday. 

This, alongside suggestions she will also announce her support for the expansion of Gatwick and Luton airports, has prompted days of political debate over the friction between the government’s climate and economic plans.

Reeves sees the expansion of airports as a key part of the government’s “growth strategy”. However, senior Labour politicians, notably energy secretary Ed Miliband, have previously opposed such expansions on environmental grounds.

For her part, the chancellor told BBC News that she thought “sustainable aviation and economic growth go hand in hand”.

Carbon Brief has used estimates of passenger numbers from the airports’ planning applications, combined with assumptions used by UK government advisors the Climate Change Committee (CCC), to calculate emissions from the three expansions.

As the chart below shows, the CCC assumes aviation emissions fall in the coming years due to technological and efficiency improvements.

However, the expansion of Heathrow, Gatwick and Luton would drive an uptick in emissions around 2040 as the projects are completed, if the expected number of extra flights take off and if there are no additional improvements in aircraft efficiency.

This would amount to an additional 92MtCO2e being emitted cumulatively by 2050.

In order to remain on track for the UK’s net-zero target, these emissions would need to be avoided by additional technological innovations in the aviation sector, balanced by faster cuts in other parts of the economy – or removed from the atmosphere after being emitted.

Annual UK aviation emissions, MtCO2e.
Annual UK aviation emissions, MtCO2e. The blue line indicates the trajectory for emissions set out by the CCC. The three red lines indicate the additional emissions that would result from the expansion of Heathrow, Gatwick and Luton airports, plus the resulting flights. The airport expansions are assumed to follow approximate timelines based on their respective planning applications, with some dates assumed based on the views of AEF. The Heathrow expansion is assumed to be in operation in 2035 and at full capacity by 2040. The Gatwick expansion is assumed to be operational in 2028 and at full capacity by 2038. The Luton expansion is assumed to be operational in 2033 and at full capacity by 2043. Sources: DESNZ, CCC, AEF, airport planning documents.

Aviation is generally viewed as a difficult sector to decarbonise, due to the lack of cheap and effective technologies to cut emissions from planes.

This is why campaigners and researchers frequently stress demand reduction as the most effective way to cut aviation emissions.

The UK’s net-zero plans already allow for aviation to be one of the final sectors producing sizable volumes of emissions in 2050, when most of the economy has decarbonised.

One strategy to remove the excess emissions from the additional Heathrow, Gatwick and Luton flights would be to plant more trees. However, this would be a significant undertaking, as Carbon Brief analysis shows.

It would require planting around 301,000 hectares of new forest by around 2028 so that the trees are large enough by the middle of the century to absorb significant amounts of CO2. 

This is equivalent to around twice the size of Greater London, which covers 157,000 hectares. It is 10 times higher than the UK’s most recent annual tree-planting target and equates to all of the trees planted in the past 24 years across the country.

More passengers

Government advisors at the CCC have recommended that there should be no more than a 25% growth in the number of air passengers from 2018 levels, in order to meet the UK’s net-zero goal by 2050.

This amounts to an increase from 292 million passengers to 365 million by 2050. The number of UK flights collapsed during Covid-19 lockdowns and has been slow to recover to pre-pandemic levels, but the number of air passengers in 2023 reached 273 million.

The CCC has consistently stressed that there should be “no net increase” in airport capacity if the UK is to reach net-zero by the middle of the century, meaning any expansion is “balanced by reductions in capacity elsewhere”. It has also stated there should be no airport expansion without a UK-wide framework for managing capacity.

The committee criticised the previous Conservative government for setting “no plans” to limit growth in passenger numbers in its “jet-zero” strategy, which envisaged demand for flying increasing by 70% out to 2050.

Airport expansion at Heathrow, Gatwick and Luton would help bring the total number of passengers at these three sites up to 243 million in 2050, according to the airports’ own planning applications, compiled by the Aviation Environment Federation (AEF).

This amounts to an additional 100m passengers passing through these airports, compared to 2018 levels. This would bring the total number of UK passengers to 392 million – equivalent to a 34% increase in UK airport traffic – meaning that growth at Heathrow, Gatwick and Luton alone would be enough to breach the CCC’s guidance.

(In reality, more than 20 UK airports have plans for more capacity and some already have unused capacity, so it is unlikely that expansion would be limited to three airports around London.)

SAF concerns

The CCC leaves some flexibility in its advice to the government, allowing for future capacity growth, if “the carbon intensity of aviation is outperforming the government’s emissions reduction pathway”. 

Essentially, if clean technologies slash aviation emissions faster than expected, then there will be space for more flights within a pathway to net-zero by 2050.

This has been alluded to by Reeves in recent days. She has stated that a “lot has changed in terms of aviation” and reportedly based an internal proposal to expand Heathrow on the use of “sustainable aviation fuels” (SAFs). 

In reality, there has been very limited progress in developing SAFs or any other technologies to decarbonise planes in the UK. In 2023, the CCC chastised the Conservative government for “rel[ying] heavily on nascent technologies”.

Government modelling has shown SAFs will have a limited impact on cutting UK aviation emissions. Experts have pointed to the issues with the supply of materials for making SAFs and noted that none of the five SAF plants originally pegged to start construction in the UK this year are being built yet.

Methodology

This analysis is based on the CCC’s sixth carbon budget “balanced pathway” for the aviation sector, combined with data obtained from AEF on the expected increase in passenger numbers from the expansion of Heathrow, Gatwick and Luton airports. 

The CCC pathway assumes that the emissions per passenger fall from 0.14 tCO2 in 2020 to 0.06tCO2 in 2050, accounting for the rollout of SAF and more efficient aircraft. It also assumes that no net expansion of airport capacity occurs. 

Therefore, in this analysis, the three airport expansions are considered additional to the emissions included within the CCC pathway. 

To calculate the additional emissions from the expansion of the three airports, the additional passenger numbers this would facilitate are multiplied by the emissions intensity per passenger in each year of the CCC pathway.

The additional passenger numbers from each airport are added to a Department for Transport pathway that assumes no further expansion. Each airport expansion is assumed to ramp up linearly from the year of operation to the year of operation at full additional capacity. 

Based on the airport planning applications and AEF, it is assumed that:

  • The Heathrow expansion will be operational by 2035 and operating at full capacity by 2040.
  • The Gatwick expansion will be operational by 2028 and operating at full capacity by 2038.
  • The Luton expansion will be operational by 2033 and operating at full capacity by 2043.  

The calculated CO2 removals from planting trees are based on assumptions used by the CCC’s sixth carbon budget “balanced pathway”, in which there is a 2:1 ratio of conifers to broadleaves planted across the country.

The CO2 removals per hectare for conifers and broadleaves are taken from the UK Centre for Ecology and Hydrology (CEH), whose numbers are also used by the CCC. 

Based on these numbers, the cumulative emissions removed per hectare of forest after 22 years – from the start of airport expansion in 2028 to 2050 – is 304tCO2. Dividing this value by the total additional cumulative emissions from the airport expansion (92 MtCO2), gives a total area required of 301,000ha. Given that Greater London is 157,200ha, this corresponds to approximately two (1.91) times the area of Greater London.

Historical UK aviation emissions are taken from the Department of Energy Security and Net Zero (DESNZ) up to 2022. For 2023 and 2024, the emissions are estimated based on percentage annual changes in UK jet fuel use, which are then applied to the emissions from 2022.

Original article by Josh Gabbatiss Verner Viisainen republished from Carbon Brief.

Continue ReadingAnalysis: UK would need forest ‘twice size of London’ to offset new airport expansion

Interview: Prof Philippe Sands on UN court’s landmark climate-change hearing

Spread the love

This week, the international court of justice (ICJ) opened two weeks of hearings on states’ climate-related legal obligations – and the consequences, if “significant harm” is caused.

The case stems from a unanimous UN general assembly (UNGA) request for an “advisory opinion” from the ICJ.

It is taking place against a backdrop of rapidly escalating climate impacts. Emissions continue to rise, rather than falling rapidly, as needed to avoid dangerous levels of global warming.

It is the ICJ’s largest ever case, with more than 100 countries and international organisations making interventions, deploying a wide variety of legal arguments.

Ralph Regenvanu, climate envoy for Vanuatu, which led the campaign for the ICJ hearings, said in his opening address: “[T]his may well be the most consequential case in the history of humanity.”

Below, Carbon Brief interviews leading international law scholar Prof Philippe Sands – who drafted the pleadings for Mauritius, but is speaking here in a personal capacity – to find out more about the legal issues at stake and the wider significance of the ICJ case.

Carbon Brief: Would you be able to start by just situating this case in its wider legal context and explaining why it could be so consequential?

Philippe Sands: Well, it’s the first time the international court of justice has been called upon to address legal issues relating to climate change. The ICJ is the principal judicial organ of the United Nations and, although the advisory opinion that it hands down will not be binding on states, it is binding on all UN bodies. The determinations that the court makes will have consequences that go very far and that will have a particular authority, in legal and political terms. Of course, everything turns on what the court actually says.

CB: Would you be able to summarise the key legal arguments that are being fought over in this case?

PS: No! I mean, there’s just a huge number of issues that are coming up. But, essentially, the court has been asked two questions by the UN General Assembly – the first time, I believe, that a request from the General Assembly has been consensual, with no objections. The two questions are, firstly, what are the obligations for states under international law to protect the climate system? And, secondly, what are the legal consequences under these obligations, where, by their acts and emissions, [states] cause significant harm to the climate system? So, there are two distinct questions – and about 100 states and international organisations of various kinds have made submissions on the vast range of issues that are raised by these two questions. The questions are very, very broad and that signals to me that the court’s response may be quite general. But, for me, the crucial issues are, firstly, what the court says about the state of the science: is it established, or is there any room for doubt? Secondly, what are the obligations of states having regard to the clarity of the science? Thirdly, are there legal obligations on states in relation to the climate system that exist and arise outside of the treaty regime – the 1992 [UN Framework] convention [on climate change], the Kyoto Protocol, the Paris Agreement and so on and so forth. And, related to that, fourthly – this is the most intense, legally interesting aspect – what are the responsibilities of states for historic emissions under general international law? And, in particular, are the biggest contributors liable under international law to make good any damages that may arise from their historic actions? But, I mean, there’s just such a vast array of questions that are addressed, it’s impossible to summarise briefly.

… Article continues at https://www.carbonbrief.org/interview-prof-philippe-sands-on-un-courts-landmark-climate-change-hearing/

On climate change, the international court of justice faces a pivotal choice

Continue ReadingInterview: Prof Philippe Sands on UN court’s landmark climate-change hearing

State of the climate: 2024 will be first year above 1.5C of global warming

Spread the love

Original article by Zeke Hausfather republished from Carbon Brief under a CC license.

This year is now virtually certain to beat 2023 as the hottest year on record, Carbon Brief analysis shows.

It will also be the first full year to surpass 1.5C above pre-industrial levels across the majority of observational records.

In this latest “state of the climate” quarterly update, Carbon Brief finds:

  • The year 2024 has seen record warm temperatures for seven of the nine months of the year where data is so far available.
  • The world, as a whole, has warmed approximately 1C since 1970 – and 1.2C to 1.4C since the mid-1800s.
  • A strong El Niño event contributed to exceptionally high global temperatures early in the year, but record or near-record temperatures persisted despite the fading of El Niño in recent months.
  • Record global temperatures have been seen across many regions of the planet over the first nine months of the year.
  • Global temperatures are closely aligned with the projections from climate models.
  • Global sea ice extent is currently at record lows and Antarctic sea ice has spent much of the year at near-record lows – second only to those seen in 2023.

The warmest year on record

In this latest quarterly state of the climate assessment, Carbon Brief has analysed records from five different research groups that report global surface temperature records: NASA’s GISTEMPNOAA’s GlobalTempHadley/UEA’s HadCRUT5Berkeley Earth; and Copernicus/ECMWF

The figure below shows Carbon Brief’s estimate of where 2024 temperatures will end up in each of the groups, based on the year to date and expected El Niño-Southern Oscillation (ENSO) conditions in the tropical Pacific for the remainder of the year. 

The dots reflect the best estimate, while the whiskers show the two sigma (95%) confidence interval of the projections. The prior record year (2023 in all groups) is shown by the coloured square. https://interactive.carbonbrief.org/state-of-the-climate/24-Q3/projections.htmlCarbon Brief’s project of 2024 annual global average surface temperatures for each group, along with 95% confidence intervals and prior record (2023) values. 1.5C above pre-industrial (1850-1900) levels is shown by a dashed line. The average projection represents a composite of all five records following the WMO approach. Chart by Carbon Brief.
In all cases, the projected global average temperature for 2024 is virtually certain to exceed the prior record set in 2023. 

Three of the five groups (Hadley, Berkeley and Copernicus/ECMWF) are very likely to show annual temperatures exceeding 1.5C above pre-industrial levels (defined here as the 1850-1900 period), while the NASA record has a roughly 40% chance of exceeding 1.5C. Only NOAA’s record is unlikely to show global temperatures above 1.5C this year.

These differences in warming since pre-industrial across different datasets primarily result from choice of ocean records used, as well as differences in approaches to filling in gaps between observations in the early part of the records (e.g. pre-1900s). It reflects the uncertainty in the degree of warming since the mid-1800s, with projected 2024 temperatures ranging from 1.44C (NOAA) to 1.61C (Berkeley Earth).

The figure also provides a composite average of the five different datasets, following the approach used in the sixth assessment report (AR6) from the Intergovernmental Panel on Climate Change (IPCC) and by the WMO. Carbon Brief’s analysis finds that 2024 will be the first year above 1.5C in the composite average. 

This provides a way to determine the first year where we can reasonably say that the world has passed that warming level – even though 2023 exceeded 1.5C in the Berkeley Earth dataset and 2024 will not exceed 1.5C in the NOAA dataset.

(It is important to note that exceeding 1.5C in a single year is not equivalent to breaching the Paris Agreement limit. The goal is generally considered to refer to long-term warming – typically over two or three decades – rather than annual temperatures that include the short-term influence of natural fluctuations in the climate, such as El Niño.)

The figure below shows the annual temperatures from each of these groups between 1970 and present, with the year-to-date 2024 temperatures for each record shown as individual points. https://interactive.carbonbrief.org/state-of-the-climate/24-Q3/records_2024_to_date.htmlAnnual global average surface temperatures from NASA GISTEMPNOAA GlobalTempHadley/UEA HadCRUT5Berkeley Earth and Copernicus/ECMWF (lines), along with 2024 temperatures to date (January-September, coloured shapes). Each series is aligned by using a 1981-2010 baseline, with warming since pre-industrial based on the IPCC AR6 estimate of warming between pre-industrial and the 1981-2010 period. Chart by Carbon Brief.
There is strong agreement between the different temperature records, with all of them showing approximately 1C warming between 1970 and present. Global temperatures have been around 1.3 above pre-industrial levels in recent years (with a range of 1.2C to 1.4C across the different temperature datasets, reflecting that the differences between them are larger in the 1800s and early 1900s).

As the chart below shows, 2024 (purple line) started out remarkably warm as a result of a strong El Niño event that built in 2023 (red) and peaked near the beginning of the year. 

However, global temperatures have remained quite elevated despite the fading of El Niño conditions, setting records through June and remaining quite close to 2023’s exceptional highs in recent months. 

Overall, 2024 has set or tied all-time records for seven of the 10 months available to-date in the ERA5 record. (This record uses weather model-based reanalysis to combine lots of different data sources over time.)https://interactive.carbonbrief.org/state-of-the-climate/24-Q3/monthly_global_temperature_anomalies_Q3_2024.htmlTemperatures for each month from 1940 to 2024 from Copernicus/ECMWF ERA5. Anomalies plotted with respect to a 1850-1900 baseline. Chart by Carbon Brief.
While human emissions of CO2 and other greenhouse gases are responsible for effectively all of the Earth’s long-term warming, temperatures in any given year are strongly influenced by short-term variations in the Earth’s climate that are typically associated with El Niño and La Niña events

These fluctuations in temperature between the ocean and atmosphere in the tropical Pacific help make some individual years warmer and some cooler. 

The figure below shows a range of different ENSO forecast models produced by different scientific groups. The values shown are sea surface temperature variations in the tropical Pacific – the El Niño 3.4 region – for three-month periods.

El Niño Southern Oscillation (ENSO) forecast models for overlapping three-month periods in the Niño3.4 region
El Niño Southern Oscillation (ENSO) forecast models for overlapping three-month periods in the Niño3.4 region (July, August, September – JAS – and so on) for the remainder of 2024 and then into the spring and summer of 2025. Credit: CPC/IRI ENSO forecast.

Most models expect neutral conditions in the tropical Pacific, with only a few crossing the -0.5C Niño 3.4 sea surface temperature (SST) anomaly that represents the development of a formal La Niña event. 

This should result in relatively cooler temperatures in 2025, though it is possible that the year ends up warmer than anticipated given the continuation of high temperatures in recent months – despite the absence of El Niño conditions.

Large areas of record warmth

While global average temperatures are an important indicator of changes to the broader climate system over time as a result of human activities, these impacts will differ as some regions experience more rapid warming or extreme heat events than is reflected in the global average.

The figure below shows the parts of the world that saw record warm or cold temperatures over the first three quarters of 2024 (January through to September) in the Berkeley Earth dataset compared to all prior years since global temperature record began in 1850.

Map of year-to-date (January-September) regions that set new records (warmest through to fifth warmest). Note that no regions set cold records for the year-to-date in 2024.
Map of year-to-date (January-September) regions that set new records (warmest through to fifth warmest). Note that no regions set cold records for the year-to-date in 2024. Credit: Berkeley Earth

Notably, no area on Earth saw record cold (or even the second, third, fourth or fifth coldest temperatures on record). Nearly all of Central America and large parts of South America saw their warmest year to date on record, as did much of eastern Europe, Africa, China, south-east Asia, and Korea. 

The figure below shows the temperature anomaly over the first nine months of the year compared to the 1951-80 baseline period used by Berkeley Earth. Warming was particularly pronounced over land regions, with many areas already showing warming of 1.5C or 2C above that baseline.

Map of year-to-date (January-September) global surface temperatures. Anomalies are shown relative to the 1951-80 period following the convention used by Berkeley Earth.
Map of year-to-date (January-September) global surface temperatures. Anomalies are shown relative to the 1951-80 period following the convention used by Berkeley Earth. Credit: Berkeley Earth

Temperatures are tracking climate model projections

Climate models provide physics-based estimates of future warming given different assumptions about future emissions, greenhouse gas concentrations and other climate-influencing factors

The figure below shows the range of individual models forecasts featured in AR6 – known collectively as the CMIP6 models – between 1970 and 2030, with grey shading and the average projection across all the models shown in black. Individual observational temperature records are represented by coloured lines.https://interactive.carbonbrief.org/state-of-the-climate/24-Q3/model_obs_comps_Q3_2024.htmlTwelve-month average global average surface temperatures from CMIP6 models and observations between 1970 and 2024. Models use SSP2-4.5 forcings after 2015.Anomalies plotted with respect to a 1981-2010 baseline. Chart by Carbon Brief.
While global temperatures were running below the pace of warming projected by climate models for much of the period between 2008 and 2022, the past two years have been closer to the model average

However, the CMIP6 models may be biassed a bit too warm, with a subset of “hot” models pushing up the average. The IPCC used an approach that weighted models based on how well they reproduced historical temperatures, rather than simply averaging all the models together.

Excluding these hotter models from the analysis results in observations over recent years much closer to the multi-model average and near the centre of the uncertainty range across all models. It also reveals that the past two years – 2023 and 2024 – have been near the upper end of the model range.https://interactive.carbonbrief.org/state-of-the-climate/24-Q3/model%20_obs_comps_filtered_Q3_2024.htmlTwelve-month average global average surface temperatures from CMIP5 models and observations between 1970 and 2024. Models use SSP2-4.5 forcings after 2015. Anomalies plotted with respect to a 1981-2010 baseline. Chart by Carbon Brief.
Record low global sea ice extent

Highly accurate observations of Arctic and Antarctic sea ice have been available since polar-observing satellites became available in the late 1970s. 

Arctic sea ice extent during the first three-quarters of 2024 has been below or at the low end of the historical 1979-2010 range, but has not seen any record daily lows. 

Antarctic sea ice, on the other hand, set new all-time low records for a few days in July and September, and has generally been the second lowest on record (after 2023) from June onwards.

The figure below shows both Arctic (red) and Antarctic (blue) sea ice extent in 2024, the historical range in the record between 1979 and 2010 (shaded areas) and the record lows (dotted black line).

Unlike global temperature records (which only report monthly averages), sea ice data is collected and updated on a daily basis, allowing sea ice extent to be viewed through to the present day.https://interactive.carbonbrief.org/state-of-the-climate/24-Q3/sea_ice.htmlArctic and Antarctic daily sea ice extent from the US National Snow and Ice Data Center. The bold lines show daily 2024 values, the shaded area indicates the two standard deviation range in historical values between 1979 and 2010. The dotted black lines show the record lows for each pole. Chart by Carbon Brief.

Global sea ice extent is estimated by combining both Arctic and Antarctic sea ice extent. The figure below shows global sea ice extent in each year, with 2024 shown in red. Currently global sea ice extent is at record-low levels, below the prior record for this date set in 2023.

Global sea ice extent

Methodological note

statistical multivariate regression model was used to estimate the range of likely 2024 annual temperatures for each group that provides a temperature record. This model used the average temperature over the first six months of the year, the average ENSO 3.4 region value during the first nine months of the year and the average predicted ENSO 3.4 value during the last three months of the year to estimate the annual temperatures. 

The model was trained on the relationship between these variables and annual temperatures over the period of 1950-2023. The model then uses this fit to predict both the most likely 2024 annual value for each group, as well as the 95% confidence interval. The predicted ENSO 3.4 region values for the last three months of 2024 are taken from the IRI plume forecast.

The percent likelihood of different year ranks for 2024 is estimated by using the output of the regression model, assuming a normal distribution of results. This allows Carbon Brief to estimate what percent of possible 2024 annual values fall above and below the temperatures of prior years for each group, as well as the likelihood of the year exceeding 1.5C in each record.

Original article by Zeke Hausfather republished from Carbon Brief under a CC license.

Continue ReadingState of the climate: 2024 will be first year above 1.5C of global warming

Guest post: What 1.5C overshoot would mean for climate impacts and adaptation

Spread the love

Original article by multiple authors republished from Carbon Brief under a CC license

With average global temperatures set to see another record high this year, the chances of holding warming to no more than 1.5C continue to dwindle.

Keeping warming below 1.5C by the end of the century – in line with the long-term goal of the Paris Agreement – now likely involves “overshooting” 1.5C and then bringing temperatures back down later by removing carbon dioxide (CO2) from the atmosphere. 

(What this means for “net-negative” emissions is covered in a previous guest post.)

This raises a number of unknowns in terms of what overshoot means for the impacts of climate change on the planet, people and ecosystems. 

For example, even if global temperatures can be brought back down again by the end of the century, will the impacts of climate change also reduce? Will coral reefs be able to recover or will glaciers reform? What will it mean for the world’s coastlines, food production and endangered species?

For the past three years, we have been working on a Horizon Europe-funded project called PROVIDE to dive deeper into what overshoot really looks like for countries, regions and cities. 

This data is available on the Climate Risk Dashboard – a tool to help people see how climate change will affect them and how it depends on the actions taken today.

Until carbon emissions are reduced to net-zero, the world will not stop warming. Delay will result in ever more intense climate impacts – and increase the risk of crossing irreversible thresholds. 

Urban heat stress under overshoot

One of the clearest and most acute impacts of climate change is on extreme heatwaves. Our findings suggest that, were global average temperatures to decline, extreme heat events in most locations will also decrease, on average. 

But achieving a new balance in local climates would be a slow process, influenced by ongoing climate system adjustments for decades – if not centuries – to come.

Reversing climate change would most probably take several decades, even if overshoot is limited to a few tenths of a degree. This implies that the climate risks that generations alive today will be exposed to are largely determined by collective actions today. 

We can illustrate these differences for the risks of extreme heat stress for the Indian city of Chennai, one of 140 cities for which we modelled urban heat stress risks at 100-metre spatial resolution.  

The chart below shows the projected annual number of days of extreme heat stress in Chennai – defined as days where wet-bulb globe temperature (WBGT) goes over 31C. (WBGT is a metric that combines air temperature, humidity and exposure to direct sunlight.)

This level of heat stress approaches the limits of human survivability (without adaptation) – for example, physical outdoor labour is almost impossible under these conditions.

Under current 2020 climate policies, leading to a best estimate of about 3C of warming in 2100, extreme heat days increase pretty much unchecked. By the end of the century, around half of the days (180) per year would experience extreme heat stress conditions (or even higher). 

In contrast, in a 1.5C low-overshoot scenario (the IPCC Shifting Pathway), the number of extreme heat stress days would peak mid-century at around 120 days , before declining again to around 110 days by 2100 as global average temperature decreases from just above 1.5C to around 1.3C. This is a modest decline in extreme heat risk, yet a profound difference from a 3C world. 

Projected days a year with extreme heat stress in Chennai from 2020 to 2100
Projected days a year with extreme heat stress in Chennai from 2020 to 2100 under the climate policies of 2020 (blue) and 1.5C low-overshoot scenario called “IPCC Shifting Pathway” (green). Source: PROVIDE Dashboard

Irreversible consequences from overshoot

There are many other impacts of climate change that will be irreversible – for centuries to millennia – at peak temperatures, let alone if society is able to bring warming back down.

Coral reef lossglacier losssea level rise and the loss of many species and ecosystems all fall into this category.

Yet, a lot of these losses can still be avoided by stringent mitigation. For example, our multi-scenario framework allows us to explore glacier futures showing unavoidable, or “locked-in”, risks even under the lowest emission scenario we have explored, and compare them with the avoidable risks through stringent mitigation. 

Below, we provide an example for glacier volume projections for Peru, where glaciers serve as an essential freshwater resource during the extremely dry season of June to September. Due to past warming, glacier loss will continue over the coming decades. Under a current policy scenario (blue dots), 50% of the glacier volume might be lost as early as 2050.

Yet this does not need to happen. In fact, stringent mitigation pathways (green dots) are still possible that give a four-in-five chance of preserving 50% of today’s glacier ice in Peru, avoiding the worst and helping to maintain some of their vital uses.

Chart illustrating risks of losing 50% of 2020 glacier volume for Peru today and in 2030, 2050 and 2100
Chart illustrating risks of losing 50% of 2020 glacier volume for Peru today and in 2030, 2050 and 2100, under the climate policies of 2020 (blue) and 1.5C low-overshoot scenario called “IPCC Shifting Pathway” (green). Shading highlights the avoidable risk. Source: PROVIDE Dashboard.

Overshoot risks for the biosphere

Climate change represents a major threat to biodiversity globally. We modelled species at risk from local extinction for about 135,000 terrestrial fungi, plants, invertebrates and vertebrates based on the Wallace Initiative

Under the assumption that the 1950-2000 reference climate was suitable for the species at question, we model the proportion of species for which the local climate becomes unsuitable under ongoing climate change. 

In the chart below, we illustrate the risks to species in one of the countries with the world’s richest terrestrial biodiversity, Brazil. Under the current policy scenario (blue dots), the likelihood of 50% of species being at risk of local extinction rises to 74% by 2100. Yet, our analysis shows that this likelihood can still be avoided almost entirely by stringent mitigation (green dots). 

Chart showing the likelihood of 50% of Brazilian species being at risk of local extinction today and in 2030, 2050 and 2100
Chart showing the likelihood of 50% of Brazilian species being at risk of local extinction today and in 2030, 2050 and 2100, under the climate policies of 2020 (blue) and 1.5C low-overshoot scenario called “IPCC Shifting Pathway” (green). Shading highlights the avoidable risk. Source: PROVIDE Dashboard.

It is important to highlight that species loss does depend on a range of factors – of which climate suitability is only one. Yet there is a range of other human-caused stressors to biodiversity loss and a complex interdependencies of species and food webs in particular in the most biodiverse ecosystems implies the risk of knock-on effects and ecosystem tipping points

We also note that our results do not necessarily imply global species extinction and do not allow us to quantify if and how species survival under different overshoot trajectories would emerge. 

Overshoot will stress adaptation planning

Overshoot outcomes matter for climate risk assessments. Yet, in contrast with the prominence of overshoot pathways in the climate mitigation literature, their implications for adaptation planning have not been widely explored.

Overshoot would increase the threat of climate change that society needs to adapt to – and make that adaptation more difficult. Some options may become unavailable due to limits of adaptation

Also, timescales matter. Reversing an overshoot will take decades. Even assuming reversibility of climate hazards in the future as temperatures come down, this might only matter for adaptation decisions that involve a planning horizon of 50 years or more.

This is illustrated in the chart below, from our recent Nature study. This shows a stylised trajectory of warming (top chart) with overshoot (red bars) and how it compares to planning horizons for some example adaptation options (green bars), the lifetime of those measures (blue bars) and the intergenerational equity they involve (bottom chart).

The possibility of reversing long-term impacts in the future does not reduce the urgent need to act now on closing the wide gap in current adaptation efforts.

Figure showing stylised temporal evolution of a reversible climate impact driver
Figure showing: a) stylised temporal evolution of a reversible climate impact driver under a peak and decline scenario. Dashed lines indicate a low and high overshoot outcome with median timescales of global temperature reversibility typically in line with those from the IPCC AR6 database; and b) stylised illustration of adaptation-relevant timescales starting in 2030, including different planning horizons for adaptation planning (green bars) and lifetimes of individual adaptation measures (blue), and the effect of applying discounting (reflecting societal preferences towards intergenerational equity) to future damages and adaptation benefits. Source: Schleussner et al. (2024)

Limit peak warming and aim for long-term decline

While our results clearly underscore the importance of limiting peak warming to as low as possible, there are also very good arguments for aiming for a long-term global temperature decline, irrespective of the peak warming level. 

For a wide range of time-lagged climate impacts, such as ice sheet, peatland and permafrost loss, as well as large-scale irreversible tipping points, achieving temperature decline well below 1.5C is key to limiting long-term risks from global warming. 

Overshoot is clearly not an alternative way to achieve a similar climate outcome. Effectively limiting climate risks requires restricting peak warming as low and as close to 1.5C as possible – and then aim for long-term decline to reduce the climate impact legacy of human-caused emissions.

This guest post is by:

Dr Carl-Friedrich Schleussner leads the integrated climate impact group at the International Institute for Applied Systems Analysis (IIASA) and is a scientific advisor at Climate Analytics, Berlin.

Prof Rachel Warren, professor of global change and environmental biology at the University of East Anglia.

Dr Fabien Maussion, associate professor in glaciology at the School of Geographical Sciences, University of Bristol, UK.

Dr Niels Souverijns, urban climatologist at VITO Belgium and guest professor at KU Leuven.

Dr Quentin Lejeune, a climate scientist who has led the development of the PROVIDE Climate Risk Dashboard at Climate Analytics.

Original article by multiple authors republished from Carbon Brief under a CC license

Continue ReadingGuest post: What 1.5C overshoot would mean for climate impacts and adaptation