Analysis: Clean energy just put China’s CO2 emissions into reverse for first time

Spread the love

Original article by Lauri Myllyvirta republished from Carbon Brief under a CC license

Workers install solar photovoltaic panels in Yinchuan, China. Credit: Cynthia Lee / Alamy Stock Photo

For the first time, the growth in China’s clean power generation has caused the nation’s carbon dioxide (CO2) emissions to fall despite rapid power demand growth.

The new analysis for Carbon Brief shows that China’s emissions were down 1.6% year-on-year in the first quarter of 2025 and by 1% in the latest 12 months.

Electricity supply from new wind, solar and nuclear capacity was enough to cut coal-power output even as demand surged, whereas previous falls were due to weak growth.

The analysis, based on official figures and commercial data, shows that China’s CO2 emissions have now been stable, or falling, for more than a year.

However, they remain only 1% below the latest peak, implying that any short-term jump could cause China’s CO2 emissions to rise to a new record.

Other key findings include:

  • Growth in clean power generation has now overtaken the current and long-term average growth in electricity demand, pushing down fossil fuel use.
  • Power-sector emissions fell 2% year-on-year in the 12 months to March 2025.
  • If this pattern is sustained, then it would herald a peak and sustained decline in China’s power-sector emissions.
  • The trade “war” initiated by US president Donald Trump has prompted renewed efforts to shift China’s economy towards domestic consumption, rather than exports.
  • A new pricing policy for renewables has caused a rush to install before it takes effect.
  • There is a growing gap that would need to be bridged if China is to meet the 2030 emissions targets it pledged under the Paris Agreement.

If sustained, the drop in power-sector CO2 as a result of clean-energy growth could presage the sort of structural decline in emissions anticipated in previous analysis for Carbon Brief.

The trend of falling power-sector emissions is likely to continue in 2025.

However, the outlook beyond that depends strongly on the clean energy and emissions targets set in China’s next five-year plan, due to be published next year, as well as the economic policy response to the Trump administration’s hostile trade policy.

China’s emissions decline due to clean power

Over the past decade, China’s CO2 emissions from fossil fuels and cement have risen by nearly a fifth, but there have been ups and downs along the way.

The shallow decline in 2015 and 2016 was due to a slump that followed a round of stimulus measures, while zero-Covid controls caused a sharper fall in 2022. Overall, however, emissions have continued to increase, pausing only during periods of economic stress.

More recently, there have been signs that China’s CO2 emissions could be close to reaching a peak and plateau, or even a period of structural decline.

The latest data, for the first quarter of 2025, shows that China’s CO2 emissions have now been stable or falling for more than a year, as shown in the figure below.

However, with emissions remaining just 1% below the recent peak, it remains possible that they could jump once again to a new record high.
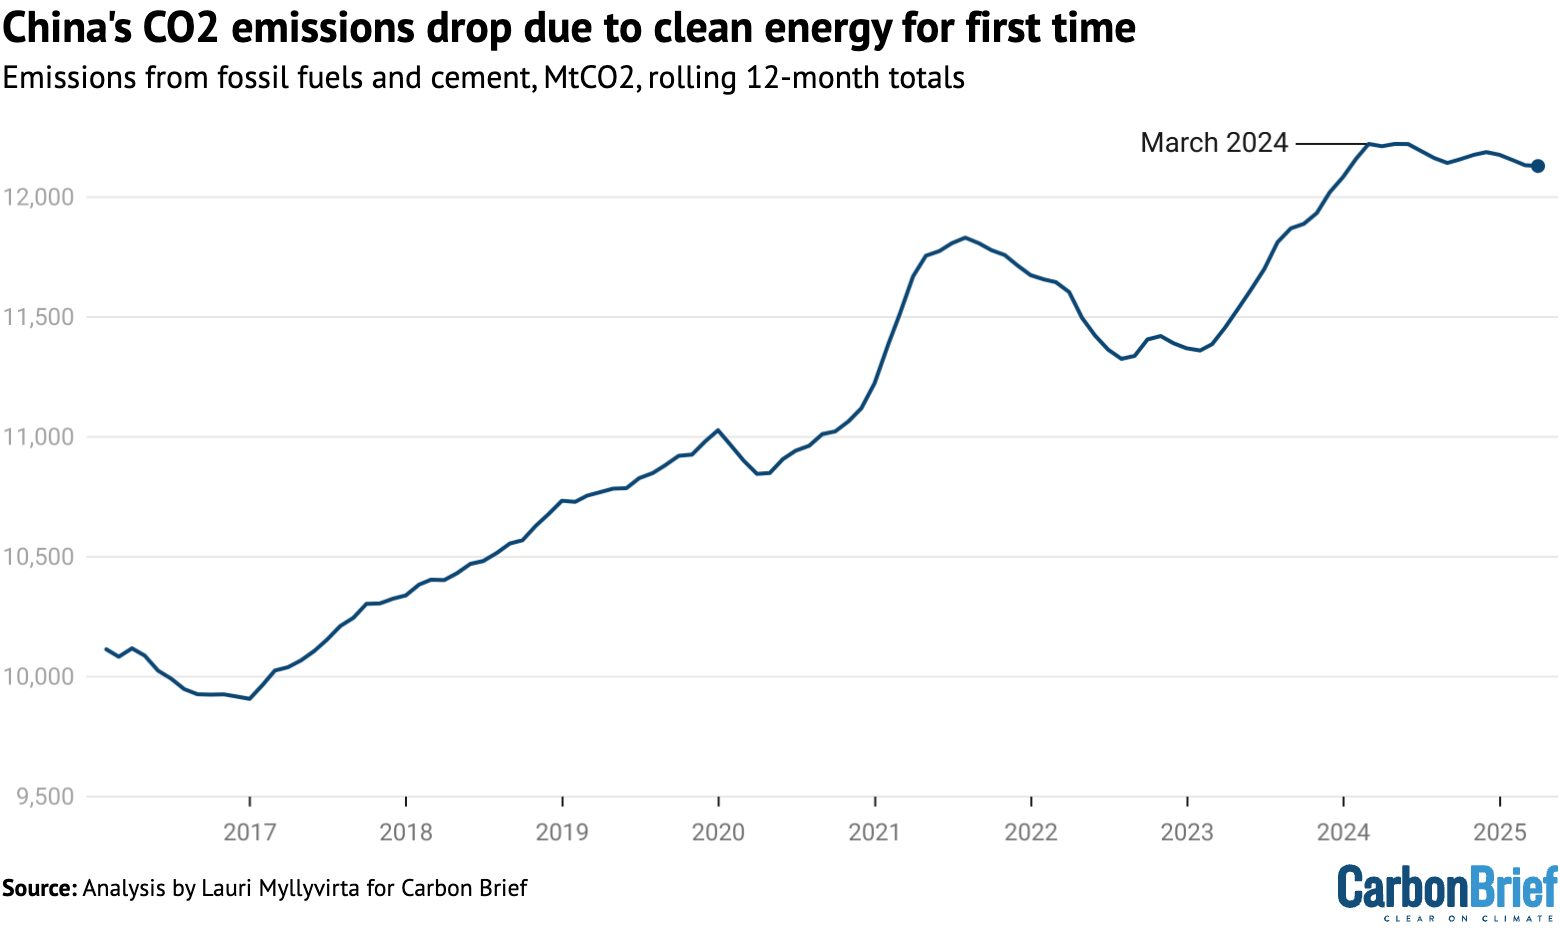
China's CO2 emissions drop due to clean energy for first time
China’s emissions from fossil fuels and cement, million tonnes of CO2, rolling 12-month totals. Source: Emissions are estimated from National Bureau of Statistics data on production of different fuels and cement, China Customs data on imports and exports and WIND Information data on changes in inventories, applying emissions factors from China’s latest national greenhouse gas emissions inventory and annual emissions factors per tonne of cement production until 2024. Sector breakdown of coal consumption is estimated using coal consumption data from WIND Information and electricity data from the National Energy Administration.

Therefore, the future path of China’s CO2 emissions hangs in the balance, depending on trends within each sector of its economy, as well as China’s response to Trump’s tariffs.

These sectoral trends are explored further in the sections below, along with signals on what could be coming next from Chinese policymakers as they consider the country’s international climate pledge for 2035 and the five-year plan for 2026-2030.

Power-sector emissions fall while other sectors rebound

The reduction in China’s first-quarter CO2 emissions in 2025 was due to a 5.8% drop in the power sector. While power demand grew by 2.5% overall, there was a 4.7% drop in thermal power generation – mainly coal and gas.

Increases in solar, wind and nuclear power generation, driven by investments in new generating capacity, more than covered the growth in demand. The increase in hydropower, which is more related to seasonal variation, helped push down fossil power generation.

Power-sector emissions fell by more than total generation from fossil fuels, as the share of biomass and gas increased, while average coal power plant efficiency improved.

Specifically, the average amount of coal needed to generate each unit of electricity at coal-fired power plants fell by 0.9% year-on-year.

The first-quarter reduction in CO2 emissions from coal use in the power sector is shown at the bottom of the figure below, below CO2 changes in other sectors.

Chart: Falling CO2 due to clean power outweighed rises elsewhere
Year-on-year change in China’s CO2 emissions from fossil fuels and cement, for the period January-March 2025, million tonnes of CO2. Source: Emissions are estimated from National Bureau of Statistics data on production of different fuels and cement, China Customs data on imports and exports and WIND Information data on changes in inventories, applying emissions factors from China’s latest national greenhouse gasemissions inventory and annual emissions factors per tonne of cement production until 2024. Sector breakdown of coal consumption is estimated using coal consumption data from WIND Information and electricity data from the National Energy Administration.

Outside of the power sector, emissions increased 3.5%, with the largest rises in the use of coal in the metals and chemicals industries.

The coal-to-chemicals industry is undergoing rapid expansion, driven by concerns about dependence on imported oil and gas. During the first quarter of 2025, it was also benefiting from more favourable economics due to lower coal prices and relatively high oil prices.

Crude steel production increased 0.6% year-on-year, metal products output by 6% and non-ferrous metals production by 2%. All of these increases were mainly due to a jump in March. Metals demand was boosted by the bump in exports ahead of the tariffs, but high output has continued well into April.

Real-estate construction “starts” fell by 24% and sales of new properties by 3%, indicating that the demand for cement, steel and glass from the construction sector continues to decline.

In contrast, economic output in vehicle and machinery production increased by 12% and 13%, respectively, signalling increased demand for metals.

Cement production fell by 1.4%, a slower rate of decrease than in previous years, likely due to an earlier start to weather-dependent construction activity thanks to warm weather.

Gas consumption increased by an estimated 6% in the power sector, due to a 14% increase in gas-fired power generation capacity, even as the average utilisation of the plants fell. However, gas consumption fell in other sectors, outweighing the increase for power.

Oil products consumption increased slightly, as shown by the bar at the top in the figure above. Warmer weather meant that weather-dependent construction and agricultural activity rose earlier in the year than usual.

However, structural factors, particularly vehicle electrification and the shift to liquified natural gas (LNG) in the freight sector, point to continued declines in oil demand.

Have China’s emissions peaked?

Following the 1.6% decline in the first quarter of 2025, China’s emissions have now been stable or falling for more than a year, starting from the beginning of March 2024.

However, emissions in the 12 months to the end of March 2025 were down only 1% from their recent peak, implying that any short-term jump could lead to a new record high.

After the sharp reduction in the first quarter, emissions from power generation are now down year-on-year for the most recent 12 months.

This has happened four times before over the past four decades – in 2009, 2012, 2015 and 2022. However, the current drop is the first time that the main driver is growth in clean power generation.

The falls in 2009 and 2012 were related to the global financial crisis and the Euro area crisis, while the drop in 2015 was driven by the construction and industrial sector slump that followed the 2008-12 stimulus program.

These economic shocks resulted in the sharp reduction in electricity demand shown in the figure below. The drop in 2022 was a combination of slow power demand growth due to strict “zero-Covid” measures and relatively strong clean-power additions.
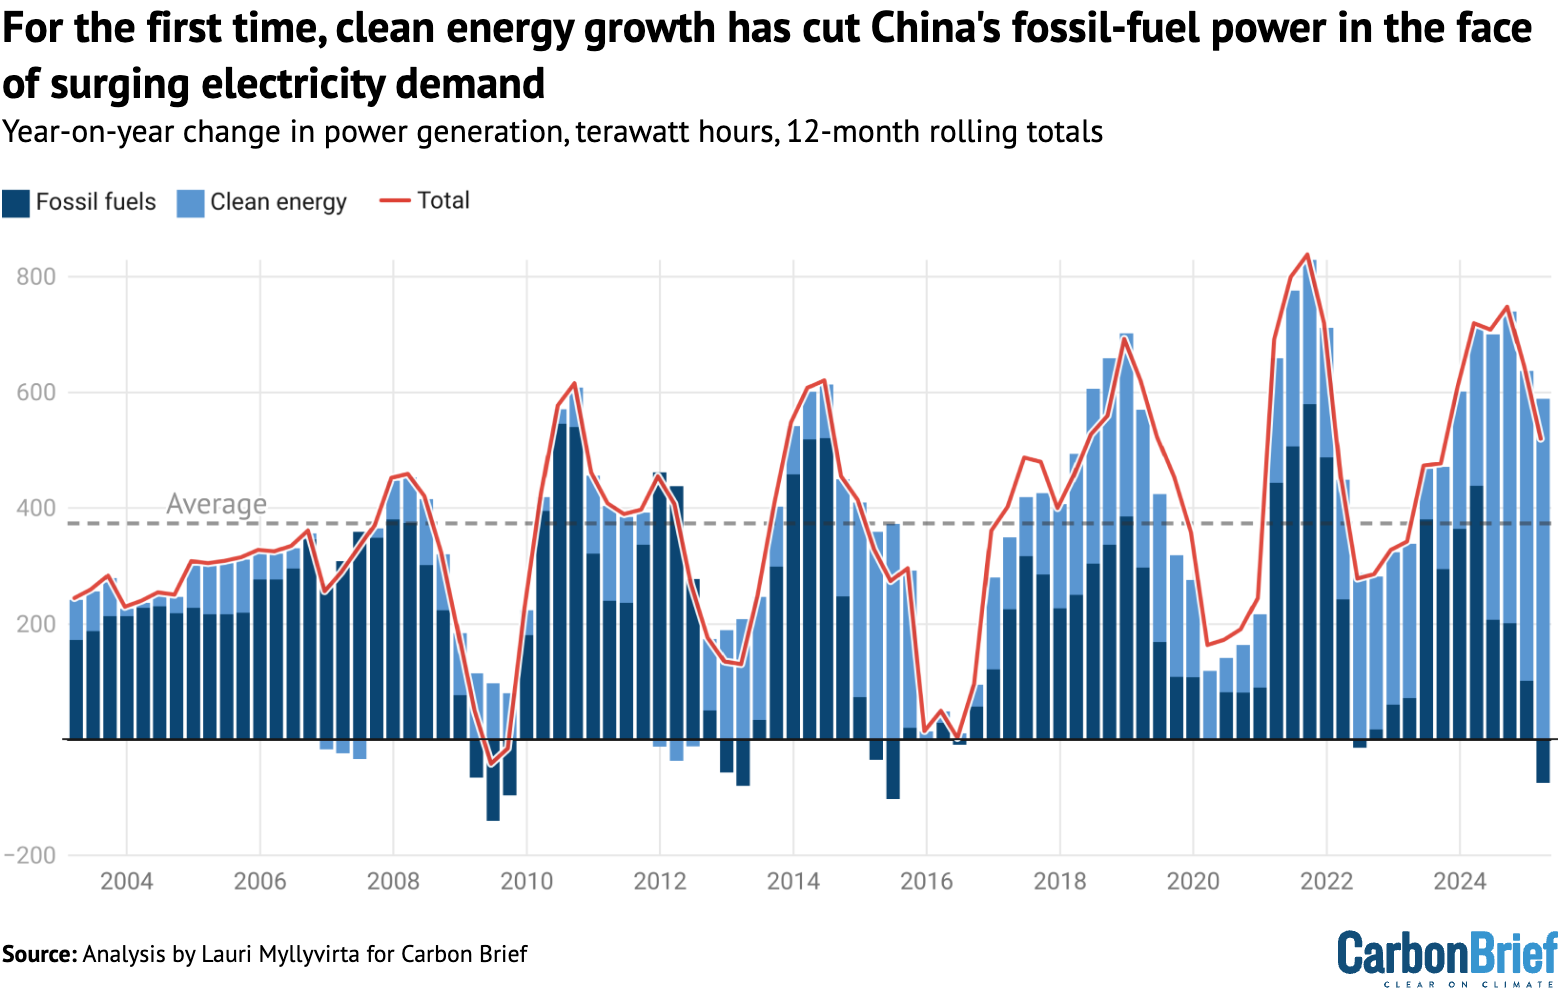
Chart: For the first time, clean energy growth has cut China's fossil-fuel power in the face of surging electricity demand
Year-on-year change in electricity generation from fossil fuels and clean energy, terawatt hours, rolling 12-month totals. The total annual change in demand is shown by the solid line and the average annual increase is shown by the dotted line. Sources: China Electricity Council; Ember; analysis for Carbon Brief by Lauri Myllyvirta.

Importantly, the growth in clean power generation in the first quarter of 2025 was not only larger than the rise in demand overall, it was also higher than the average increase in demand over the past 15 years, marked by the dashed line in the figure above.

Moreover, hydropower has been stable year-on-year in the past six months, implying that the clean-energy growth has been driven by increases in solar, wind and nuclear power capacity, not year-to-year variation in hydropower output.

Looking beyond electricity generation, all sectors registered a fall in emissions over the most recent four months from December 2024 to March 2025, except for coal-to-chemicals.

In order for China’s emissions overall to peak and then start declining, CO2 cuts in declining sectors will need to outweigh continued growth elsewhere.

For example, process emissions from cement production peaked in 2021 and have declined by 27% since then, as shown in the top left chart in the figure below.
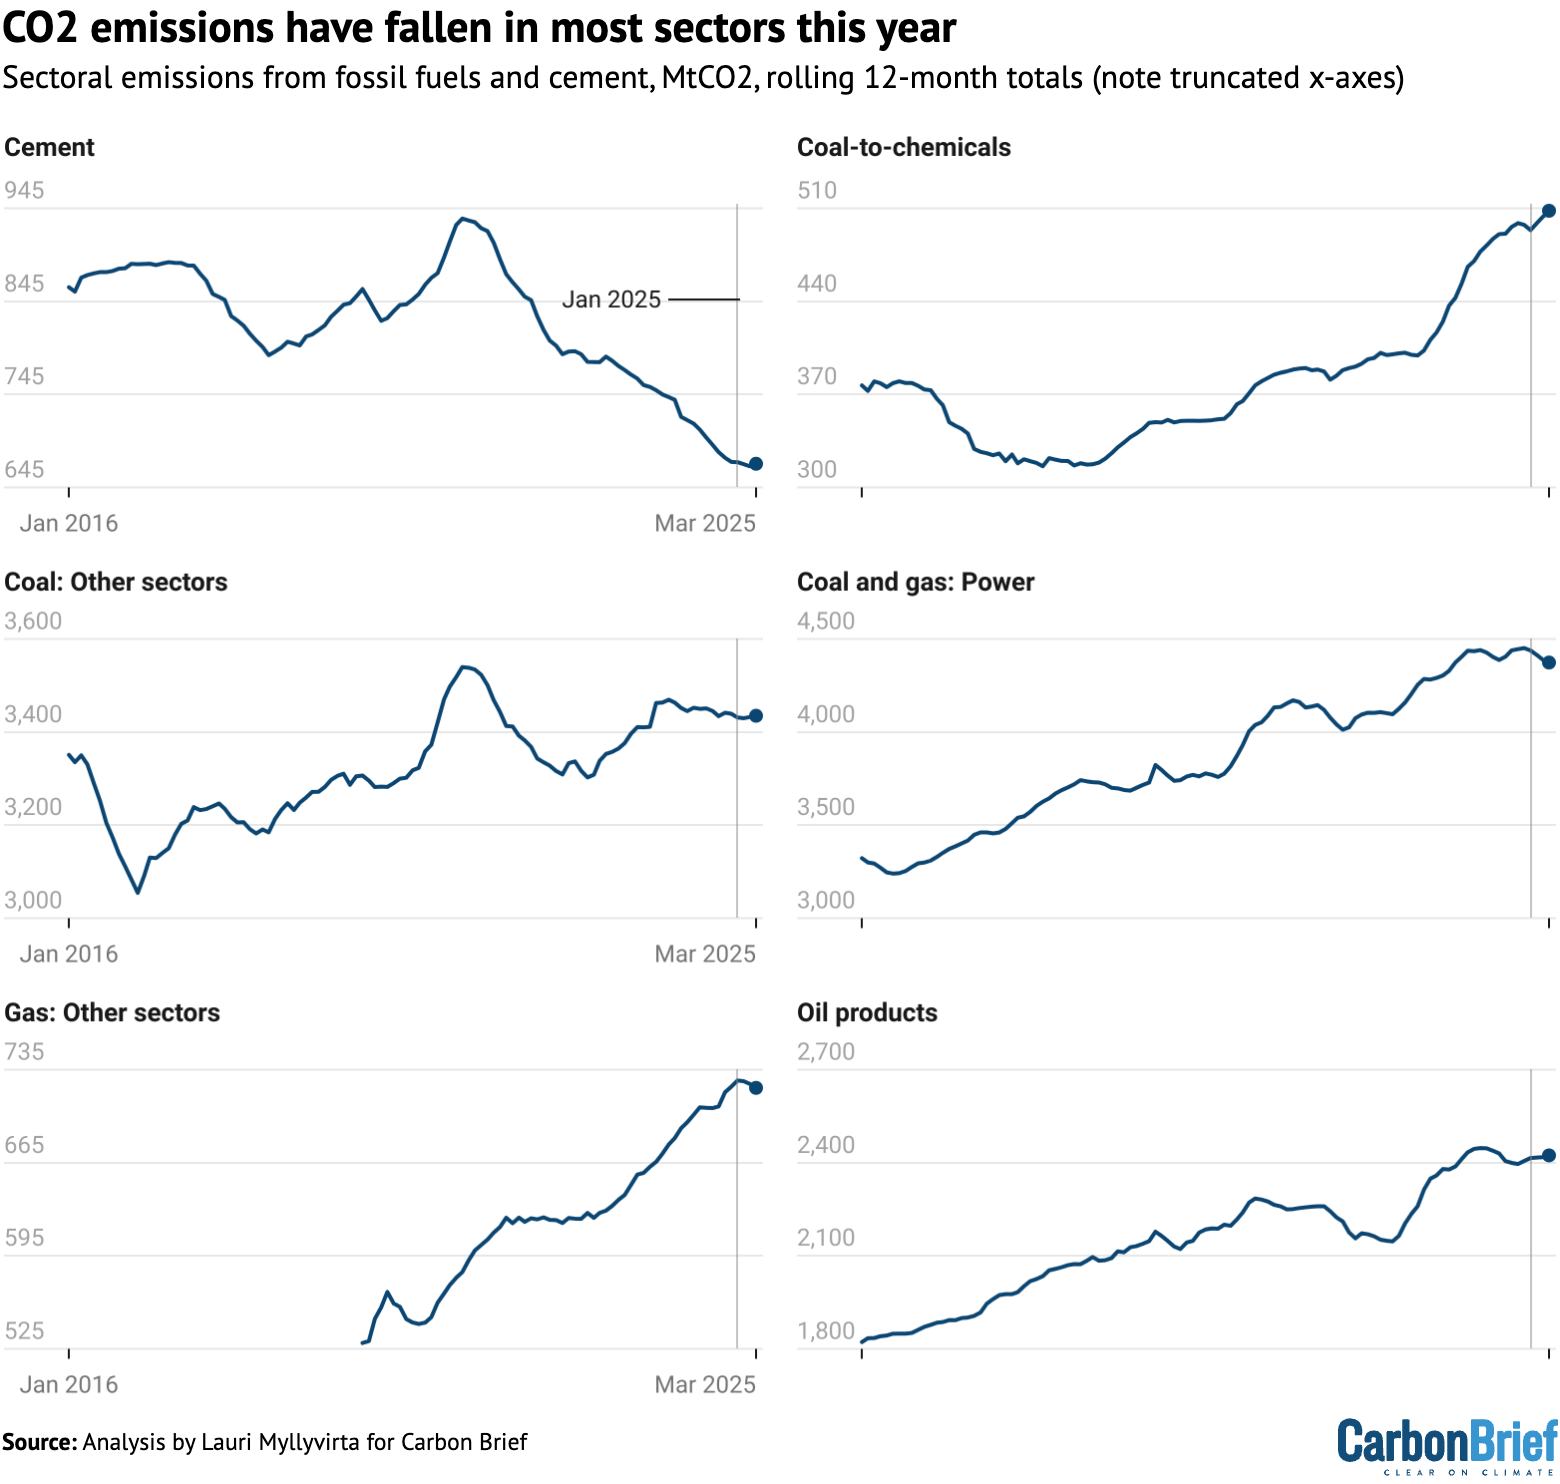
Six line charts of China's sectoral emissions: CO2 emissions have fallen in most sectors this year
Sectoral emissions from fossil fuels and cement, million tonnes of CO2, rolling 12-month totals. Source: Emissions are estimated from National Bureau of Statistics data on production of different fuels and cement, China Customs data on imports and exports and WIND Information data on changes in inventories, applying emissions factors from China’s latest national greenhouse gas emissions inventory and annual emissions factors per tonne of cement production until 2024. Sector breakdown of coal consumption is estimated using coal consumption data from WIND Information and electricity data from the National Energy Administration.

Coal use outside the power and chemicals sectors peaked at the same time as cement, but has been rebounding since then and is now close to previous peak levels.

The China Coal Association expects coal use in the steel and building materials industries to fall, while coal consumption in the chemical industry is projected to continue growing.

Hopes of future growth in demand for coal are pinned on the chemical sector, described as a shift from using coal primarily as a fuel to a role as both a fuel and a raw material.

The association also believes that coal-fired power generation will resume growth – at least in the short term – but it recently revised down its projections for 2025 compared with the outlook at the end of 2024.

The tariff “war” may have affected expectations. One analysis suggests a 0.5 to 1 percentage point reduction in China’s GDP growth rate due to the tariffs could result in a similar reduction in demand for thermal coal – mainly used at power stations.

Oil product consumption has been declining since the post-Covid rebound ended in March 2024, falling 2% from its peak. The long-term trend is expected to be downwards, due to the electrification of transportation, despite rising demand for chemicals and aviation.

Gas use has been falling for a few months, but the trend is likely still increasing.

The table below lists the 12-month periods with the highest emissions for each sector, as well as the reduction since the latest peak in each case.

SectorDate of highest emissionsReduction since peak
CementApril 2021-28.2%
Coal and gas: PowerNovember 2024-1.7%
Coal-to-chemicalsMarch 2025Still increasing
Coal: Other sectorsApril 2021-3.0%
Gas: Other sectorsDecember 2024-0.8%
Oil productsApril 2024-1.0%
Total CO2February 2024-0.8%

For all of the sectors other than cement production, it is too early to declare a definitive peak in emissions. Still, there are signs that other sectoral peaks could be past their peak, too.

Indeed, for oil products consumption and steel production, industry projections indicate that the future trend is likely to be falling.

For the power sector, clean-energy additions at or above current levels would likely lead to a structural peak, as clean-energy growth would more than cover electricity demand growth.

Together, these sectors cover more than 80% of China’s total emissions. If all of them enter a structural decline, then total emissions are very likely to do so too.

China pushes domestic demand in response to US tariffs

The economic and emissions outlook for this year and beyond will be affected by the Trump administration’s unprecedented trade tariffs – and China’s counter-measures.

The initial impact was a drop in emissions due to lower factory output in export-oriented coastal provinces and possible knock-on impacts on investment and consumer spending.

Conversely, the temporary easing of tariffs for 90 days will lead to a rush of orders from the US to make up for the short-lived slowdown in trade and to stockpile goods before the relief ends.

China’s reactions to the tariffs focused on counteracting the economic impacts with stimulus.

An anonymous comment piece in People’s Daily, the main Communist party affiliated newspaper, says the country should “strive to make consumption the main driving force and ballast stone of economic growth”, leveraging China’s large domestic market.

(The piece has the byline “People’s Daily commentator”, which implies that it is written by someone with authority.)

The article says that this will involve increasing consumer income, while easing financial and social burdens to boost purchasing power and willingness to consume.

While the temporary easing of tariffs will reduce the urgency of these measures, the US tariff rate on China, at 40%, remains much higher than it was before Trump’s presidency – and China’s leaders will likely want to prepare against the risk of renewed tariff hikes.

The focus will be creating domestic markets for the products China exports to the US. The long-held aim of rebalancing China’s economy towards consumption could finally become reality as a result. A successful rebalancing could mean less energy-intensive growth.

China’s response also includes redoubling its focus on “new quality productive forces”, a concept that emphasises new technology.

The concept includes the clean-energy industry, which has become such an important economic driver in China that it would be hard to leave out of stimulus plans.

A new list of low-carbon demonstration projects, published by the National Development and Reform Commission, provides a look at China’s priorities for clean-energy investment. Green hydrogen, energy storage, “virtual power plants” and industrial decarbonisation based on hydrogen are new growth areas.

In terms of the emissions implications of China’s response to Trump’s tariffs, the big question is whether stimulus focused at these favoured sectors – including the new low-carbon focus areas and other clean-energy industries – is deemed sufficient.

Some traditional recipients of stimulus spending, such as shipbuilding and public infrastructure, have already posted strong growth in the first quarter of this year as a result of stimulus measures announced in 2024.

New wind and solar pricing policy increases uncertainty

An additional source of uncertainty for China’s emissions comes in the form of its new electricity pricing policy for renewable energy, which enters into force in June.

The new policy removes price guarantees pegged to coal-power prices, with new wind and solar projects supposed to secure direct contracts with electricity buyers. This is likely to lead to lower prices being paid to new wind and solar projects.

However, it offers more favourable pricing – via “contracts for difference” – to the amount of new capacity needed to meet central government energy targets.

The immediate effect of the policy will likely be a rush of projects rushing to complete installation before the June deadline, so as to secure guaranteed prices.

This rush was already apparent in the latest data: 23 gigawatts (GW) of solar and 13GW of wind was added in March alone, up 80% and 110% from previous records for the month.

Furthermore, this year’s installations are likely to be very strong, even topping last year’s record, as a lot of centralised solar power and wind-power projects are racing to complete before the end of the 14th five-year plan period. 

The China Wind Energy Association expects a new record of 105-115GW installed this year across onshore and offshore wind projects – up from the record-breaking 80GW last year – based on very active bidding last year. It also expects volumes to stay at that level even in 2026 and to then grow further towards 2030. 

The China Electricity Council predicts an even larger wind-power capacity addition of 120GW in 2025. Another analyst projects a 20% drop in wind-power capacity additions in 2026, but after an even steeper increase in 2025 to 120-130GW of capacity added. So he also expects 2026 installations to be far above the current record year of 2024.

For solar, the China Photovoltaic Industry Association forecasts a drop in installations of 8-23% this year, from the staggering record of 278GW last year. Even the low end of this projection would see installations stay at 2023 levels in 2025 and then recover from there.  The China Electricity Council’s projection for solar additions in 2025 matches the low end of the industry association’s forecast.

The figure below, based on these various projections, shows that additional electricity generation from new clean power capacity is expected to remain above last year’s record-breaking levels in both 2025 and 2026.
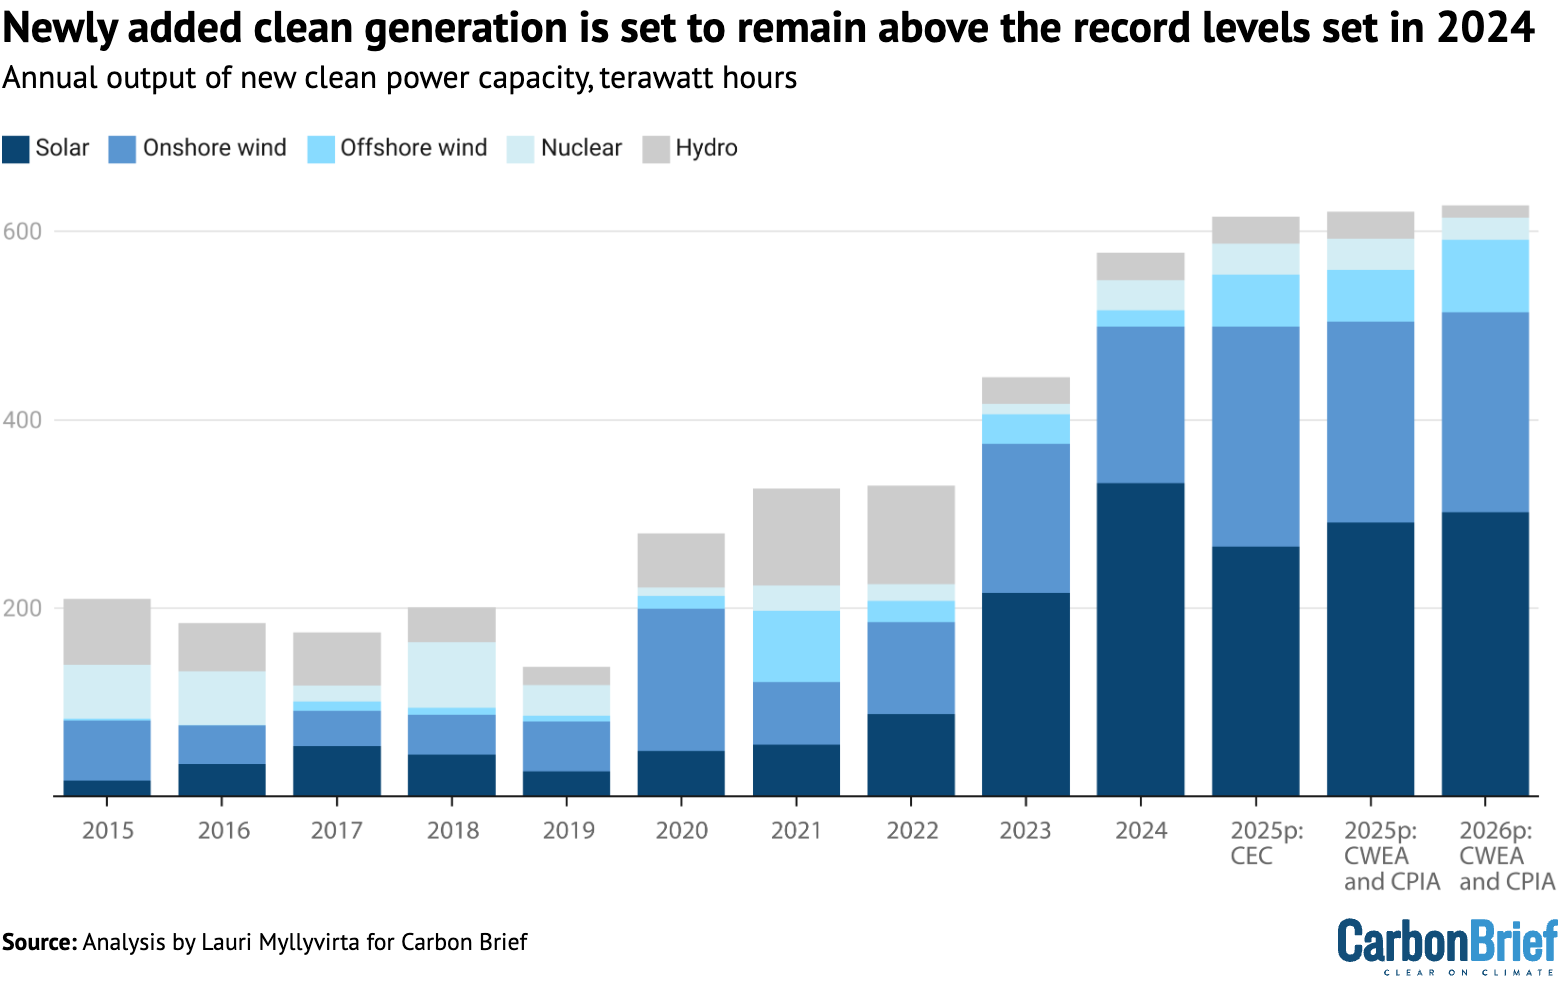
Bar chart: Newly added clean generation is set to remain above the record levels set in 2024
Annual electricity generation from clean power capacity newly added each year, terawatt hours by source. Two alternative projections for 2025 are taken from a range of different organisations, while the 2026 projection is a combined total from the wind and solar industry associations. Power generation from new capacity is projected using average capacity factors for each technology over 2015–2024. Sources: Historical data from China Electricity Council; projections from China Wind Energy Association, China Photovoltaic Industry Association and China Electricity Council; analysis for Carbon Brief by Lauri Myllyvirta.

The projections shown in the figure above illustrate that the energy industry expects to be able to navigate the new renewable pricing policy and to maintain a high level of wind and solar additions over the next two years.

The policy has, however, created a lot more uncertainty. The stop-go cycle of a flood of installations in the first half of this year and then a slowdown in the second half – likely especially in the distributed solar segment – is likely to be a tough time for the industry. 

The uncertainty relates above all to two things. First is the local implementation of the policy, as provincial governments have a lot of leeway here. Given the economic significance of clean energy for many provinces, they can be expected to seek to implement the policy in a way that minimises disruptions to the industry.

The other source of uncertainty is central government targets. The pricing policy ties the availability of more favorable pricing to central government energy targets, after clean-energy growth outpaced those targets by a wide margin in the past few years. 

This emphasises the importance of the targets set for the next five year plan. The National Energy Administration (NEA) is targeting “more than 200GW” per year of clean-energy capacity added, which is far lower than the 360GW added last year. 

The effect of the pricing policy also depends on market conditions, of course, with a risk of oversupply of coal-fired power due to the ongoing rapid addition of new coal-fired power plants.

China’s nuclear construction also keeps accelerating, with another 10GW of reactor projects approved in April, on top of 10GW approved in each of the previous two years. These projects will contribute to clean power supply towards 2030 as they are completed.

China faces widening gap to Paris pledge

The uncertainty around wind and solar expansion also has implications for China’s international climate pledges under the Paris Agreement.

After exceptionally slow progress in 2020-23, China is significantly off track for its 2030 commitment to reduce carbon intensity – the emissions per unit of economic output. It is almost certain to miss its 2025 target. Carbon intensity fell by 3.4% in 2024, falling short of the rate of improvement needed to meet the 2025 and 2030 targets.

The government work plan for 2025 did not set a carbon intensity target. It only included a target for reducing the intensity per unit of GDP for energy supply from fossil fuels by 3%, excluding use for raw materials.

This provides an indirect indication of the targeted improvement in carbon intensity. In 2024, carbon intensity fell by 3.4%, while fossil energy intensity fell by 3.8%. If the ratio is similar in 2025, then carbon intensity would need to fall by around 2.5% at a minimum, allowing CO2 emissions to increase by more than 2%, if the target for 5% GDP growth is also met.

The absence of a carbon intensity target and the lack of emphasis on reducing carbon intensity also signals that meeting the target is not seen as a priority at the moment.

The government work plan emphasised the “dual-carbon” goals of peaking CO2 emissions before 2030 and achieving carbon neutrality before 2060.

However, these goals allow CO2 emissions to continue to increase until the end of the decade, implying the potential for a significant absolute emission increase from 2024 levels by 2030. The “dual-carbon” goals, even if met, therefore do not guarantee the delivery of China’s current key international climate commitment, the 2030 carbon-intensity target.

Even if emissions fell this year, improvements to carbon intensity would need to accelerate sharply in the next five years to meet China’s 2030 Paris commitment.

If China remains committed to its 2030 pledge, then this acceleration would need to be reflected in the targets set in the country’s next five-year plan.

Outlook for 2025 and beyond

The past 12 months mark a potentially significant turning point for China’s CO2 emissions, with clean-energy growth for the first time outpacing demand growth and displacing fossil fuel use in the power sector.

Record-breaking clean energy additions expected in 2025, despite new pricing policy uncertainties, suggest that the trend will continue this year.

The longer-term trajectory depends heavily on the targets set in the upcoming five-year plan and on the economic policy response to US tariffs and other economic headwinds.

In the short term, the US tariffs will dampen energy demand growth and emissions. Economic policy designed to offset the impacts of Trump’s tariffs will likely boost the clean-energy sector further and might lead to a shift towards domestic consumption as an economic driver, implying lower energy consumption growth relative to GDP. 

On the other hand, previous rounds of economic stimulus in China have led to sharp increases in emissions. If China is to deliver stimulus that targets consumption and new technology, rather than emissions-intensive construction and heavy industry, then it will require a significant break with earlier patterns.

Whether power-sector emissions have peaked will be determined by a race between growth in clean energy supply and total power demand growth. 

The new renewable electricity pricing policy, which ties the volume of “contracts for difference” given out to new solar and wind projects to national clean energy targets, further increases the importance of target-setting in China’s upcoming 2035 climate targets under the Paris Agreement and in the next 15th five-year plan, covering 2026-2030.

Sector-by-sector analysis suggests that, in addition to the power sector, emissions have likely also peaked in the building materials and steel sectors, as well as oil products consumption.

These sectors together represent over 80% of China’s fossil fuel-related CO2 emissions. However, there are uncertainties and potential for short-term rebound in all of these sectors.

The sector with remaining potential for substantial emissions growth is coal-to-chemicals. The drop in oil prices after US tariff announcements will undermine the profitability of this sector and likely lead to lower utilisation of plants, even as more capacity is added. China’s counter-tariffs on imports of petrochemical products from the US could have benefited the industry – but these have reportedly been waived.

All of this suggests that there is potential for China’s emissions to continue to fall and for the country to achieve substantial absolute emissions reductions over the next five years.

However, policy choices working in the opposite direction could just as easily see emissions increase further towards 2030.

About the data

Data for the analysis was compiled from the National Bureau of Statistics of China, National Energy Administration of China, China Electricity Council and China Customs official data releases, and from WIND Information, an industry data provider.

Wind and solar output, and thermal power breakdown by fuel, was calculated by multiplying power generating capacity at the end of each month by monthly utilisation, using data reported by China Electricity Council through Wind Financial Terminal.

Total generation from thermal power and generation from hydropower and nuclear power was taken from National Bureau of Statistics monthly releases.

Monthly utilisation data was not available for biomass, so the annual average of 52% for 2023 was applied. Power sector coal consumption was estimated based on power generation from coal and the average heat rate of coal-fired power plants during each month, to avoid the issue with official coal consumption numbers affecting recent data. 

When data was available from multiple sources, different sources were cross-referenced and official sources used when possible, adjusting total consumption to match the consumption growth and changes in the energy mix reported by the National Bureau of Statistics.

CO2 emissions estimates are based on National Bureau of Statistics default calorific values of fuels and emissions factors from China’s latest national greenhouse gas emissions inventory, for the year 2018. Cement CO2 emissions factor is based on annual estimates up to 2024.

For oil consumption, apparent consumption is calculated from refinery throughput, with net exports of oil products subtracted.

Original article by Lauri Myllyvirta republished from Carbon Brief under a CC license

Orcas comment on killer apes destroying the planet by continuing to burn fossil fuels.
Continue ReadingAnalysis: Clean energy just put China’s CO2 emissions into reverse for first time

Just 36 Companies Drove Half the World’s Climate-Altering Emissions in 2023: New Report

Spread the love

Original article by Sharon Kelly republished from DeSmog.

Hurricane Harvey, downgraded to a tropical storm when it hit Vidor, Texas, flooded an Exxon gas station, Sept. 1, 2017. Credit: ©Julie Dermansky

Companies and states most responsible for climate change are also those working hardest to prevent climate action, new Carbon Majors report finds.

Half of the world’s carbon dioxide emissions in 2023 came from just three dozen companies, according to a new report released today by the Carbon Majors project, with the list dominated by coal, cement, and oil producers.

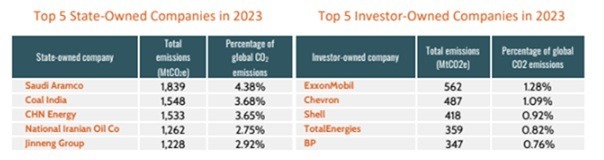
Saudi Arabia’s Saudi Aramco, the year’s worst offender, drove 4.4 percent of the world’s carbon dioxide pollution alone in 2023, the report found.

Five publicly-traded oil companies — ExxonMobil, Chevron, Shell, TotalEnergies, and BP — combined to produce an additional 4.9 percent of the year’s global carbon dioxide emissions from fossil fuels, the report adds.

The Carbon Majors database builds on the innovative work published by researcher Richard Heede of the Climate Accountability Institute (CAI) begun in 2013. For the first time, instead of attributing the build-up of industrial carbon dioxide and methane emissions to each of the world’s nations, Heede managed to trace those emissions to 90 specific “carbon major” companies. Last year, the nonprofit think tank InfluenceMap collaborated with CAI to produce major updates to the database — and today’s report marks the first annual update to that report, incorporating global data from 2023.

The year’s top carbon polluters were a mix of investor-owned and state-owned or national companies — but they have one thing in common.

“They’re some of the most obstructive actors towards climate policy,” Emmett Connaire, a senior analyst at the Carbon Majors project and one of the authors of the report, told DeSmog.

“I think it kind of kills the argument from industry that they’re not responsible for their CO2 emissions because we need fossil fuels to grow,” Connaire said, “when they’re the most obstructive and trying to keep up the demand for their products in the face of the overwhelming scientific opinion.” 

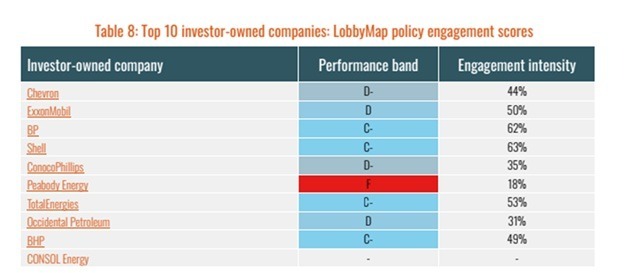
Eight of the nine public companies most responsible for carbon emissions in 2023 were “highly active or strategic” in their climate lobbying, the report notes. And their lobbying efforts took aim at regulating climate-altering pollution or sought to impede the energy transition.“ Of these 9 companies, 5 score a D or below, indicating unsupportive positions on climate policy,” the new report finds, citing data from InfluenceMap’s LobbyMap database, which grades companies based on their alignment with the Paris Agreement. “The remaining 4 score only slightly higher at C-.”

Top 10 investor-owned companies: LobbyMap engagement scores.
InfluenceMap gave climate policy lobbying scores to the top 10 investor-owned companies, all oil, gas, and coal firms. Credit: Carbon Majors 2025 report

None of the five top oil companies named in the report immediately responded to a request for comment from DeSmog.

Investor-owned companies aren’t the only ones actively fighting to prevent climate action, the Carbon Majors report notes.

“State-owned companies are even more oppositional to climate regulation globally according to LobbyMap research,” the report finds, listing Saudi Aramco, Russia’s Gazprom, Mexico’s Pemex, and China’s CHN Energy among the worst actors.

“The ‘Carbon Majors’ are keeping the world hooked on fossil fuels with no plans to slow production,” former United Nations climate chief and Paris Agreement architect Christiana Figueres said in a response accompanying the report. “While states drag their heels on their Paris Agreement commitments, state-owned companies are dominating global emissions — ignoring the desperate needs of their citizens.”

A sizable majority — 80 percent — of the year’s 20 worst offenders are state-owned, the report found.

The 2025 Carbon Majors report compared the total CO2 emissions and percentage of total emissions for the top 5 state-owned (Saudi Aramco, Coal India, CHN Energy, National Iranian Oil, Jinneng Group) and top 5 investor-owned (ExxonMobil, Chevron, Shell, TotalEnergies, BP) companies in 2023
State-owned fossil fuel companies dominated global climate emissions in 2023, compared to public companies, the Carbon Majors report noted. Credit: Carbon Majors report 2025

Throughout history, responsibility for driving climate change is concentrated among a strikingly small number of corporations, the report suggests.

Two-thirds of all fossil fuel and cement emissions worldwide from 1750 through 2023 can be traced to just 181 entities, the report finds, adding that one-third of emissions came from just 26 companies.

These findings may have significant legal consequences. During 2024, New York state and Vermont both enacted “Climate Superfund” laws that aim to hold fossil fuel producers and oil refiners responsible for the damage done by their climate-altering products — and the Carbon Majors database is a proposed tool to assess companies’ relative liabilities, according to InfluenceMap. Its earlier findings have been cited in civil lawsuits brought by U.S. cities and counties against fossil fuel producers and an inquiry in the Philippines (which has seen some of the strongest typhoons in recorded history) into corporate responsibility for human rights violations.

The report approaches companies’ contributions to climate change based on production data —  meaning that it focuses on the companies that do the drilling and mining (which helps avoid double-counting, Connaire told DeSmog). Those production figures are self-reported by companies but are widely used by governments to assess taxes and by investors in public companies. That methodology means that, for example, natural gas pipeline companies and natural gas utilities aren’t included in the report’s rankings. 

Nonetheless, natural gas producers figure among the report’s list of all-time top polluters. That includes the former Chesapeake Energy, which first rose to prominence — and some notoriety — during the shale gas fracking boom only to implode into bankruptcy in 2020. Chesapeake later emerged from bankruptcy and has since merged into the newly formed Expand Energy.

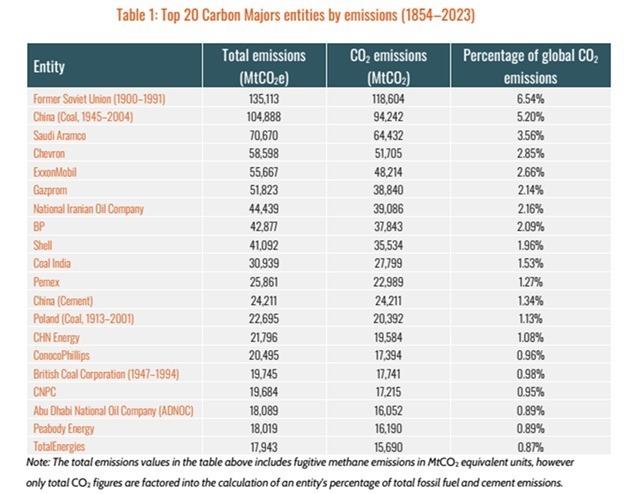
As the Carbon Majors database traces emissions throughout history, it accounts for the effects of mergers and acquisitions in the tumultuous oil industry, known for its booms and busts. “For example, the multiple smaller companies into which the Standard Oil Trust was broken up have evolved to become some of the most recognizable companies in the database today,” the report notes. “Some are direct descendants of Standard Oil, like ExxonMobil, with both Exxon and Mobil as descendants separately, and Chevron. Others have resulted from mergers with descendants of Standard Oil, such as BP and ConocoPhillips.”

Top 20 carbon majors entities by emissions, from 1854-2023: Former Soviet Union (1900-1991), China (Coal, 1945-2004), Saudi Aramco, Chevron, ExxonMobil, Gazprom, National Iranian Oil Company, BP, Shell, Coal India, Pemex, China (Cement), Poland (Coal, 1913-2001), CHN Energy, ConocoPhillips, British Coal Corporation (1947-1994), CNPC, Abu Dhabi National Oil Company (ADNOC), Peabody Energy, TotalEnergies
The Carbon Majors database traces the historical cumulative emissions of the top individual entities, such as Chevron or the former Soviet Union, from 1854 through 2023. Credit: Carbon Majors report 2025

It also calls attention to the importance of coal pollution — not just historically, but also in 2023.

“In 2023, coal remained the largest source of emissions, contributing 41.1 percent of emissions in the database,” the new report finds, “continuing a steady increase since 2016.”

Emissions from the cement industry — also a major driver of carbon pollution — increased significantly in 2023, rising 6.5 percent year-over-year, which the Carbon Majors report noted was “the largest relative rise” found. “Four of the five companies with the greatest relative increases in emissions in 2023 were cement companies — Holcim Group, Heidelberg Materials, UltraTech Cement, and CRH — with cement emissions seeing the largest relative rise among the four commodity types.”

Cement producers aren’t the only ones, however. In fact, emissions from most of the top emitters rose in 2023, the Carbon Majors report found. 

“It is truly alarming that the largest fossil fuel companies continue to increase their emissions in the face of worsening natural disasters caused by climate change, disregarding scientific evidence that these emissions are harming us all,” said Tzeporah Berman, founder of the Fossil Fuel Non-Proliferation Treaty Initiative. “It is clearer than ever that dirty private companies, driven by profits and business as usual, will never choose to self-regulate. Governments around the world must use their power to end fossil fuel expansion and transition their economies before fossil fuel companies destroy the planet.”

Original article by Sharon Kelly republished from DeSmog.

Greenpeace activists display a billboard during a protest outside Shell headquarters on July 27, 2023 in London.
Greenpeace activists display a billboard during a protest outside Shell headquarters on July 27, 2023 in London. (Photo: Handout/Chris J. Ratcliffe for Greenpeace via Getty Images)
Neo-Fascist Climate Science Denier Donald Trump says Burn, Baby, Burn.
Continue ReadingJust 36 Companies Drove Half the World’s Climate-Altering Emissions in 2023: New Report

Humanity’s Chance to Reverse Amazon’s Slide Toward Tipping Point Is ‘Shrinking’

Spread the love

Original article by Eloise Goldsmith republished from Common Dreams under Creative Commons (CC BY-NC-ND 3.0).

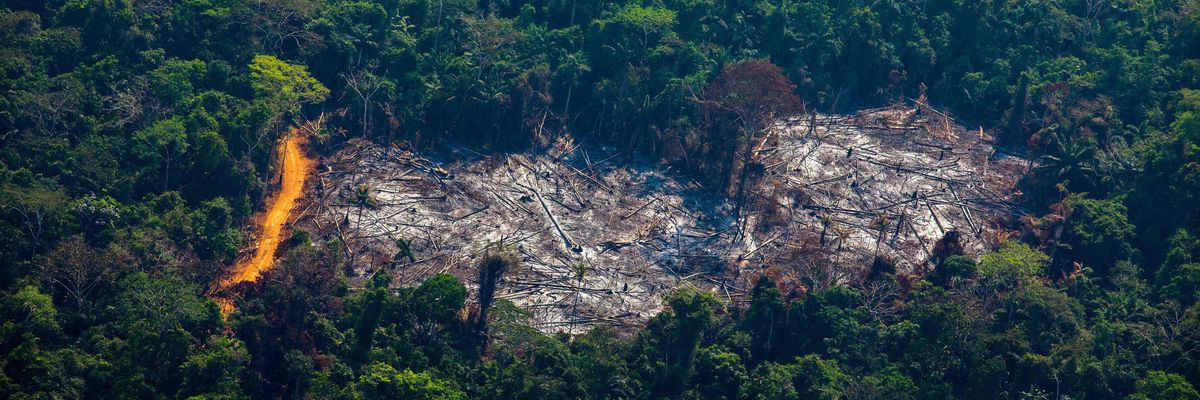
This aerial view shows Amazon forest degradation in the Menkragnoti Indigenous Territory in Altamira, Pará state, Brazil, on August 28, 2019. (Photo: Joao Laet/AFP/Getty Images)

The world’s largest rainforest showed “ominous indicators,” including wildfires and extreme drought, in 2024.

The Amazon, sometimes called the “lungs of the planet,” this year showed signs of further inching toward a much-feared tipping point, threatening the very existence of the world’s largest rainforest.

Rampant wildfires and extreme drought ravaged large parts of the Amazon in 2024. The fires and dry conditions were fueled by deforestation and the El Niño weather pattern, and also made worse by climate change, according to the World Economic Forum. “The number of fires reached its highest level in 14 years this September,” the group reported in October.

Drought has also impacted the Amazon River, causing one of the river’s main tributaries to drop to its lowest level ever recorded, according to October reporting from The Associated Press. The drop in the river has negatively impacted local economies and food supplies.

Andrew Miller, advocacy director at Amazon Watch, told the AP last week that the fires and droughts experienced across the Amazon in 2024 “could be ominous indicators that we are reaching the long-feared ecological tipping point.”

“Humanity’s window of opportunity to reverse this trend is shrinking, but still open,” he said.

The Amazon plays a vital role in keeping the planet healthy. 150-200 billion tons of carbon are stored in the Amazon, and it also carries 20% of the earth’s fresh water to sea.

According to the World Economic Forum, if the Amazon tipping point is reached, “it will release billions of tonnes of CO2 into the atmosphere through fires and plants dying off. This would further exacerbate climate change and make the 1.5°C goal impossible to achieve. It would also alter weather patterns, which would impact agricultural productivity and global food supplies.”

A paper published in the journal Nature in February indicates that up to half of the rainforest could hit a tipping point by the middle of the century. “We estimate that by 2050, 10% to 47% of Amazonian forests will be exposed to compounding disturbances that may trigger unexpected ecosystem transitions and potentially exacerbate regional climate change,” explained the researchers behind the paper.

However, it wasn’t all bad news out of the Amazon in 2024. According to the AP, the amount of deforestation in Brazil and Colombia declined in this year. In Brazil, which houses the largest chunk of the Amazon, forest loss dropped 30.6% compared to the year prior, bringing it to the lowest level of destruction in nearly a decade.

The improvement is an about-face from a couple of years ago, when the country registered 15-year high of deforestation during the leadership of former far-right President Jair Bolsonaro. Brazil is now led by the left-wing President Luiz Inácio Lula da Silva, who—despite presiding over this drop in deforestation—has also come under scrutiny, as AP noted, by environmentalist for backing projects that they argue could harm the environment.

Original article by Eloise Goldsmith republished from Common Dreams under Creative Commons (CC BY-NC-ND 3.0).

Continue ReadingHumanity’s Chance to Reverse Amazon’s Slide Toward Tipping Point Is ‘Shrinking’

Harvard set up worthless carbon offsetting scheme that sold millions of junk credits

Spread the love

Original article by Fin Johnston republished from TBIJ under a Creative Commons Attribution-NonCommercial-NoDerivs 3.0 Unported License.

Project has sold credits to EasyJet, British American Tobacco and Ernst & Young

A carbon offsetting project set up by Harvard University’s endowment fund has sold millions of junk credits to major international companies, the Bureau of Investigative Journalism (TBIJ) can reveal.

After establishing the scheme in 2012 on land it has bought in Uruguay, Harvard ended its involvement when it sold the land across two deals in 2017 and 2019 worth a combined $450m. But the project is still active today and has sold enough credits to have supposedly offset over 5 million tonnes of CO2 emissions – roughly equivalent to what a million cars would produce in a year.

EasyJet, British American Tobacco and Ernst & Young are all among the biggest buyers of credits from the project.

The current owner of the project told TBIJ it had received no revenues from sales of carbon credits to these companies. A spokesperson for the Harvard fund said it does not comment on individual investments.

The project was given the green light to sell carbon credits in 2012 by Verra, the carbon credit standards body. But in 2022 it was given a rating of zero by an agency that assesses the effectiveness of carbon offsetting schemes.

More from this investigation Tobacco giant’s ‘carbon neutral vape’ was offset with junk credits

The rating means that the credits, which should each represent one tonne of emissions avoided or removed from the atmosphere, represent no change. In other words, the project has had no effect on the environment at all.

The Guanaré Forest Plantations Project, a vast reforesting scheme, was set up following the 2006 purchase of an area of land in eastern Uruguay about the size of Washington DC. It was ultimately paid for by the university’s endowment fund, Harvard Management Company (HMC), a $50bn vehicle which invests to support research and student bursaries.

Though the land was bought through two companies set up by HMC, and the running of the project was outsourced to a Uruguayan forestry company, all the money made from sales of carbon credits went to the Harvard fund.

[section omitted: What is carbon offsetting?]

Carbon offsets allow companies to make up for the carbon emissions they create by paying to avoid or remove emissions elsewhere. Each carbon credit represents a ton of carbon dioxide either removed from the atmosphere or prevented from entering it in the first place.

Offsetting has been the subject of much debate. Some argue it is necessary and provides much-needed incentives for investors to channel their money into green initiatives. Others have said it offers polluting companies a way to avoid reducing their own greenhouse gas emissions.

The $2bn global market for carbon offsets has been hit by a number of recent scandals – with reports claiming that many credits do not represent genuine carbon reductions.

On day one of this year’s Cop climate talks in Baku, an early agreement was reached over rules around the creation of a global carbon market, in theory paving the way for rich countries to pay for cheap climate action abroad.

Among the project’s customers was British American Tobacco, which purchased 130,000 credits to offset emissions from its flagship product Vuse, marketed by the company as “the world’s first carbon neutral vape brand”.

The coffee company Lavazza also bought credits from the project to offset the emissions of a supposedly “carbon neutral” coffee capsule it launched in 2022.

Renoster, the agency that gave the project a zero rating, raised three criticisms of the scheme. The first hinged on a factor known as “additionality”, which exists to prevent companies from going about their normal business – for example running a commercial timber project – and selling carbon credits on top. If a project could run without carbon finance, then it cannot be considered additional.

Documents submitted to Verra state that the project’s objective is to create “high value” timber products. Renoster ruled that carbon finance had ultimately made no difference. “We believe that these trees were going to be planted regardless of the project,” it said.

The second criticism was that the scheme’s “baseline assumptions” were wrong. A baseline number is something given to every carbon offsetting project, against which its removals are measured. The project had a baseline of 0, meaning no emissions whatsoever would have been removed from the atmosphere if the scheme did not exist.

Renoster said that baseline was “not a reasonable assumption for the region” because large portions of nearby land were already being converted from pasture to eucalyptus plantations.

Renoster’s third criticism was that the project was unlikely to run its full course, which was projected to be 100 years.

“We do not believe that Guanaré’s carbon credits represent true emissions reductions,” Renoster’s chief science officer, Elias Ayrey, told TBIJ. “We would not consider carbon neutrality claims based on these particular credits to be legitimate.”

The current owners of the project said: “Carbon credits have been critical for achieving the rates of return that investors required when the project started.” They said this cash means they can let the trees grow for longer before they are harvested.

A second agency, BeZero Carbon, also assessed the project and raised similar concerns around additionality and baseline assumptions. It found that the project had a “low” likelihood of achieving the purported emissions avoidance or removal.

The project has also been criticised by World Rainforest Movement, an organisation that monitors the Uruguayan forestry industry, which said: “Industrial tree plantations in Uruguay have led to land concentration by a small group of corporations and investment funds. They replace an extremely important ecosystem – grasslands – to plant tree monocultures, destroying biodiversity and watersheds.”

A BAT spokesperson told TBIJ that its carbon neutrality claim was independently validated in 2021. Lavazza said it had removed the claims from its products and is dedicated to transparency in all its sustainability initiatives.

An EasyJet spokesperson told TBIJ that it transitioned away from offsetting in 2022 but until then “had robust due diligence processes in place”.

Ernst & Young said it selects offsetting projects which have been certified against internationally recognised standards and continues to work on its due diligence procedures. It said it retired all remaining credits in this project in 2023.

This story was updated on 20 November 2024 to clarify the response given to TBIJ by the Harvard fund.

Reporter: Fin Johnston
Global health editor: Fiona Walker
Deputy editor: Chrissie Giles
Editor: Franz Wild
Impact producer: Paul Eccles
Production editor: Alex Hess
Fact checker: Somesh Jha

TBIJ has a number of funders, a full list of which can be found here. None of our funders have any influence over editorial decisions or output.

Original article by Fin Johnston republished from TBIJ under a Creative Commons Attribution-NonCommercial-NoDerivs 3.0 Unported License.

Continue ReadingHarvard set up worthless carbon offsetting scheme that sold millions of junk credits

South America on fire

Spread the love

Original article by Pablo Meriguet republished from peoples dispatch under a Creative Commons Attribution-ShareAlike 4.0 (CC BY-SA) license.

Fires in Córdoba, Argentina have been raging for the past month. Photo: Córdoba Government

More than 300,000 fires have been reported so far in 2024 across South America. The blazes have displaced hundreds and killed several. The causes of this tragedy must be sought in deep geopolitical injustices.

South America is facing one of the most serious environmental crises in recent decades. In the last two months, there has been a dramatic increase in the outbreak of forest fires that have devastated thousands of square kilometers across Colombia, Ecuador, Brazil, Perú, Paraguay, Bolivia, and Argentina. The impacts of the blazes are exponential, not only seen in the direct destruction to the forests and wildlife and surrounding communities, but in many countries the dangerous smoke has traveled far beyond the site of the fire.

The tragedy of fires in South American countries

So far in 2024, more than 300,000 fires have been registered across South America.

In Brazil, the number of fires in southern Brazil (Pantanal and the Amazon) have increased by 92% compared to last year. In the whole country, more than 170,000 have been registered so far and more than 11 million hectares have been lost in this year so far. The fires have required massive state investments in order to alleviate the destruction. In the State of São Paulo alone, more than 15,000 people from the civil guard, firefighters and others have been mobilized to try to put out the fires.

In the El Chaco area, encompassing Bolivia and Paraguay, fires continue to consume thousands of hectares. More than 60,000 fires have been reported in Bolivia this year, with the regions of Rio Blanco and Palestina, in the east of the country, being the most affected and hundreds of people were evacuated. President Luis Arce has declared a national state of emergency to better address the environmental catastrophe. For now, Chile and Venezuela have offered assistance to Bolivia, which has not been able to quell the flames on its own.

In Córdoba, Argentina, fire continues to destroy millions of plants and animals despite the efforts of almost 1,000 firefighters who are trying to extinguish the flames. The strong winds in the central region of the country have made it even more difficult for hundreds of firefighters to extinguish the two large fires. In several cities in Córdoba, hundreds of people were urgently evacuated due to the threat of the flames.

In Colombia, more than 31 forest fires devastated 10,000 hectares of forest. The most affected region is the southwest encompassing the departments of Tolima, Valle del Cauca, and Huila. In these places, Petro’s government ordered the deployment of military troops to help in the rescue tasks and to alleviate the fires. Over a dozen fires are still raging in the country that threaten the lives of hundreds of people.

In Peru, the serious fires have already claimed the lives of over 20 people and experts estimate that it will take about 500 years for Peru’s ecosystems to recover from the latest fires. More than 49 active fires have reported by the National Emergency Operations Center, and are mainly located in Tumbes, Ayacucho, Amazonas, Cuzco, San Martin, and Cajamarca. The army has also been deployed in these areas, which are suffering from the ongoing forest fires.

Some underlying causes of fires 

The eruption of fires across the region and the widespread devastation to the continent’s flora and fauna has once again brought many to ask why these fires are breaking out. In some cases, the fires are literally sparked by “human intervention”, yet even in these cases, they could not have reached large proportions if it were not for the generalized state of drought in the region, as well as the high temperatures.

According to experts, the leading cause behind the fires is the climate change-induced drought in the region. The lack of rainfall is devastating in an ecosystem that especially requires water during certain periods of the year to subsist. Most of the environmental changes that have occurred worldwide due to global warming are due in particular to large companies that devastate ecosystems, and developed countries, which consume most of the world’s goods and generate most of the world’s CO2 emissions and waste.

In this case, the South American region, rich in flora and fauna (and therefore one of the most fragile areas), is one of the most affected by the economic inequality and production imbalance between developed and developing countries, with many countries on the continent producing overwhelmingly raw materials for export.

The production of monoculture crops for agro-export business in many regions of the continent often requires the destruction of native plants to clear land. The vast forests of the continent are also often taken advantage of by large timber companies whose felling of trees also desertifies vast areas of land. The extraction of minerals by multinational mining companies also requires large amounts of water for processing and has severe impacts on the surrounding region also because of the chemicals used in the process.

In addition, it must be taken into account that the fires, already a product of global warming, release thousands of tons of additional CO2 into the environment, which worsens global warming. It is a vicious circle that endangers not only the affected regions but also the existence of all species on Earth.

For now, South American states are quite simply not prepared to face these challenges, especially because many of them have decided to reduce the size of the state, further liberalize the economy by allowing large companies to do whatever they want in rural areas and with their countries’ natural resources, and defund various emergency and rescue groups such as firefighters and forest rangers. The drought is also preventing hydroelectric plants from producing the energy needed to supply its citizens. In addition, wildfire emergencies are not being adequately addressed by firefighting groups that often do not have adequate funding to hire more recruits and acquire better equipment. This is without taking into account the millions of animals (many of them endangered) that are dying every day in the flames, or that have to flee their natural habitat without the certainty that they will be able to survive in a new environment.

Climate change has long ceased to be a theoretical hypothesis. Old speculations about the consequences of a radically unjust world now take the form of flares that can be seen for hundreds of kilometers (only a blind man does not see them); developed countries pollute poor countries and in doing so are destroying the natural wealth of the people, which, in many ways, is all they have. Climate change in South America (this environmental projection of colonialism) is killing people and devastating life and is today a hell that seems to have no end.

Original article by Pablo Meriguet republished from peoples dispatch under a Creative Commons Attribution-ShareAlike 4.0 (CC BY-SA) license.

Continue ReadingSouth America on fire