State of the climate: 2024 will be first year above 1.5C of global warming

Spread the love

Original article by Zeke Hausfather republished from Carbon Brief under a CC license.

This year is now virtually certain to beat 2023 as the hottest year on record, Carbon Brief analysis shows.

It will also be the first full year to surpass 1.5C above pre-industrial levels across the majority of observational records.

In this latest “state of the climate” quarterly update, Carbon Brief finds:

  • The year 2024 has seen record warm temperatures for seven of the nine months of the year where data is so far available.
  • The world, as a whole, has warmed approximately 1C since 1970 – and 1.2C to 1.4C since the mid-1800s.
  • A strong El Niño event contributed to exceptionally high global temperatures early in the year, but record or near-record temperatures persisted despite the fading of El Niño in recent months.
  • Record global temperatures have been seen across many regions of the planet over the first nine months of the year.
  • Global temperatures are closely aligned with the projections from climate models.
  • Global sea ice extent is currently at record lows and Antarctic sea ice has spent much of the year at near-record lows – second only to those seen in 2023.

The warmest year on record

In this latest quarterly state of the climate assessment, Carbon Brief has analysed records from five different research groups that report global surface temperature records: NASA’s GISTEMPNOAA’s GlobalTempHadley/UEA’s HadCRUT5Berkeley Earth; and Copernicus/ECMWF

The figure below shows Carbon Brief’s estimate of where 2024 temperatures will end up in each of the groups, based on the year to date and expected El Niño-Southern Oscillation (ENSO) conditions in the tropical Pacific for the remainder of the year. 

The dots reflect the best estimate, while the whiskers show the two sigma (95%) confidence interval of the projections. The prior record year (2023 in all groups) is shown by the coloured square. https://interactive.carbonbrief.org/state-of-the-climate/24-Q3/projections.htmlCarbon Brief’s project of 2024 annual global average surface temperatures for each group, along with 95% confidence intervals and prior record (2023) values. 1.5C above pre-industrial (1850-1900) levels is shown by a dashed line. The average projection represents a composite of all five records following the WMO approach. Chart by Carbon Brief.

In all cases, the projected global average temperature for 2024 is virtually certain to exceed the prior record set in 2023. 

Three of the five groups (Hadley, Berkeley and Copernicus/ECMWF) are very likely to show annual temperatures exceeding 1.5C above pre-industrial levels (defined here as the 1850-1900 period), while the NASA record has a roughly 40% chance of exceeding 1.5C. Only NOAA’s record is unlikely to show global temperatures above 1.5C this year.

These differences in warming since pre-industrial across different datasets primarily result from choice of ocean records used, as well as differences in approaches to filling in gaps between observations in the early part of the records (e.g. pre-1900s). It reflects the uncertainty in the degree of warming since the mid-1800s, with projected 2024 temperatures ranging from 1.44C (NOAA) to 1.61C (Berkeley Earth).

The figure also provides a composite average of the five different datasets, following the approach used in the sixth assessment report (AR6) from the Intergovernmental Panel on Climate Change (IPCC) and by the WMO. Carbon Brief’s analysis finds that 2024 will be the first year above 1.5C in the composite average. 

This provides a way to determine the first year where we can reasonably say that the world has passed that warming level – even though 2023 exceeded 1.5C in the Berkeley Earth dataset and 2024 will not exceed 1.5C in the NOAA dataset.

(It is important to note that exceeding 1.5C in a single year is not equivalent to breaching the Paris Agreement limit. The goal is generally considered to refer to long-term warming – typically over two or three decades – rather than annual temperatures that include the short-term influence of natural fluctuations in the climate, such as El Niño.)

The figure below shows the annual temperatures from each of these groups between 1970 and present, with the year-to-date 2024 temperatures for each record shown as individual points. https://interactive.carbonbrief.org/state-of-the-climate/24-Q3/records_2024_to_date.htmlAnnual global average surface temperatures from NASA GISTEMPNOAA GlobalTempHadley/UEA HadCRUT5Berkeley Earth and Copernicus/ECMWF (lines), along with 2024 temperatures to date (January-September, coloured shapes). Each series is aligned by using a 1981-2010 baseline, with warming since pre-industrial based on the IPCC AR6 estimate of warming between pre-industrial and the 1981-2010 period. Chart by Carbon Brief.

There is strong agreement between the different temperature records, with all of them showing approximately 1C warming between 1970 and present. Global temperatures have been around 1.3 above pre-industrial levels in recent years (with a range of 1.2C to 1.4C across the different temperature datasets, reflecting that the differences between them are larger in the 1800s and early 1900s).

As the chart below shows, 2024 (purple line) started out remarkably warm as a result of a strong El Niño event that built in 2023 (red) and peaked near the beginning of the year. 

However, global temperatures have remained quite elevated despite the fading of El Niño conditions, setting records through June and remaining quite close to 2023’s exceptional highs in recent months. 

Overall, 2024 has set or tied all-time records for seven of the 10 months available to-date in the ERA5 record. (This record uses weather model-based reanalysis to combine lots of different data sources over time.)https://interactive.carbonbrief.org/state-of-the-climate/24-Q3/monthly_global_temperature_anomalies_Q3_2024.htmlTemperatures for each month from 1940 to 2024 from Copernicus/ECMWF ERA5. Anomalies plotted with respect to a 1850-1900 baseline. Chart by Carbon Brief.

While human emissions of CO2 and other greenhouse gases are responsible for effectively all of the Earth’s long-term warming, temperatures in any given year are strongly influenced by short-term variations in the Earth’s climate that are typically associated with El Niño and La Niña events

These fluctuations in temperature between the ocean and atmosphere in the tropical Pacific help make some individual years warmer and some cooler. 

The figure below shows a range of different ENSO forecast models produced by different scientific groups. The values shown are sea surface temperature variations in the tropical Pacific – the El Niño 3.4 region – for three-month periods.

El Niño Southern Oscillation (ENSO) forecast models for overlapping three-month periods in the Niño3.4 region
El Niño Southern Oscillation (ENSO) forecast models for overlapping three-month periods in the Niño3.4 region (July, August, September – JAS – and so on) for the remainder of 2024 and then into the spring and summer of 2025. Credit: CPC/IRI ENSO forecast.

Most models expect neutral conditions in the tropical Pacific, with only a few crossing the -0.5C Niño 3.4 sea surface temperature (SST) anomaly that represents the development of a formal La Niña event. 

This should result in relatively cooler temperatures in 2025, though it is possible that the year ends up warmer than anticipated given the continuation of high temperatures in recent months – despite the absence of El Niño conditions.

Large areas of record warmth

While global average temperatures are an important indicator of changes to the broader climate system over time as a result of human activities, these impacts will differ as some regions experience more rapid warming or extreme heat events than is reflected in the global average.

The figure below shows the parts of the world that saw record warm or cold temperatures over the first three quarters of 2024 (January through to September) in the Berkeley Earth dataset compared to all prior years since global temperature record began in 1850.

Map of year-to-date (January-September) regions that set new records (warmest through to fifth warmest). Note that no regions set cold records for the year-to-date in 2024.
Map of year-to-date (January-September) regions that set new records (warmest through to fifth warmest). Note that no regions set cold records for the year-to-date in 2024. Credit: Berkeley Earth

Notably, no area on Earth saw record cold (or even the second, third, fourth or fifth coldest temperatures on record). Nearly all of Central America and large parts of South America saw their warmest year to date on record, as did much of eastern Europe, Africa, China, south-east Asia, and Korea. 

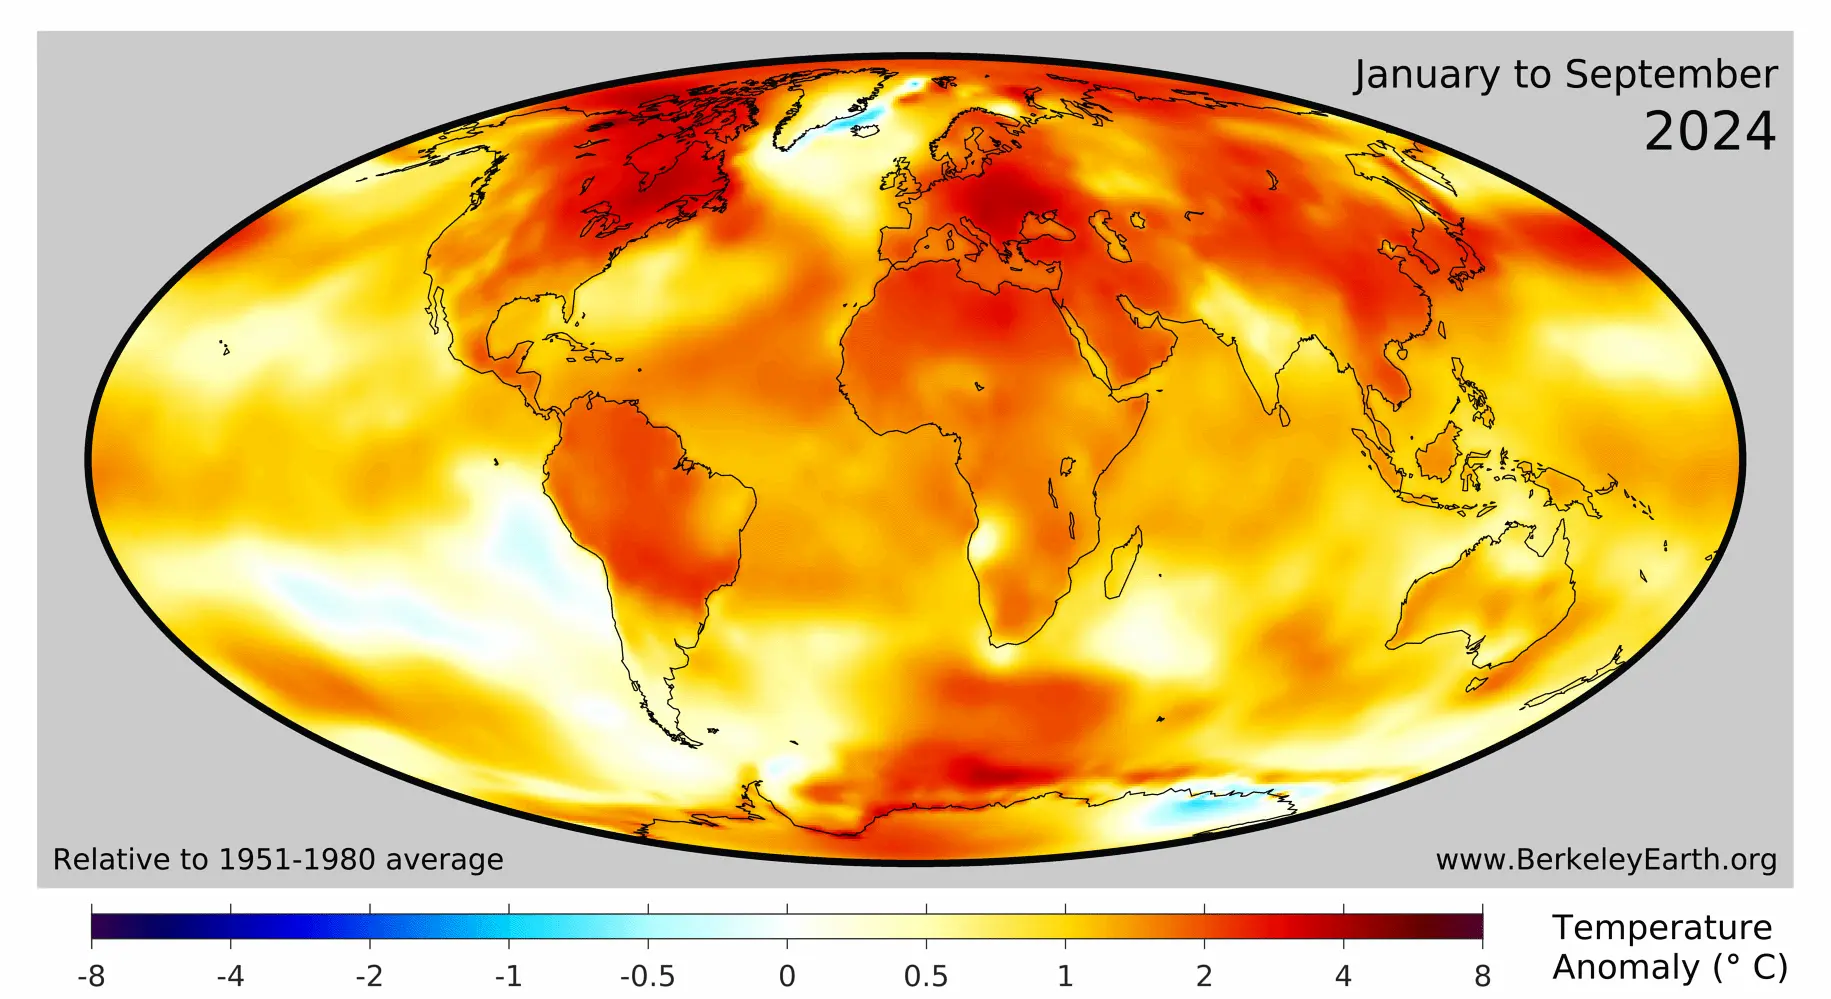
The figure below shows the temperature anomaly over the first nine months of the year compared to the 1951-80 baseline period used by Berkeley Earth. Warming was particularly pronounced over land regions, with many areas already showing warming of 1.5C or 2C above that baseline.

Map of year-to-date (January-September) global surface temperatures. Anomalies are shown relative to the 1951-80 period following the convention used by Berkeley Earth.
Map of year-to-date (January-September) global surface temperatures. Anomalies are shown relative to the 1951-80 period following the convention used by Berkeley Earth. Credit: Berkeley Earth

Temperatures are tracking climate model projections

Climate models provide physics-based estimates of future warming given different assumptions about future emissions, greenhouse gas concentrations and other climate-influencing factors

The figure below shows the range of individual models forecasts featured in AR6 – known collectively as the CMIP6 models – between 1970 and 2030, with grey shading and the average projection across all the models shown in black. Individual observational temperature records are represented by coloured lines.https://interactive.carbonbrief.org/state-of-the-climate/24-Q3/model_obs_comps_Q3_2024.htmlTwelve-month average global average surface temperatures from CMIP6 models and observations between 1970 and 2024. Models use SSP2-4.5 forcings after 2015.Anomalies plotted with respect to a 1981-2010 baseline. Chart by Carbon Brief.

While global temperatures were running below the pace of warming projected by climate models for much of the period between 2008 and 2022, the past two years have been closer to the model average

However, the CMIP6 models may be biassed a bit too warm, with a subset of “hot” models pushing up the average. The IPCC used an approach that weighted models based on how well they reproduced historical temperatures, rather than simply averaging all the models together.

Excluding these hotter models from the analysis results in observations over recent years much closer to the multi-model average and near the centre of the uncertainty range across all models. It also reveals that the past two years – 2023 and 2024 – have been near the upper end of the model range.https://interactive.carbonbrief.org/state-of-the-climate/24-Q3/model%20_obs_comps_filtered_Q3_2024.htmlTwelve-month average global average surface temperatures from CMIP5 models and observations between 1970 and 2024. Models use SSP2-4.5 forcings after 2015. Anomalies plotted with respect to a 1981-2010 baseline. Chart by Carbon Brief.

Record low global sea ice extent

Highly accurate observations of Arctic and Antarctic sea ice have been available since polar-observing satellites became available in the late 1970s. 

Arctic sea ice extent during the first three-quarters of 2024 has been below or at the low end of the historical 1979-2010 range, but has not seen any record daily lows. 

Antarctic sea ice, on the other hand, set new all-time low records for a few days in July and September, and has generally been the second lowest on record (after 2023) from June onwards.

The figure below shows both Arctic (red) and Antarctic (blue) sea ice extent in 2024, the historical range in the record between 1979 and 2010 (shaded areas) and the record lows (dotted black line).

Unlike global temperature records (which only report monthly averages), sea ice data is collected and updated on a daily basis, allowing sea ice extent to be viewed through to the present day.https://interactive.carbonbrief.org/state-of-the-climate/24-Q3/sea_ice.htmlArctic and Antarctic daily sea ice extent from the US National Snow and Ice Data Center. The bold lines show daily 2024 values, the shaded area indicates the two standard deviation range in historical values between 1979 and 2010. The dotted black lines show the record lows for each pole. Chart by Carbon Brief.

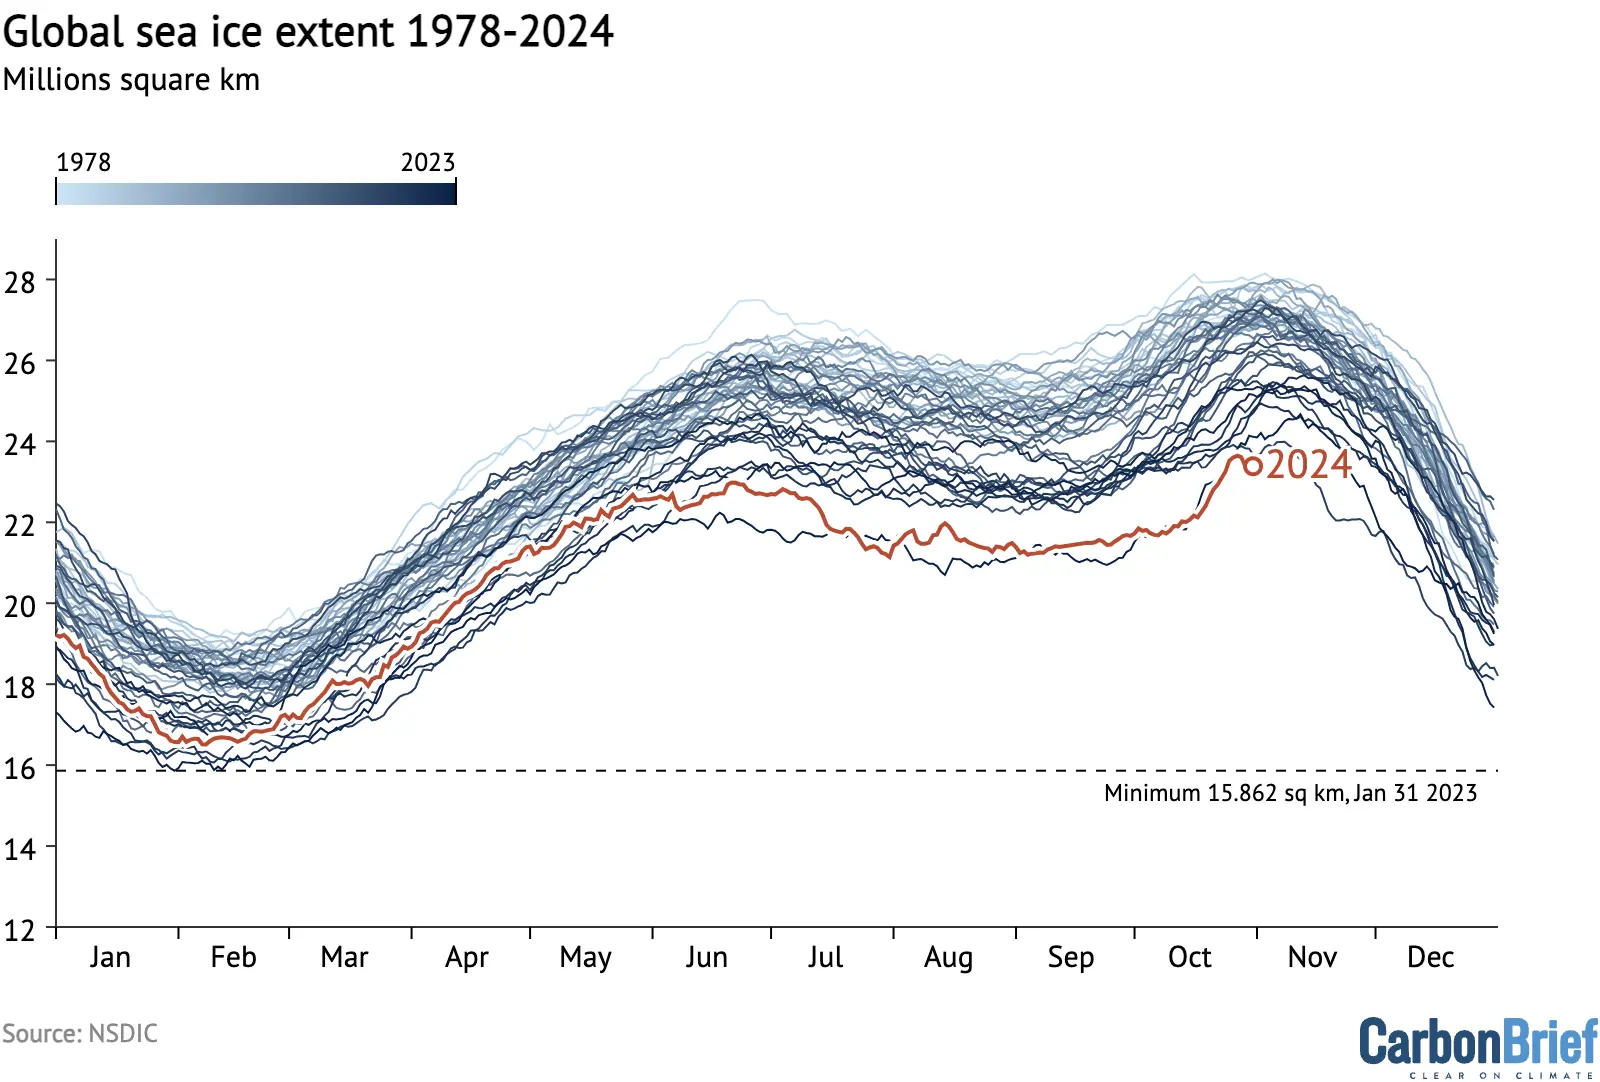
Global sea ice extent is estimated by combining both Arctic and Antarctic sea ice extent. The figure below shows global sea ice extent in each year, with 2024 shown in red. Currently global sea ice extent is at record-low levels, below the prior record for this date set in 2023.

Global sea ice extent

Methodological note

statistical multivariate regression model was used to estimate the range of likely 2024 annual temperatures for each group that provides a temperature record. This model used the average temperature over the first six months of the year, the average ENSO 3.4 region value during the first nine months of the year and the average predicted ENSO 3.4 value during the last three months of the year to estimate the annual temperatures. 

The model was trained on the relationship between these variables and annual temperatures over the period of 1950-2023. The model then uses this fit to predict both the most likely 2024 annual value for each group, as well as the 95% confidence interval. The predicted ENSO 3.4 region values for the last three months of 2024 are taken from the IRI plume forecast.

The percent likelihood of different year ranks for 2024 is estimated by using the output of the regression model, assuming a normal distribution of results. This allows Carbon Brief to estimate what percent of possible 2024 annual values fall above and below the temperatures of prior years for each group, as well as the likelihood of the year exceeding 1.5C in each record.

Original article by Zeke Hausfather republished from Carbon Brief under a CC license.

Continue ReadingState of the climate: 2024 will be first year above 1.5C of global warming

Guest post: What 1.5C overshoot would mean for climate impacts and adaptation

Spread the love

Original article by multiple authors republished from Carbon Brief under a CC license

With average global temperatures set to see another record high this year, the chances of holding warming to no more than 1.5C continue to dwindle.

Keeping warming below 1.5C by the end of the century – in line with the long-term goal of the Paris Agreement – now likely involves “overshooting” 1.5C and then bringing temperatures back down later by removing carbon dioxide (CO2) from the atmosphere. 

(What this means for “net-negative” emissions is covered in a previous guest post.)

This raises a number of unknowns in terms of what overshoot means for the impacts of climate change on the planet, people and ecosystems. 

For example, even if global temperatures can be brought back down again by the end of the century, will the impacts of climate change also reduce? Will coral reefs be able to recover or will glaciers reform? What will it mean for the world’s coastlines, food production and endangered species?

For the past three years, we have been working on a Horizon Europe-funded project called PROVIDE to dive deeper into what overshoot really looks like for countries, regions and cities. 

This data is available on the Climate Risk Dashboard – a tool to help people see how climate change will affect them and how it depends on the actions taken today.

Until carbon emissions are reduced to net-zero, the world will not stop warming. Delay will result in ever more intense climate impacts – and increase the risk of crossing irreversible thresholds. 

Urban heat stress under overshoot

One of the clearest and most acute impacts of climate change is on extreme heatwaves. Our findings suggest that, were global average temperatures to decline, extreme heat events in most locations will also decrease, on average. 

But achieving a new balance in local climates would be a slow process, influenced by ongoing climate system adjustments for decades – if not centuries – to come.

Reversing climate change would most probably take several decades, even if overshoot is limited to a few tenths of a degree. This implies that the climate risks that generations alive today will be exposed to are largely determined by collective actions today. 

We can illustrate these differences for the risks of extreme heat stress for the Indian city of Chennai, one of 140 cities for which we modelled urban heat stress risks at 100-metre spatial resolution.  

The chart below shows the projected annual number of days of extreme heat stress in Chennai – defined as days where wet-bulb globe temperature (WBGT) goes over 31C. (WBGT is a metric that combines air temperature, humidity and exposure to direct sunlight.)

This level of heat stress approaches the limits of human survivability (without adaptation) – for example, physical outdoor labour is almost impossible under these conditions.

Under current 2020 climate policies, leading to a best estimate of about 3C of warming in 2100, extreme heat days increase pretty much unchecked. By the end of the century, around half of the days (180) per year would experience extreme heat stress conditions (or even higher). 

In contrast, in a 1.5C low-overshoot scenario (the IPCC Shifting Pathway), the number of extreme heat stress days would peak mid-century at around 120 days , before declining again to around 110 days by 2100 as global average temperature decreases from just above 1.5C to around 1.3C. This is a modest decline in extreme heat risk, yet a profound difference from a 3C world. 

Projected days a year with extreme heat stress in Chennai from 2020 to 2100
Projected days a year with extreme heat stress in Chennai from 2020 to 2100 under the climate policies of 2020 (blue) and 1.5C low-overshoot scenario called “IPCC Shifting Pathway” (green). Source: PROVIDE Dashboard

Irreversible consequences from overshoot

There are many other impacts of climate change that will be irreversible – for centuries to millennia – at peak temperatures, let alone if society is able to bring warming back down.

Coral reef lossglacier losssea level rise and the loss of many species and ecosystems all fall into this category.

Yet, a lot of these losses can still be avoided by stringent mitigation. For example, our multi-scenario framework allows us to explore glacier futures showing unavoidable, or “locked-in”, risks even under the lowest emission scenario we have explored, and compare them with the avoidable risks through stringent mitigation. 

Below, we provide an example for glacier volume projections for Peru, where glaciers serve as an essential freshwater resource during the extremely dry season of June to September. Due to past warming, glacier loss will continue over the coming decades. Under a current policy scenario (blue dots), 50% of the glacier volume might be lost as early as 2050.

Yet this does not need to happen. In fact, stringent mitigation pathways (green dots) are still possible that give a four-in-five chance of preserving 50% of today’s glacier ice in Peru, avoiding the worst and helping to maintain some of their vital uses.

Chart illustrating risks of losing 50% of 2020 glacier volume for Peru today and in 2030, 2050 and 2100
Chart illustrating risks of losing 50% of 2020 glacier volume for Peru today and in 2030, 2050 and 2100, under the climate policies of 2020 (blue) and 1.5C low-overshoot scenario called “IPCC Shifting Pathway” (green). Shading highlights the avoidable risk. Source: PROVIDE Dashboard.

Overshoot risks for the biosphere

Climate change represents a major threat to biodiversity globally. We modelled species at risk from local extinction for about 135,000 terrestrial fungi, plants, invertebrates and vertebrates based on the Wallace Initiative

Under the assumption that the 1950-2000 reference climate was suitable for the species at question, we model the proportion of species for which the local climate becomes unsuitable under ongoing climate change. 

In the chart below, we illustrate the risks to species in one of the countries with the world’s richest terrestrial biodiversity, Brazil. Under the current policy scenario (blue dots), the likelihood of 50% of species being at risk of local extinction rises to 74% by 2100. Yet, our analysis shows that this likelihood can still be avoided almost entirely by stringent mitigation (green dots). 

Chart showing the likelihood of 50% of Brazilian species being at risk of local extinction today and in 2030, 2050 and 2100
Chart showing the likelihood of 50% of Brazilian species being at risk of local extinction today and in 2030, 2050 and 2100, under the climate policies of 2020 (blue) and 1.5C low-overshoot scenario called “IPCC Shifting Pathway” (green). Shading highlights the avoidable risk. Source: PROVIDE Dashboard.

It is important to highlight that species loss does depend on a range of factors – of which climate suitability is only one. Yet there is a range of other human-caused stressors to biodiversity loss and a complex interdependencies of species and food webs in particular in the most biodiverse ecosystems implies the risk of knock-on effects and ecosystem tipping points

We also note that our results do not necessarily imply global species extinction and do not allow us to quantify if and how species survival under different overshoot trajectories would emerge. 

Overshoot will stress adaptation planning

Overshoot outcomes matter for climate risk assessments. Yet, in contrast with the prominence of overshoot pathways in the climate mitigation literature, their implications for adaptation planning have not been widely explored.

Overshoot would increase the threat of climate change that society needs to adapt to – and make that adaptation more difficult. Some options may become unavailable due to limits of adaptation

Also, timescales matter. Reversing an overshoot will take decades. Even assuming reversibility of climate hazards in the future as temperatures come down, this might only matter for adaptation decisions that involve a planning horizon of 50 years or more.

This is illustrated in the chart below, from our recent Nature study. This shows a stylised trajectory of warming (top chart) with overshoot (red bars) and how it compares to planning horizons for some example adaptation options (green bars), the lifetime of those measures (blue bars) and the intergenerational equity they involve (bottom chart).

The possibility of reversing long-term impacts in the future does not reduce the urgent need to act now on closing the wide gap in current adaptation efforts.

Figure showing stylised temporal evolution of a reversible climate impact driver
Figure showing: a) stylised temporal evolution of a reversible climate impact driver under a peak and decline scenario. Dashed lines indicate a low and high overshoot outcome with median timescales of global temperature reversibility typically in line with those from the IPCC AR6 database; and b) stylised illustration of adaptation-relevant timescales starting in 2030, including different planning horizons for adaptation planning (green bars) and lifetimes of individual adaptation measures (blue), and the effect of applying discounting (reflecting societal preferences towards intergenerational equity) to future damages and adaptation benefits. Source: Schleussner et al. (2024)

Limit peak warming and aim for long-term decline

While our results clearly underscore the importance of limiting peak warming to as low as possible, there are also very good arguments for aiming for a long-term global temperature decline, irrespective of the peak warming level. 

For a wide range of time-lagged climate impacts, such as ice sheet, peatland and permafrost loss, as well as large-scale irreversible tipping points, achieving temperature decline well below 1.5C is key to limiting long-term risks from global warming. 

Overshoot is clearly not an alternative way to achieve a similar climate outcome. Effectively limiting climate risks requires restricting peak warming as low and as close to 1.5C as possible – and then aim for long-term decline to reduce the climate impact legacy of human-caused emissions.

This guest post is by:

Dr Carl-Friedrich Schleussner leads the integrated climate impact group at the International Institute for Applied Systems Analysis (IIASA) and is a scientific advisor at Climate Analytics, Berlin.

Prof Rachel Warren, professor of global change and environmental biology at the University of East Anglia.

Dr Fabien Maussion, associate professor in glaciology at the School of Geographical Sciences, University of Bristol, UK.

Dr Niels Souverijns, urban climatologist at VITO Belgium and guest professor at KU Leuven.

Dr Quentin Lejeune, a climate scientist who has led the development of the PROVIDE Climate Risk Dashboard at Climate Analytics.

Original article by multiple authors republished from Carbon Brief under a CC license

Continue ReadingGuest post: What 1.5C overshoot would mean for climate impacts and adaptation

Activists blockade two Israeli weapons sites in Bristol

Spread the love

https://morningstaronline.co.uk/article/activists-blockade-two-israeli-weapons-sites-bristol


Protesters use a van to block the gates to Elbit at Filton near Bristol Photo: Neil Terry Photography

ACTIVISTS blockaded two Israeli weapons sites in Bristol as they vowed to redouble their efforts to shut down Elbit Systems today.

Palestine Action used lock-on devices inside vans to block the gates at the entrances of both sites, preventing anyone from coming in or out.

One of the sites, a facility at Filton, is the brand new £35 million research and development hub of Israel’s biggest weapons firm.

The other site is Elbit’s headquarters at Aztec West 600, which the activists said is used by Elbit to oversee their logistical, financial, and operational affairs throughout the country.

https://morningstaronline.co.uk/article/activists-blockade-two-israeli-weapons-sites-bristol

Continue ReadingActivists blockade two Israeli weapons sites in Bristol

Trump’s return threatens renewed assault on Venezuela

Spread the love

https://morningstaronline.co.uk/article/trump’s-return-threatens-renewed-assault-venezuela

An image of Republican presidential nominee former President Donald Trump hangs in the window of a campaign office in Hamtramck, Michigan, November 4, 2024

TIM YOUNG warns that the president-elect’s record of economic and political interference from his last stint in the White House show dangerous potential for escalated aggression against the Bolivarian government from 2025

THE US election result raises the spectre of Trump renewing the assault on Venezuela that his loss to Biden interrupted in 2020.

In office between 2016 and 2020, Trump’s approach to Latin America showed an implacable hostility towards Venezuela, as well as other governments in the region determined to advance their population’s interests, not those of the US.

Venezuela has been subjected to US extraterritorial intervention and interference for over two decades. From the early days of Hugo Chavez’s election as president in 1998, the US has sought, in conjunction with Venezuela’s economic and political elites, to topple the Venezuelan government and re-establish its control and influence over the country and its oil wealth.

While the global situation has changed since 2020, with wars in Ukraine and the Middle East and the US’s developing aggressive strategy towards Russia and China, there is no reason to believe the US’s long-standing desire to destabilise the Venezuelan government and achieve “regime change” is off the table.

For his part, Trump made it plain when campaigning this year in North Carolina what motivated his drive to unseat Maduro: “When I left, Venezuela was ready to collapse. We would have taken it over; we would have gotten all that oil.”

The solidarity movement in Britain must be prepared to defend Venezuela’s sovereignty against any renewed offensive by Trump when he assumes the presidency in 2025 — as well as continuing to campaign for Britain to give Venezuela back its gold.

https://morningstaronline.co.uk/article/trump’s-return-threatens-renewed-assault-venezuela

Continue ReadingTrump’s return threatens renewed assault on Venezuela

US finds that Israel is not impeding assistance to Gaza

Spread the love

Original article republished from MEMO under a Creative Commons Attribution-NonCommercial-ShareAlike 4.0 International License

Palestinians wait in line to receive aids at the school where UNRWA distributes food parcels in Deir al-Balah, Gaza on November 07, 2024. [Ashraf Amra – Anadolu Agency]

President Joe Biden’s administration has concluded that Israel is not currently impeding assistance to Gaza and, therefore, is not violating US law, the State Department said on Tuesday, although Washington acknowledged the humanitarian situation remained dire in the Palestinian enclave, Reuters reports.

US Secretary of State, Antony Blinken, and Defence Secretary, Lloyd Austin, in a 13 October letter gave their Israeli counterparts a list of specific steps that Israel needs to take within the next 30 days to address the worsening situation in Gaza. Failure to do so may have possible consequences on US military aid to Israel, they said in the letter.

But, on Tuesday, the deadline mentioned in the letter, State Department deputy spokesperson, Vedant Patel, repeatedly declined to say if the specific criteria were fulfilled. Instead, he told reporters that Israel has taken steps to address the demands and that Washington would continue to assess the situation.

“We’ve seen some progress being made. We would like to see some more changes happen. We believe that had it not been for US intervention, these changes may not have ever taken place,” Patel said, adding that Washington will continue to assess Israel’s compliance with US law.

READ: UN: 85% of humanitarian aid requests to Northern Gaza blocked or delayed by Israel

International aid groups said Israel had failed to meet the series of US demands intended to improve the humanitarian crisis in Gaza by the Tuesday deadline.

Patel, fielding repeated questions from reporters in the briefing, declined to explain why Washington chose to make the assessment based on Israel’s measures to address the problems instead of actual results on the ground, which US officials have repeatedly said would be their measuring stick.

Earlier this month, the State Department said the results on the ground as of 4 November were not good enough.

On Tuesday, Patel said Israel had taken some steps, including reopening the Erez Crossing, waiving certain customs requirements and opening additional delivery routes within Gaza.

For more than a month, Israeli forces have been pushing deeper into north Gaza, surrounding hospitals and shelters and displacing new waves of people in an operation they say is designed to prevent Hamas fighters regrouping.

Biden, whose term ends soon, has offered strong backing to Israel since Hamas-led gunmen attacked Israel last October, killing 1,200 people and taking more than 250 hostages.

However, since then, it has been revealed by Haaretz that helicopters and tanks of the Israeli army had, in fact, killed many of the 1,139 soldiers and civilians claimed by Israel to have been killed by the Palestinian Resistance.

More than 43,500 Palestinians have been killed in Gaza over the past year and Gaza has been reduced to a wasteland of wrecked buildings and piles of rubble where more than 2 million Gazans seek shelter as best they can.

READ: Israel fails to meet US aid demands to ease Gaza catastrophe, aid groups say

Original article republished from MEMO under a Creative Commons Attribution-NonCommercial-ShareAlike 4.0 International License

Global Fury After State Dept Claims Israel Not Violating US Law by Blocking Gaza Aid

Current UK Prime Minister Keir Starmer is quoted that he supports Zionism without qualification. He also confirms that his active support and that of UK's air force has been essential in Israel's mass-murdering genocide. Includes URLs <a href="https://www.declassifieduk.org/keir-starmers-100-spy-flights-over-gaza-in-support-of-israel/">https://www.declassifieduk.org/keir-starmers-100-spy-flights-over-gaza-in-support-of-israel/</a> and <a href="https://youtu.be/O74hZCKKdpA">https://youtu.be/O74hZCKKdpA</a>
Current UK Prime Minister Keir Starmer is quoted that he supports Zionism without qualification. He also confirms that his active support and that of UK’s air force has been essential in Israel’s mass-murdering genocide. Includes URLs https://www.declassifieduk.org/keir-starmers-100-spy-flights-over-gaza-in-support-of-israel/ and https://youtu.be/O74hZCKKdpA
UK Foreign Secretary David Lammy says that UK is suspending 30 of 350 arms licences to Israel. He also confirms the UK government's support for Israel's Gaza genocide and the UK government and military's active participation in genocide.
UK Foreign Secretary David Lammy says that UK is suspending 30 of 350 arms licences to Israel. He also confirms the UK government’s support for Israel’s Gaza genocide and the UK government and military’s active participation in genocide.
Continue ReadingUS finds that Israel is not impeding assistance to Gaza