US President Donald Trump and Secretary of War Pete Hegseth commemorate one year of Trump’s administration. Photo: Department of War
After the illegal US military operation against Venezuela, the United States faces a crisis of legitimacy, even among its own allies.
In these early days of January, we have had to witness what hoped never to see, though it comes as no surprise: the kidnapping of a legitimate sitting president through a criminal act of aggression by the United States.
The initial bewilderment that followed in the first hours after the US military operation has given way to actions of denunciation and expressions of solidarity worldwide. These actions are a result of serious assessment in the face of an overwhelming flow of information (some accurate, others misleading or entirely false) that circulated across social media and the formal media.
Venezuela’s state and government remain intact: the National Assembly convened on January 5 and Vice President Delcy Rodríguez was sworn in as acting president.
However, dawn has not yet broken over the battlefield.
There is no room for naïve optimism. The fires still burn. The lessons are not yet learned.
The US military assault on Venezuela and kidnapping of President Nicolás Maduro and National Assembly Deputy Cilia Flores was no “surgical strike”. There is nothing surgical about deploying 150 aircraft, Delta Force units and then the entire ensemble of the US Southern Command (its electronic warfare systems capable of shutting down power and communications). This operation destroyed Venezuela’s military defense systems and other military installations across the country, as well as civilian structures (including warehouses holding medical equipment). Over a hundred Venezuelans were killed resisting the abduction, facing a military equipped with weapons systems funded by more than USD 1 trillion a year.
This is not only a display of power but also of desperation. The final resort after 25 years of failed operations to enact regime change in Venezuela. It is meant as a global warning: a message of force and issued by a power that has been unable to break Venezuela’s Bolivarian Revolution and seize control of the world’s largest oil reserves before time runs out. There is nothing new in this posture. It follows an all-to familiar script from a long history of US interventions: the coups against Jacobo Árbenz of Guatemala in 1954, João Goulart of Brazil in 1964, Juan Bosch in the Dominican Republic in 1965, Salvador Allende in Chile in 1973, and the broader coordinated terror campaign against the entire Left in Latin America through Operation Condor from 1975. Chávez knew this history. Maduro does as well. For a country with strategic resources, nothing is clearer than the need to defend sovereignty (a lesson that is well known across the Global South).
With this criminal operation (one that violates all the norms of what remains of so-called “international law”) the United States faces a crisis of legitimacy, even among its own allies. The face of imperialism is laid bare: the assertion of dominance over all others, in any hemisphere. Propelled by an overwhelming military force and the capacity to strike anywhere in the world, imperialism today goes beyond the Monroe Doctrine. Donald Trump and his ilk want everything and want to lose nothing. Here lies his fragility.
Trump has been forced to confront the absolute failure of the Venezuelan Right. He has withdrawn the fictitiousness of their right to rule and instead has had to accept the continuity of the Chavista leadership. Just as they failed to impose Juan Guaidó, they have now failed with Maria Corina Machado. To place either of them in the Miraflores presidential palace, the US troops would have had to climb the hills around the city and fight street by street against the resistance of a population unified by its hatred of a return to the oligarchy.
Faced with such US aggression, one cannot believe in a path of diplomacy necessarily based on the recognition of sovereign and equal states. The United States interprets the willingness to dialogue of our nations as signs of weakness and pounces like a starving beast. We must never forget this. Nor should we forget that they lie.
The battlefield has a military component, in which the United States have carried out a mission successfully. But it has other components (economic, political, ethical, symbolic fronts) that are contested. The protagonist of these dimensions is the Venezuelan people, mobilizing their memory, their recent history, their dignity, their victories, and their protagonism. The people mobilized under Chávez’s enduring gaze.
The role of Cuba
For Cuba, blockaded for more than 60 years and accused by the same empire of being a state sponsor of terrorism and a failed state, there is no other path than to deepen anti-imperialism.
The ties between Cuba and Venezuela were born from the admiration José Martí (1853-1895) had for Simón Bolívar (1783-1830) — that traveler who wept before the statue of the Liberator. These ties were nourished by the love between Chávez and Fidel a century later. These are not mere commercial ties forged out of the need to survive amid a blockade, though sovereign cooperation would be entirely legitimate. They are bonds of fraternity, ties between siblings in the pursuit of a socialist path, nourished by faces of the people, by thousands of Cuban professionals who have served in Venezuela, and by stories of affection, loyalty, and sacrifice born over decades.
Our countries have sustained economic relations based on trust and mutual commitment, on the exchange of oil for medical and educational services, on compensated trade relations with preferential agreements. These exchanges have diminished in recent years due to unilateral sanctions and the tightening of the blockade. A naval blockade on Venezuelan oil could mean new difficulties for that exchange, but what Cubans are talking about these days is not national economic interests, but imperialism, revolution, internationalism, commitment — words we must bring into our lives as a compass for everyday practice.
The Left is living through a moment of definition and must take its rightful place in history at this hour. We have failed to advance regional integration. We have failed to strengthen regional sovereignty by pooling our resources and strengths. We have failed to deepen our understanding of one another’s struggles and the differences in our national realities. And in the face of this, there has always been an empire (today more voracious and soulless, but the same as ever).
Cubans condemn the US military aggression against Venezuela and the threats against the countries of the region, and we firmly condemn the kidnapping of Maduro and Flores and demand their release. In defending the Proclamation approved at the II CELAC Summit that recognizes our region as a Zone of Peace, we defend peace with sincerity. Our anger today does not translate into hatred, but carries the history of the victory over mercenary troops at Girón, the October Crisis, resistance to acts of state terrorism and to a blockade that was already 40 years old when formal fraternal relations with Venezuela began.
Today, the Cuban people mourn 32 sons of a country that only wants to work to live better along the path it has chosen. They are so aware that no people can confront the threats now being launched against Mexico, Cuba, Colombia, and Greenland alone. Only united can we stop a powerful fascist who has no morality or ethics other than dispossession and unpunished criminality, who feels entitled to every part of the world that interests them and endowed with the right and the power to destroy the part of the world they can do without.
Llanisca Lugo González is a member of the No Cold War Collective, is a researcher and the Antonio Gramsci Chair at the Instituto Juan Marinello, Havana, Cuba. She is a Deputy in the National Assembly of Cuba.
Elon Musk urges you to be a Fascist like him, says that you can ignore facts and reality then.Donald Fuhrump says that Amerikkka doesn’t bother with crimes or charges anymore, not being 100% Amerikkkan and opposing his real estate intentions is enough.Orcas discuss how Trump was re-elected and him being an obviously insane, xenophobic Fascist.
The year 2025 was in the top-three warmest years on record, with average surface temperatures reaching around 1.44C above pre-industrial levels across eight independent datasets.
The different temperature records confirm that last year was either the second or third warmest since observations began in the mid-1800s, with razor-thin margins between 2025 and 2023.
Last year also set a new record for ocean heat content, with the oceans absorbing more than 90% of the heat trapped by increasing greenhouse gas concentrations in the atmosphere.
Here, Carbon Brief examines the latest data across the Earth’s oceans, atmosphere, cryosphere and surface temperature. (Use the links below to navigate between sections.)
Noteworthy findings from this 2025 review include…
Ocean heat content: It was the warmest year on record for ocean heat content and one of the largest year-over-year increases in ocean heat content. In 2025, the oceans added 39 times more heat than all annual human energy use.
Global surface temperatures:The year 2025 is effectively tied with 2023 as the second-warmest year on record – coming in at between 1.33C and 1.53C above pre-industrial levels across different temperature datasets and 1.44C in the synthesis of all groups.
Second warmest over land: Global temperatures over the world’s land regions – where humans live and primarily experience climate impacts – were 2C above pre-industrial levels, just below the record set in 2024.
Third warmest over oceans: Global sea surface temperatures were 1C above pre-industrial levels, dropping from 2024 record levels due to fading El Niño conditions.
Regional warming: It was the warmest year on record in areas where, collectively, more than 9% of the global population lives.
Unusual warmth: The exceptionally warm, record-setting temperatures over the past three years (2023-25) were driven by continued increases in human emissions of greenhouse gases, reductions in planet-cooling sulphur dioxide aerosols, variability related to a strong El Niño event and a strong peak in the 11-year solar cycle.
Greenhouse gases: Concentrations reached record levels for carbon dioxide (CO2), methane and nitrous oxide.
Sea ice extent: Arctic sea ice saw its lowest winter peak on record as well as its 10th-lowest summer minimum extent, while Antarctic sea ice saw its third-lowest minimum extent.
Looking ahead to 2026: Carbon Brief predicts that global average surface temperatures in 2026 are likely to be between the second and fourth warmest on record, similar to 2023 and 2025, at around 1.4C above pre-industrial levels.
Ocean heat content sets a new record
The year 2025 was the warmest on record for the heat content of the world’s oceans.
Ocean heat content (OHC) increased by around 500 zettajoules – billion trillion joules – since the 1940s.
The heat increase in 2025 alone compared to 2024 – about 23 zettajoules – is around 39 times as much as the total energy produced by all human activities on Earth in 2023 (the latest year in which global primary energy statistics are available). It was also the largest increase in ocean heat content since 2017 (following the strong El Niño event of 2016).
Human-emitted greenhouse gases trap extra heat in the atmosphere. While some of this warms the Earth’s surface, the vast majority – around of 93% – goes into the oceans. About two-thirds of this accumulates in the top 700 metres, but some also ends up in the deep oceans.
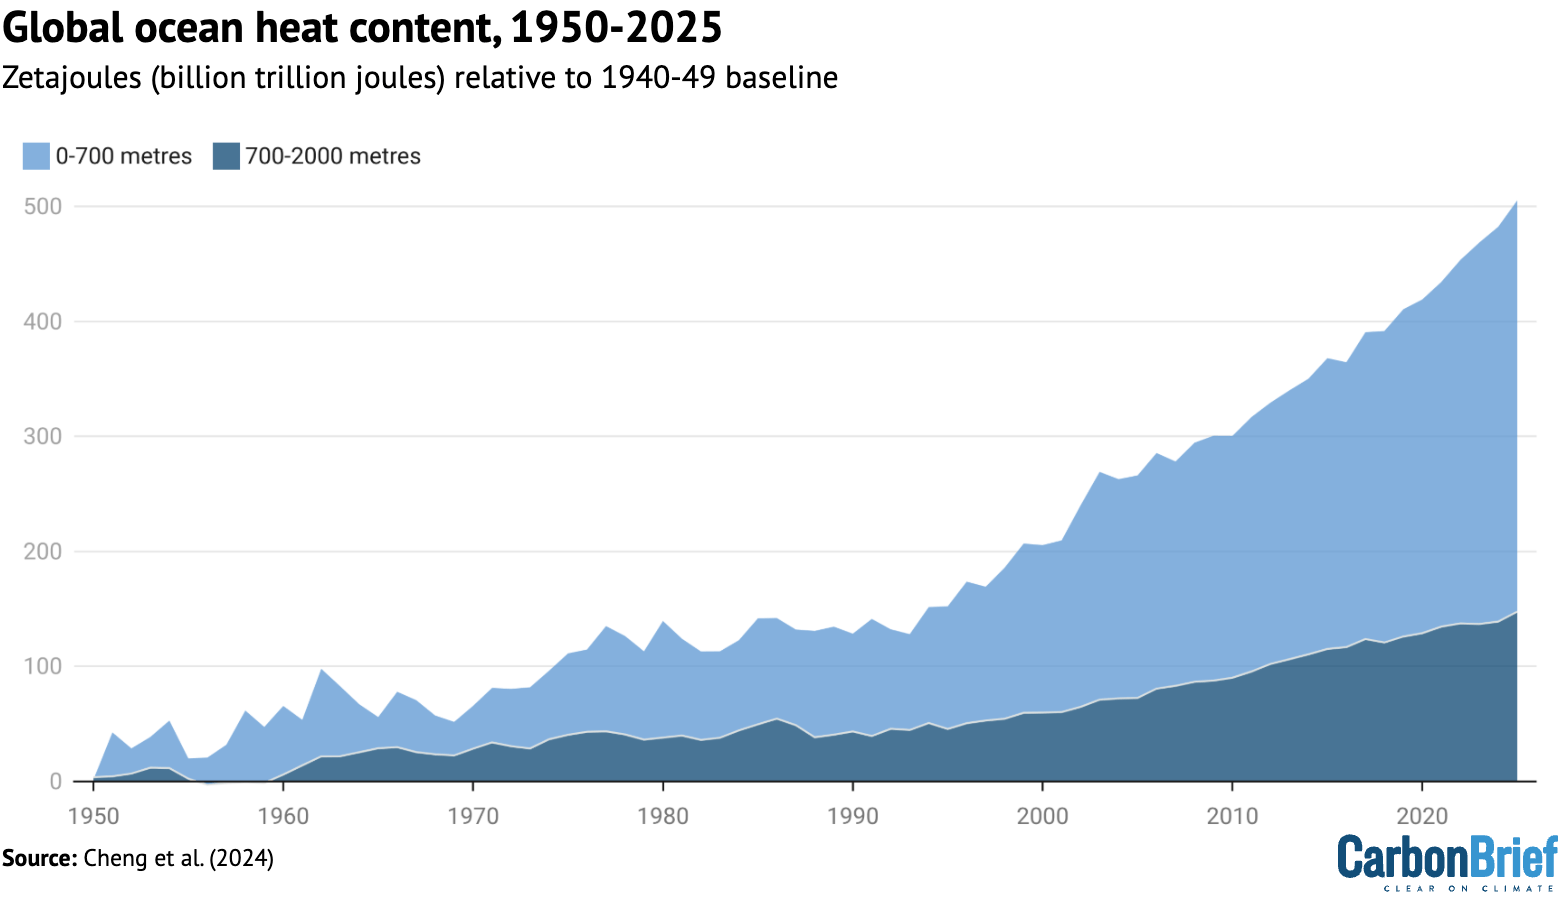
The figure below shows annual OHC estimates from the Chinese Institute for Atmospheric Physics (IAP) between 1950 and present for the upper 700 metres (light blue shading) and 700-2,000 metres (dark blue) of the ocean.
Annual global ocean heat content (in zettajoules – billion trillion joules, or 10^21 joules) for the 0-700 metre and 700-2,000 metre layers. Data updated from Cheng et al. (2024). Chart by Carbon Brief.
In a new paper published last week, researchers found that the rate of OHC increase over the past 15 years is unprecedented over the observational record in the IAP dataset. More broadly, there has been a distinct acceleration in OHC after 1991 – and recent OHC growth rates are generally consistent with satellite measurements of Earth energy imbalance (EEI).
(Energy imbalance is a measure of how much surplus heat there is in the Earth’s climate system. It is the difference between how much energy enters Earth’s atmosphere from the sun and how excess heat is radiated back into space as the world warms.)
In many ways, OHC represents a much better measure of climate change than global average surface temperatures, because it is where most of the extra heat ends up and is much less variable on a year-to-year basis than surface temperatures.
The analysis reveals that global surface temperatures were between the second and third warmest since records began in the mid-1800s. Temperatures effectively tied with 2023 within the margin of uncertainty, below the record set last year in 2024.
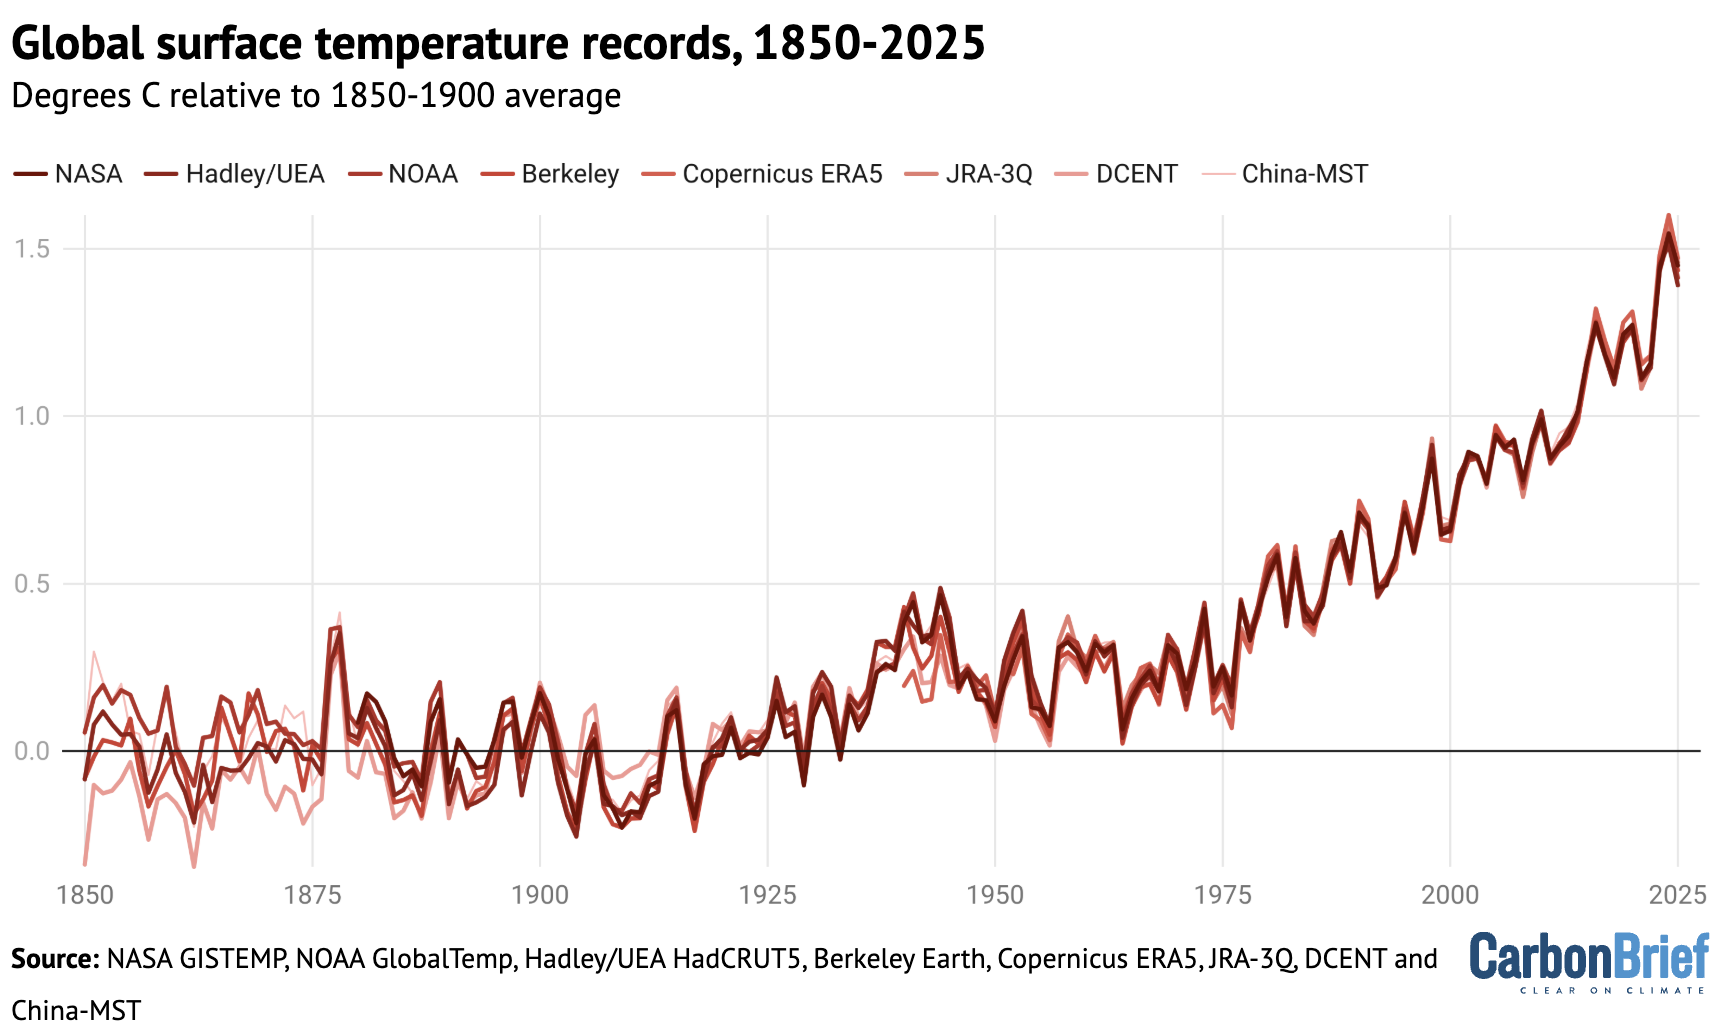
The figure below shows global surface temperature records from the eight datasets.
Global surface temperature records can be calculated back to 1850, though some groups such as NASA GISTEMP choose to start their records in 1880 when more data was available.
Prior to 1850, records exist for some specific regions, but are not sufficiently widespread to calculate global temperatures with high accuracy (though newly published research has attempted to extend this back to 1781).
These longer surface temperature records are created by combining ship- and buoy-based measurements of ocean sea surface temperatures with temperature readings of the surface air temperature from weather stations on land. (Copernicus ERA5 and JRA-3Q are an exception, as they use weather model-based reanalysis to combine lots of different data sources over time.)
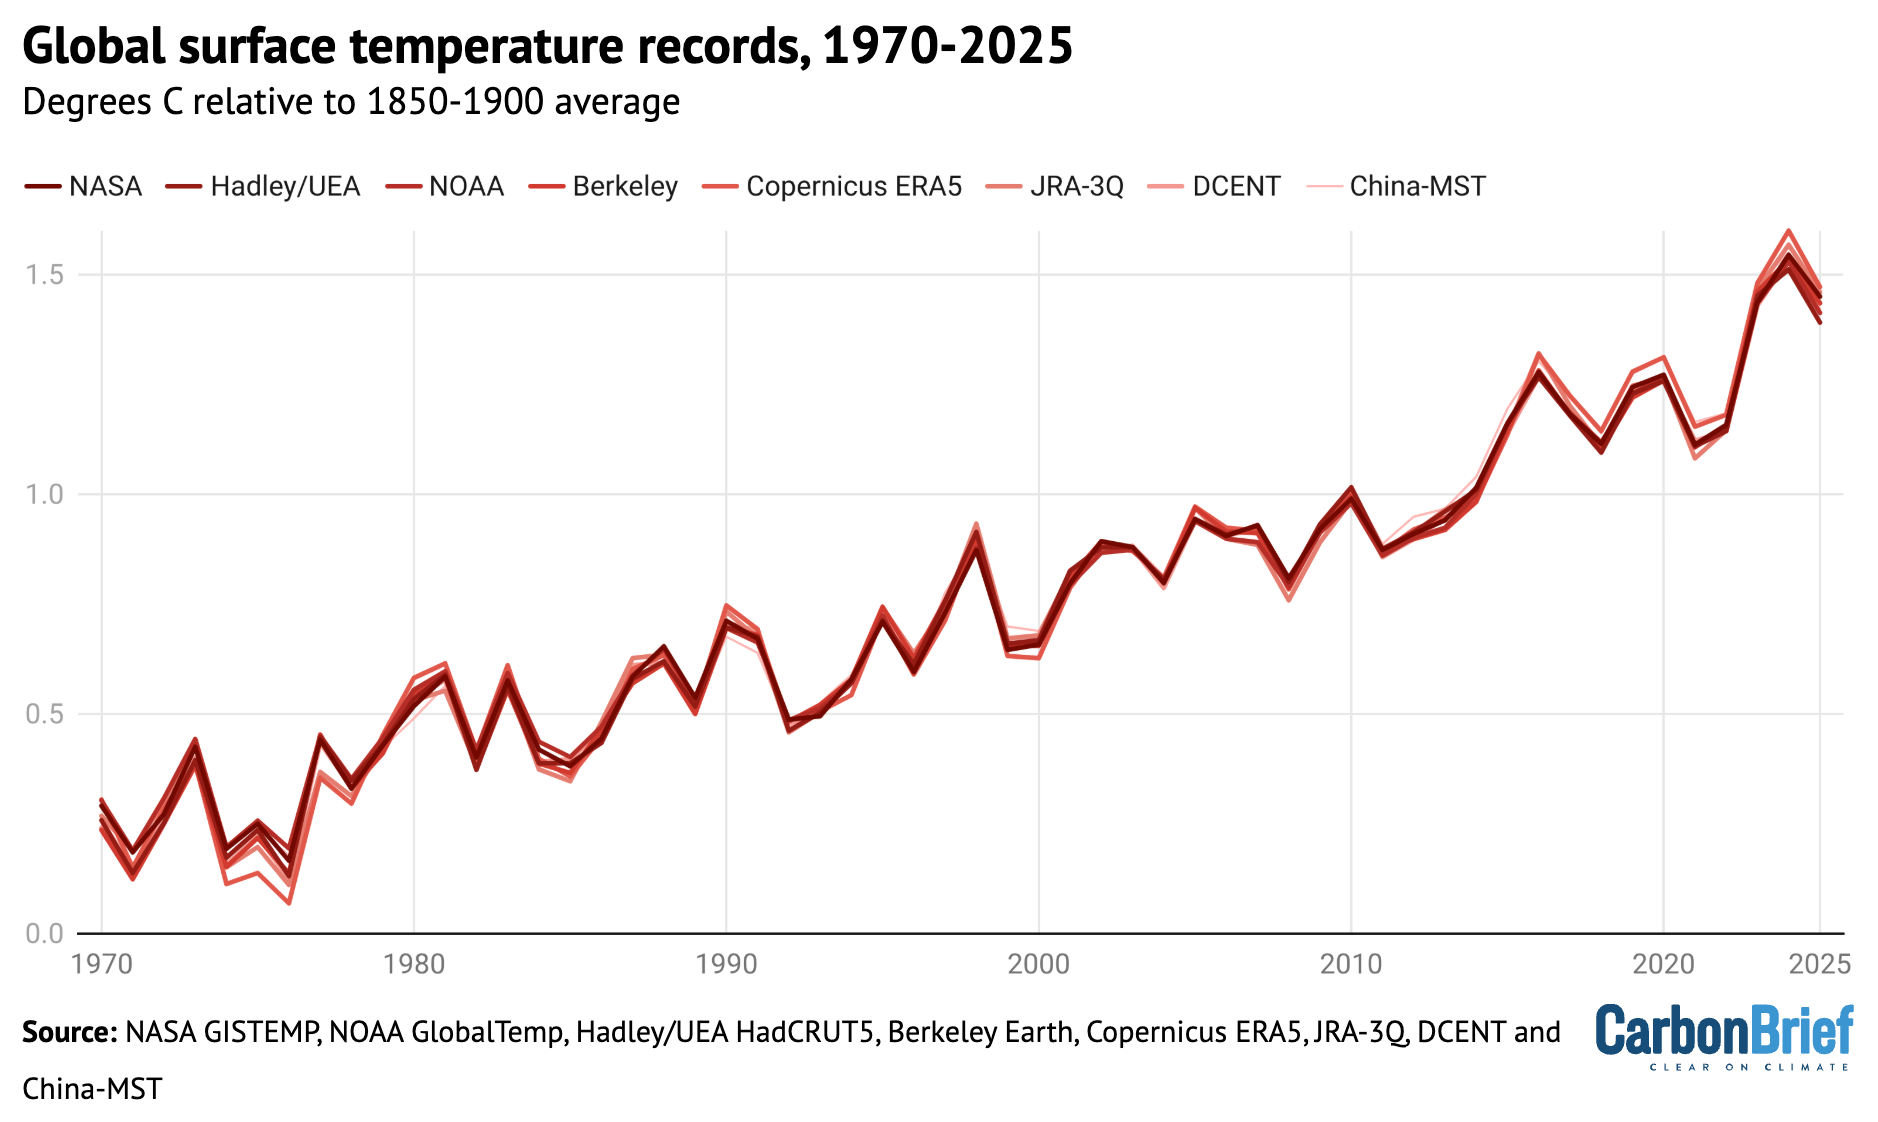
Some differences between temperature records are apparent early in the record, particularly prior to 1900 when observations are more sparse and results are more sensitive to how different groups fill in the gaps between observations. However, there is strong agreement between the different temperature records for the period since 1970, as shown in the figure below.
Annual global average surface temperatures as in the prior chart, but showing the period from 1970-2025. Chart by Carbon Brief.
Global temperatures over the past three years clearly stand out as much warmer than anything that has come before, well above the prior record set in 2016. More broadly, the 11 warmest years on record all happened in the past 11 years.
Two of the eight datasets analysed by Carbon Brief – NASA and DCENT – had 2025 as the second-warmest year behind 2024, while six of the datasets had 2025 as the third-warmest year behind both 2023 and 2024.
However, in nearly all cases the difference between 2023 and 2025 falls within each dataset’s published uncertainty range, making it effectively a tie between the two years.
The table below shows the reported 2025 global temperature anomalies (relative to each group’s 1850-1900 pre-industrial baseline), as well as a 2025 value using a common pre-industrial baseline between the 1850-1900 and 1981-2010 periods across the five groups with data back to 1850 (NOAA, Hadley/UEA, Berkeley Earth, DCENT and China-MST).
Dataset
2025 Reported
2025 With common baseline
Ranking
NASA GISTEMP
1.39
1.45
Second
Hadley/UEA HadCRUT5
1.41
1.39
Third
NOAA GlobalTemp
1.33
1.41
Third
Berkeley Earth
1.44
1.44
Third
Copernicus ERA5
1.47
1.47
Third
JRA-3Q
1.46
1.46
Third
DCENT
1.53
1.44
Second
China-MST
1.39
1.42
Third
Reported temperature anomalies range from as low as 1.33C (NOAA) to as high as 1.53C (DCENT), primarily reflecting differences in the early part of the record. The 2025 values with a common baseline have a much smaller range, from 1.41C (NOAA) to 1.47C (Copernicus).
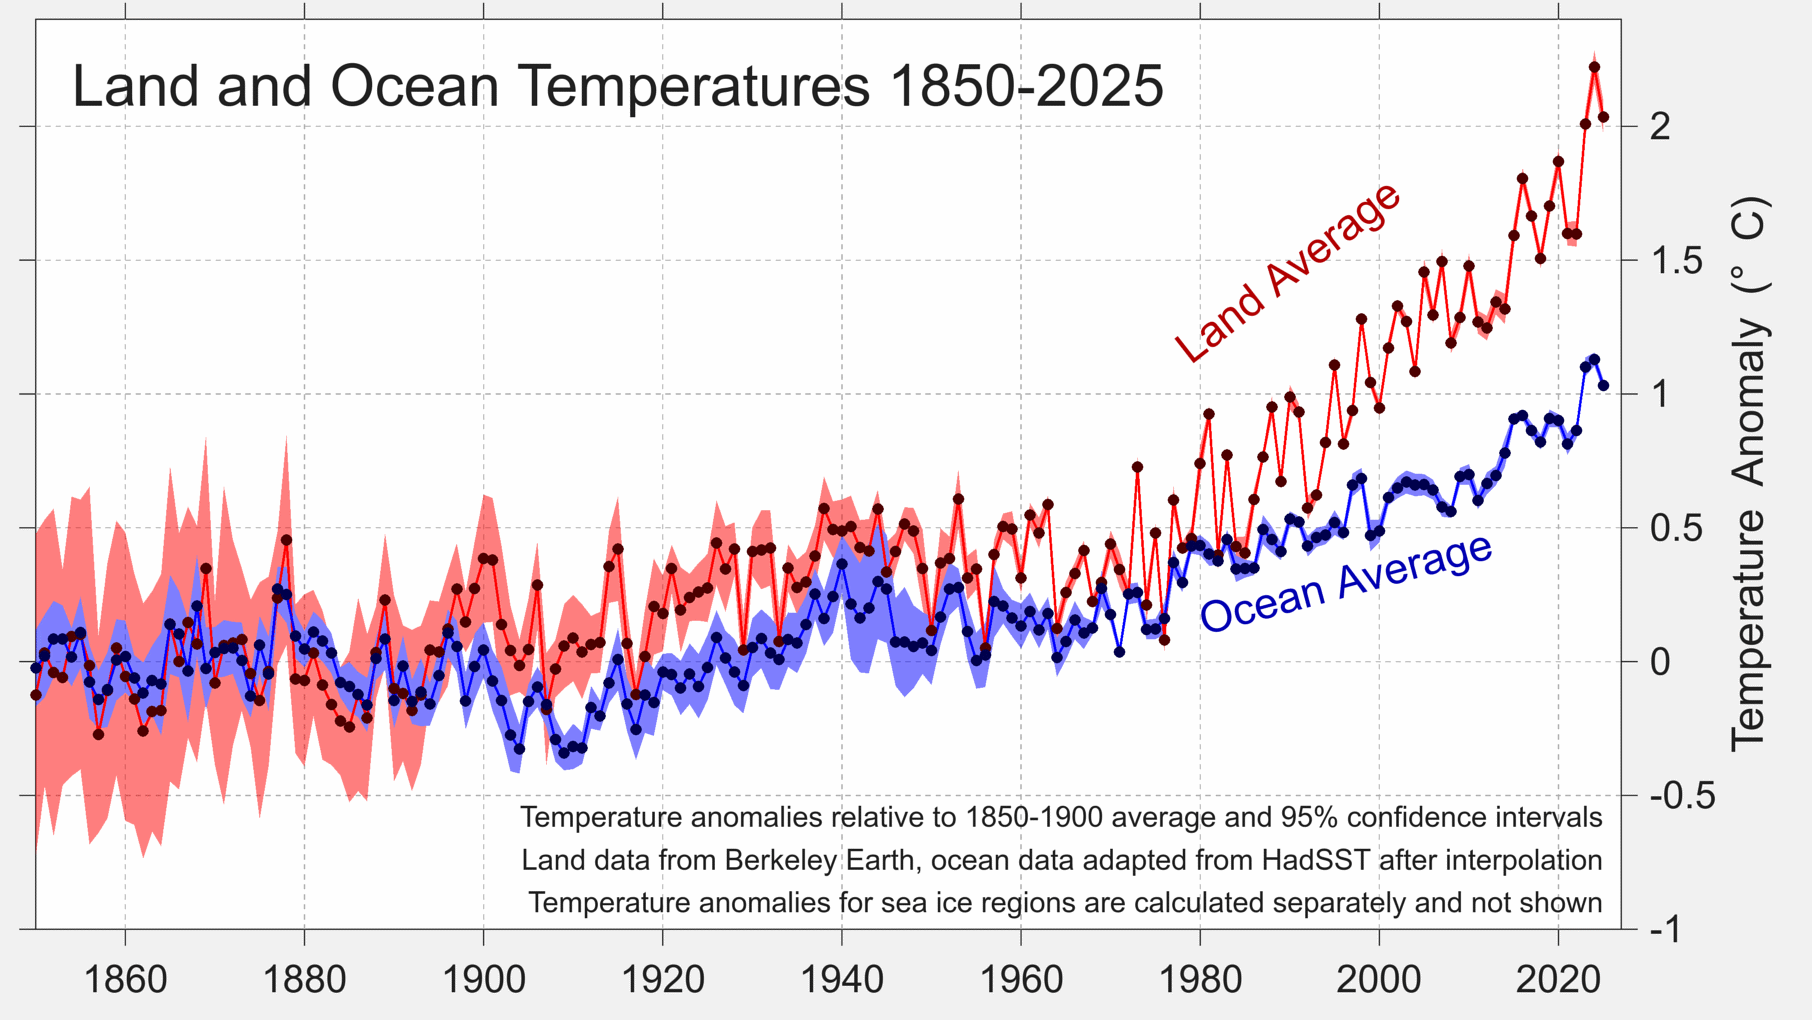
Separate land and ocean temperatures are not available yet from all of these groups. However, Berkeley Earth reports that global land temperatures in 2025 were the second warmest on record, at 2.03C above pre-industrial levels, while ocean temperatures were the third warmest at 1.03C.
Land and ocean temperature rise since the pre-industrial 1850-1900 period. Figure from Berkeley Earth.
Global land regions – where the global human population lives – has generally been warming around 70% faster than the oceans and 40% faster than the global average since 1970.
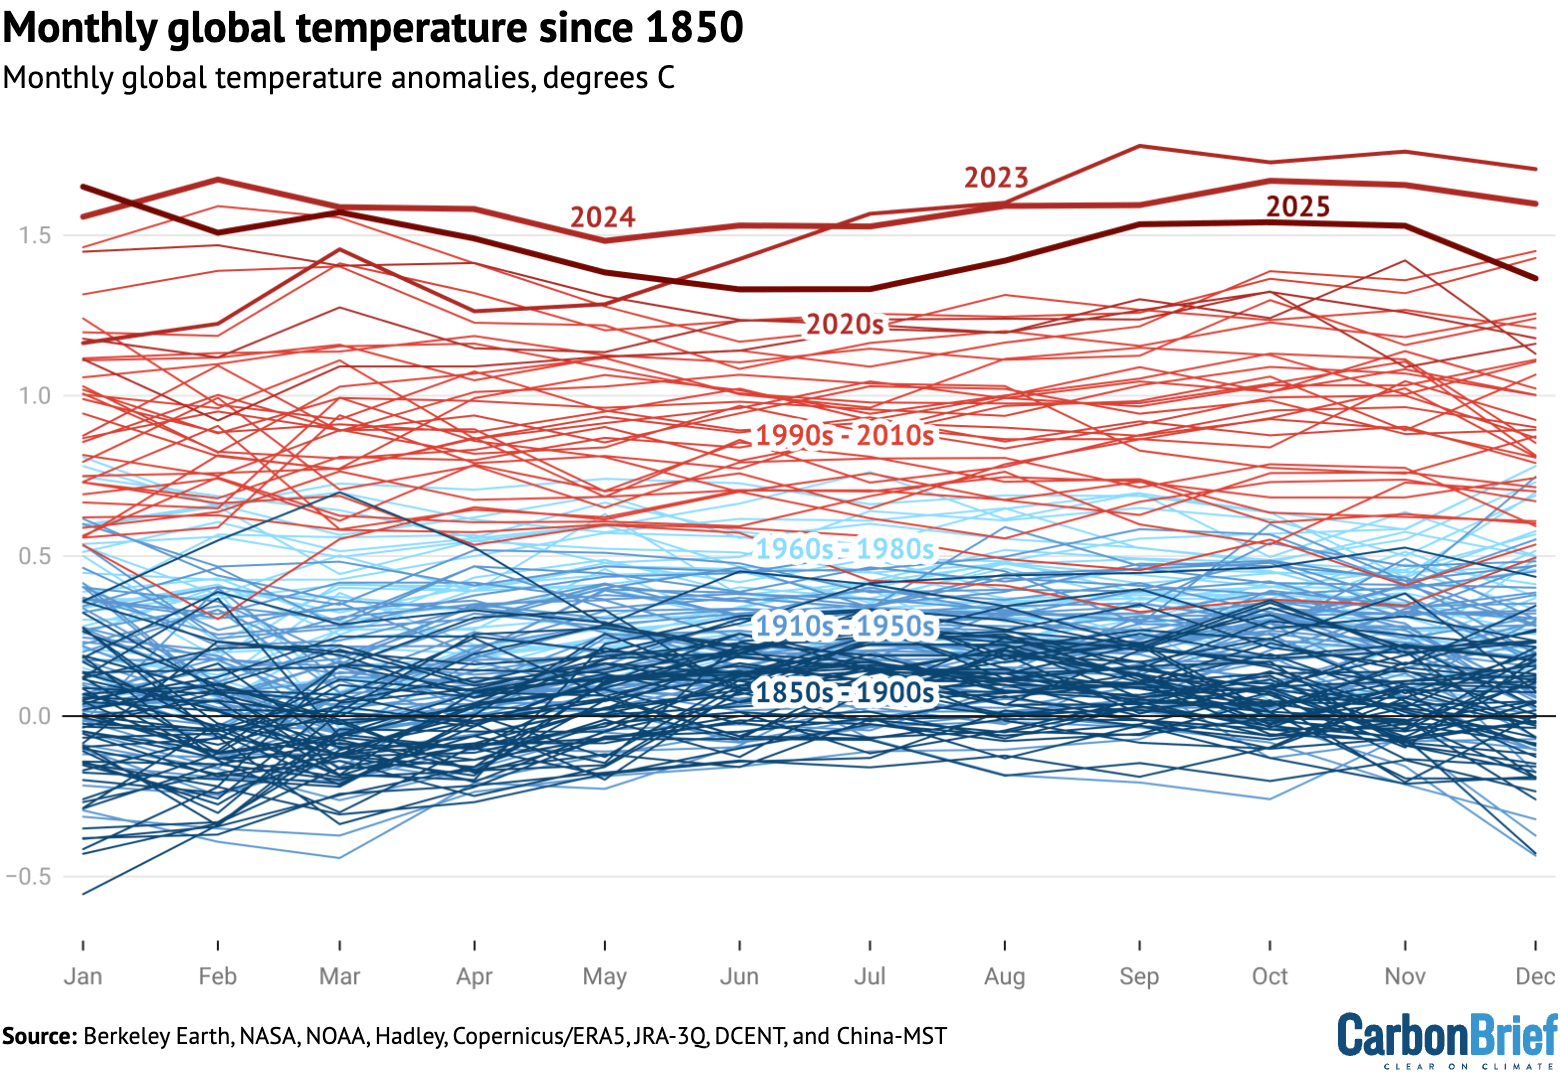
The year started off quite hot, with January 2025 setting a new record as the warmest January. All other months of the year ended up being either the second or third warmest on record after 2024 and 2023.
The figure below shows each month of 2025 in dark red, compared to all prior years since 1850. Each year is coloured based on the decade in which it occurred, with the clear warming over time visible, as well as the margin by which both 2023, 2024 and 2025 exceeded past years.
Monthly global surface temperatures for each year since 1850, using the average of the eight different temperature datasets assessed by Carbon Brief. Anomalies are shown relative to the pre-industrial 1850-1900 period.
Extreme regional temperatures
While the globe as a whole was tied as the second warmest on record, many different regions of the planet set new records in 2025.
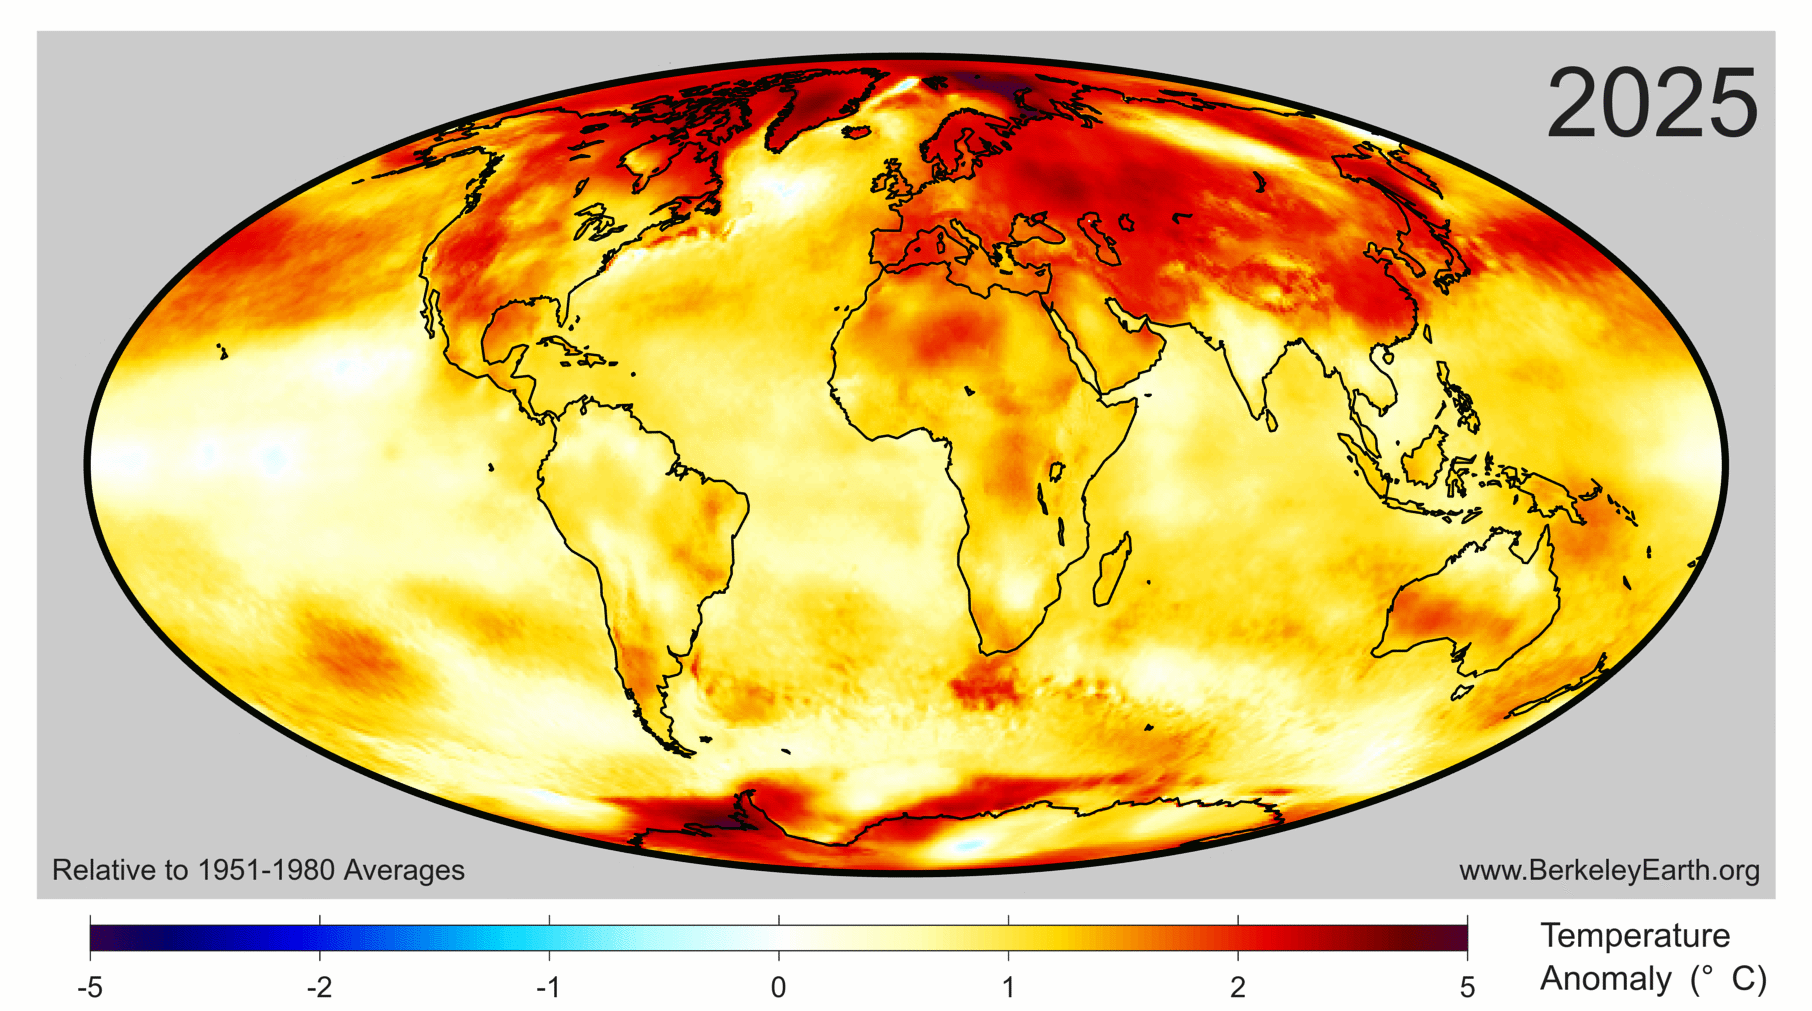
The figure below shows how global temperature deviated from the average in 2025 across the world. Areas shaded in red were warmer than the baseline period (1951-80) used by Berkeley Earth, whereas the few blue areas experienced cooler temperatures.
Collectively, approximately 770 million people – 9.3% of Earth’s population – live in places that experienced their warmest year on record in 2025. This was mostly concentrated in Asia, including around 450 million people in China.
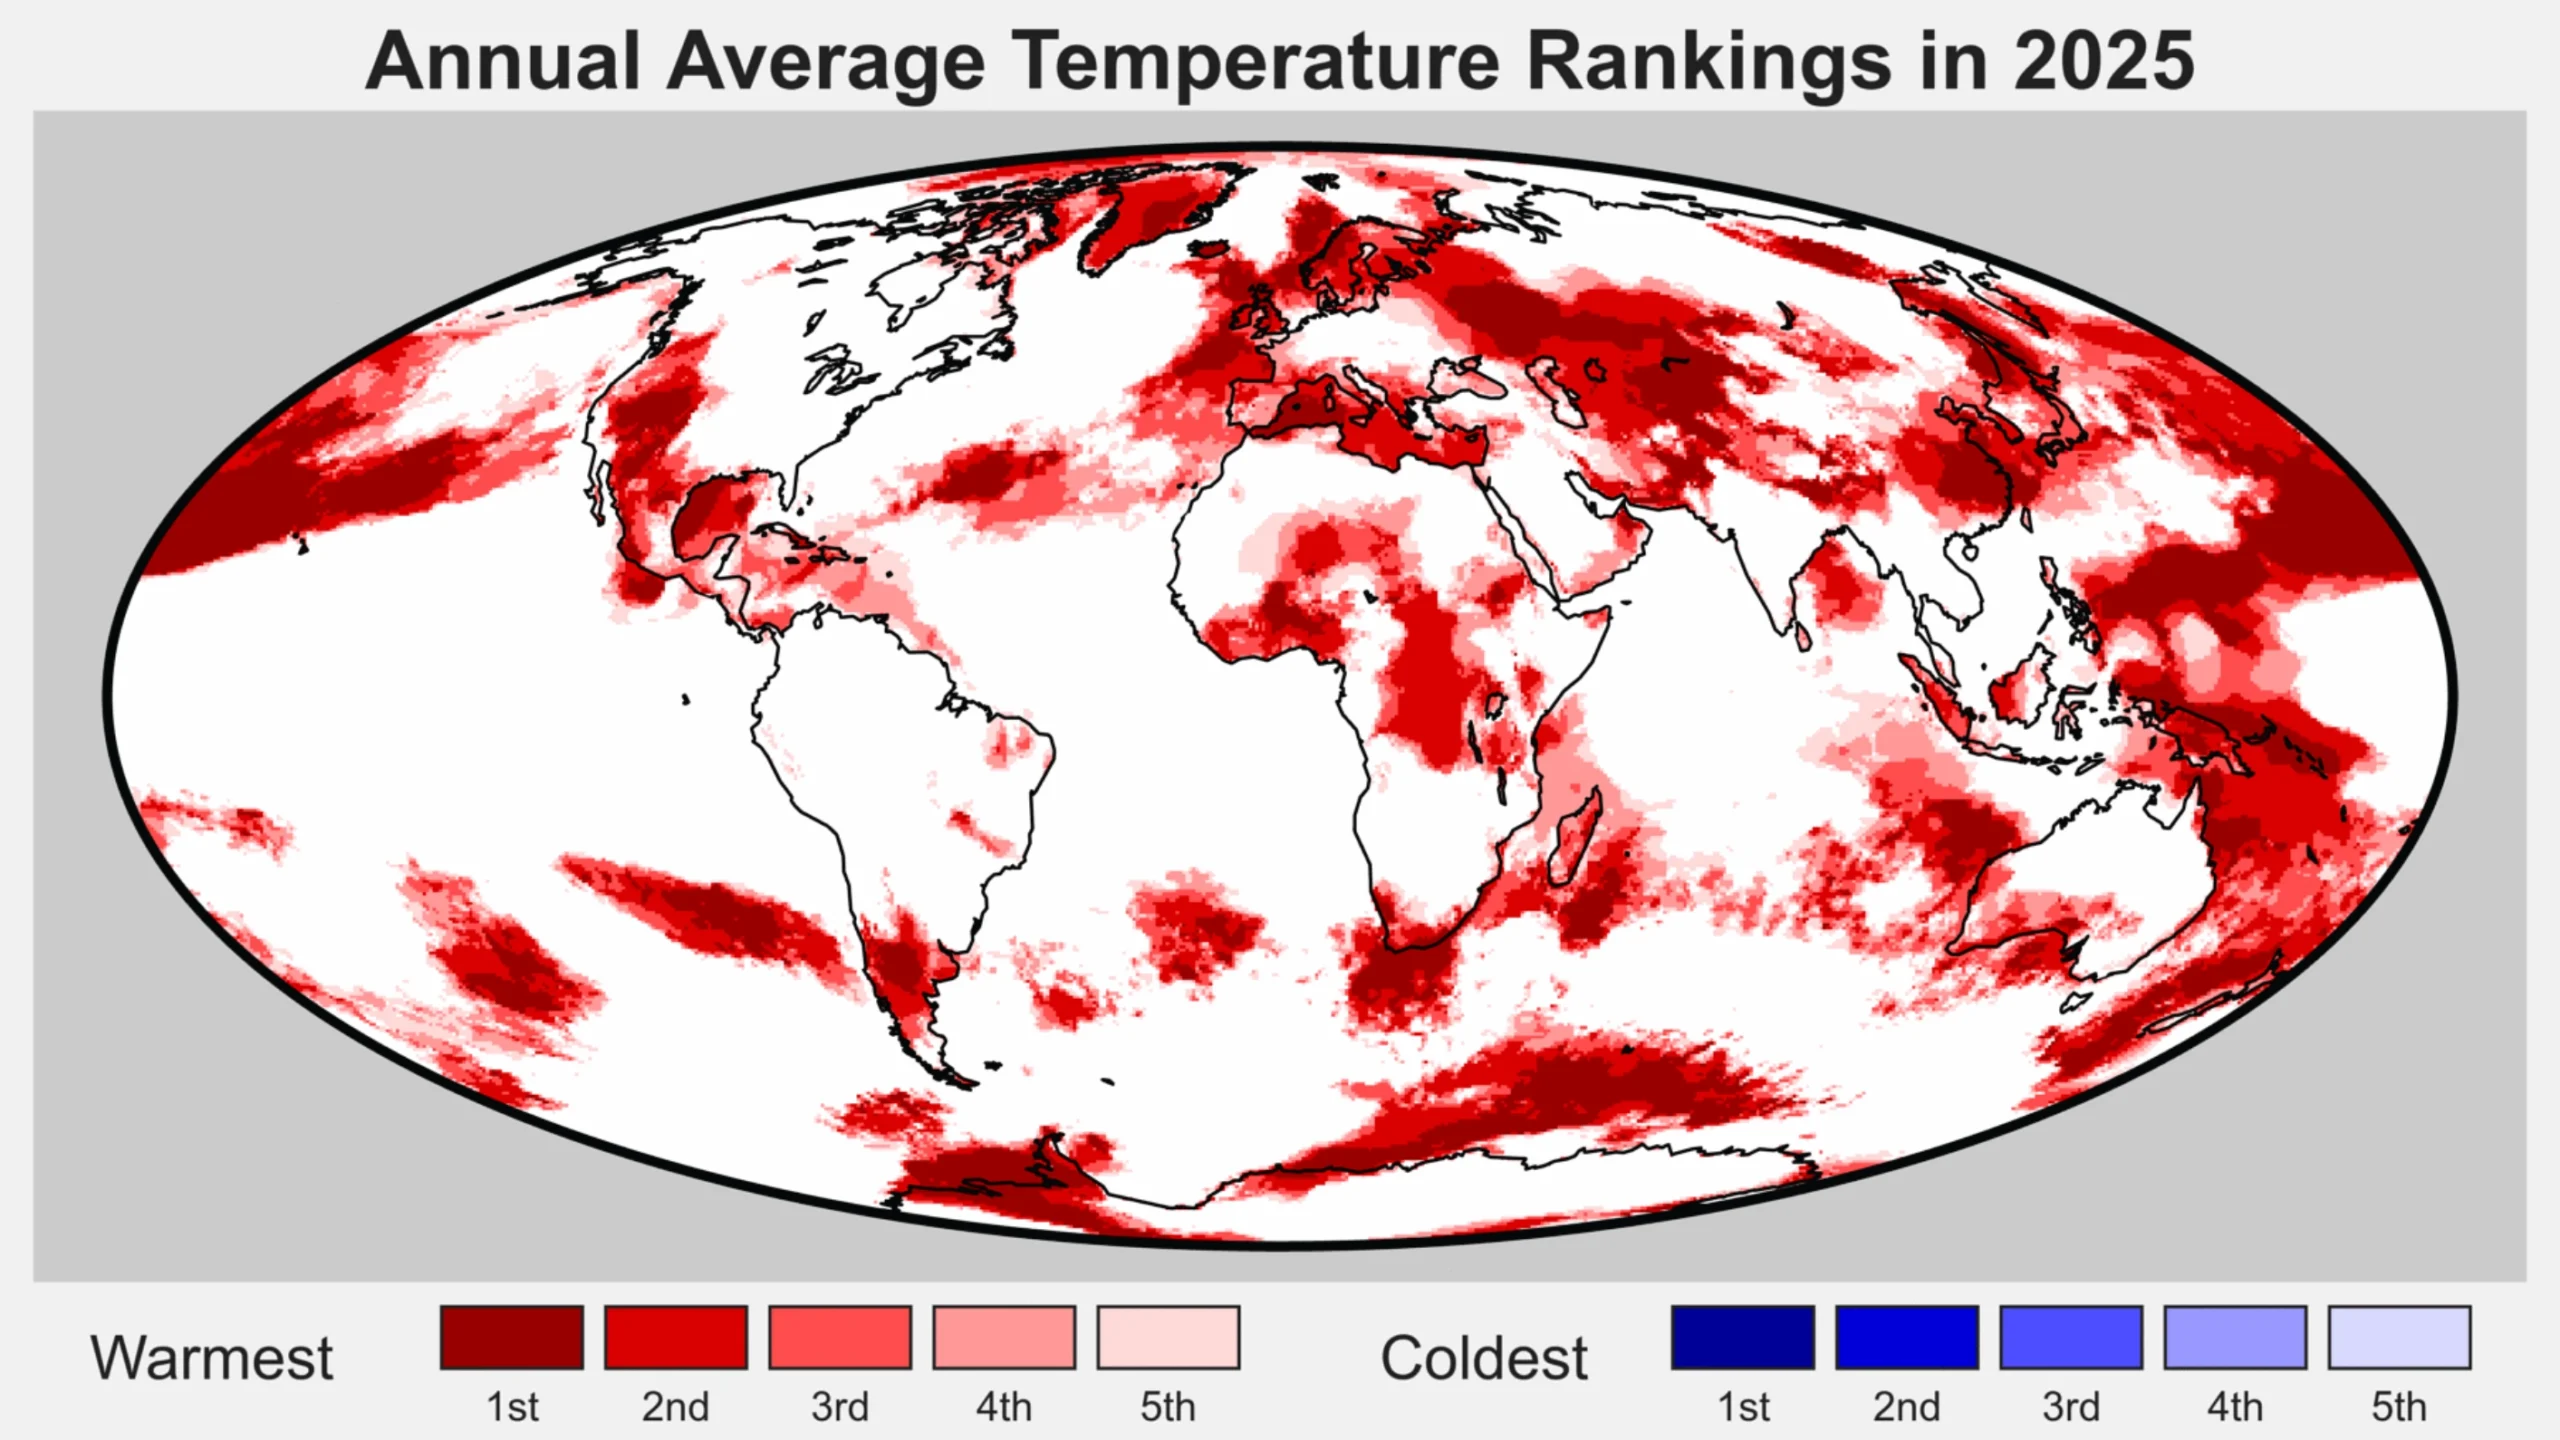
The figure below highlights regions of the planet that experienced their top-five warmest (red shading) or coldest (blue) temperatures on record in 2025. Overall, around 9% of the planet set a new record, including 11% of the land and 8% of the ocean. No location on the planet experienced record cold temperatures – or even top-five record cold temperatures – for the year as a whole.
Regions of the world among the five warmest (reds) of five coolest (blues) on record for average annual temperatures in 2025. Figure from Berkeley Earth.
Drivers of recent record warmth
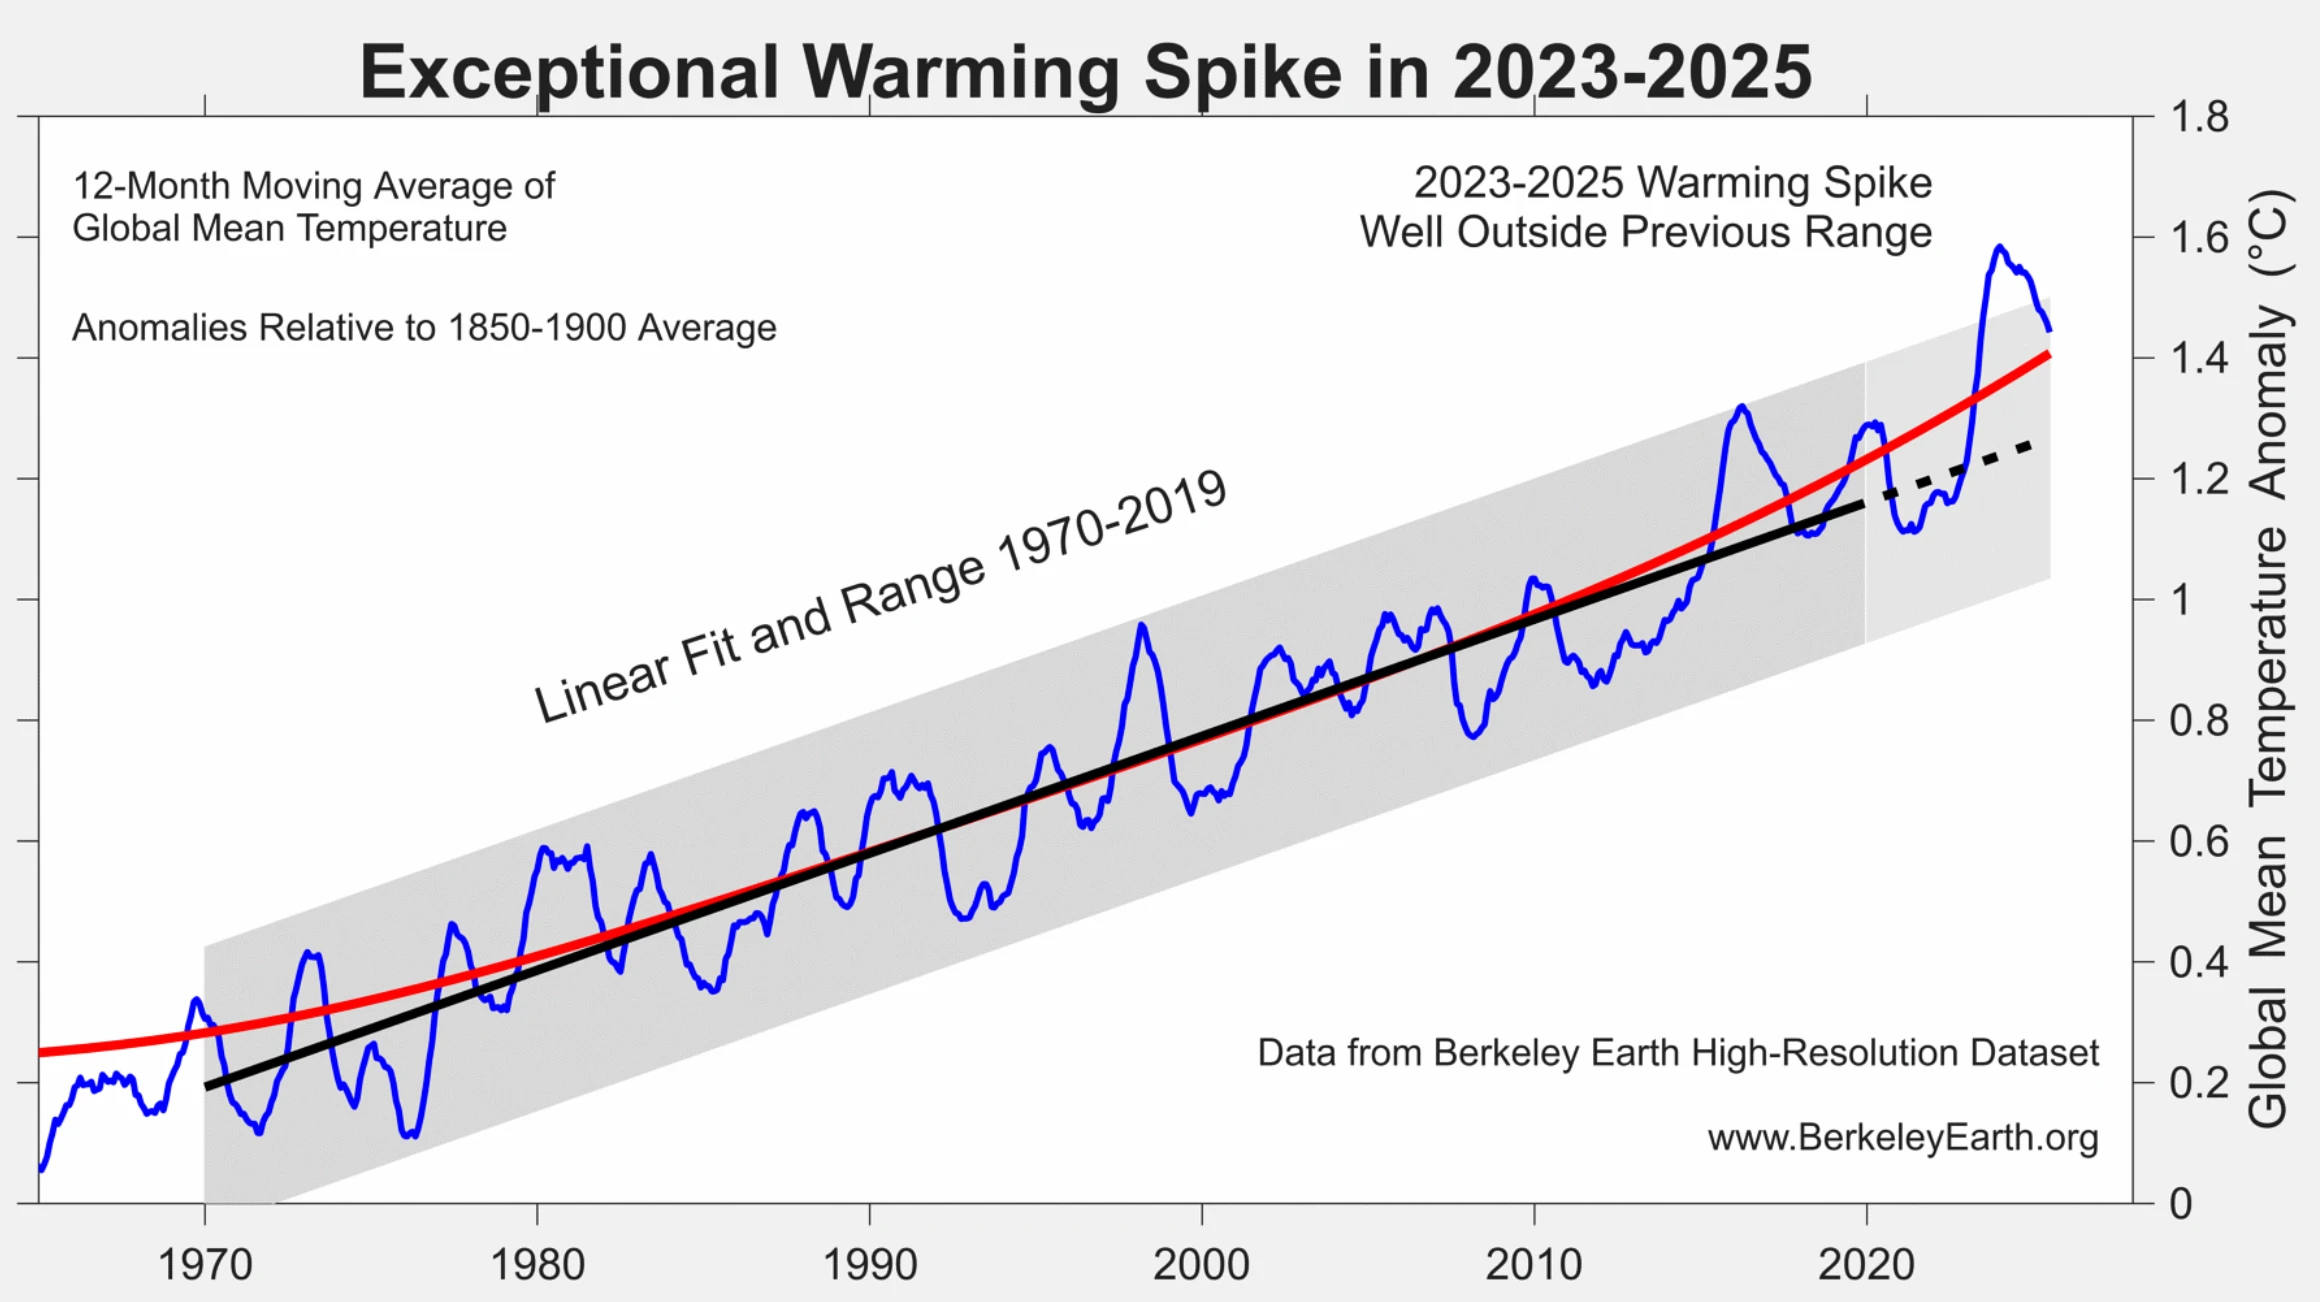
Global temperatures over the past three years have been unusually warm, well above what would be expected given the long-term warming trend of around 0.2C per decade since the 1970s.
Recent research has found that global warming has accelerated in recent years to around 0.27C per decade, though this acceleration is largely in-line with climate model projections under scenarios where greenhouse gas emissions continue to rise while emissions of planet cooling aerosols are reduced.
According to analysis from Berkeley Earth, the odds of global temperatures over 2023-25 occurring as a result of greenhouse gas emissions and natural variations in the Earth’s climate alone “is less than one-in-100” and “likely indicates that recent years have been impacted by additional warming factor(s)”.
The figure below shows how the exceptional warming spike of 2023-25 compares to the longer-term warming trend and historical climate variability.
Global surface temperatures between 1965 and 2025 (blue) along with the linear trend (black) and range (grey) from 1970-2019. The red line shows a locally linear regression that captures recent acceleration. Figure from Berkeley Earth.
Carbon Brief recently explored the drivers of recent warmth in more detail, finding that it is likely to have been driven by a combination of:
A strong El Niño event that developed in the latter part of 2023.
An unusual volcanic eruption in Tonga in 2022 that put a large amount of aerosols and water vapor into the upper atmosphere.
A stronger-than-expected solar cycle.
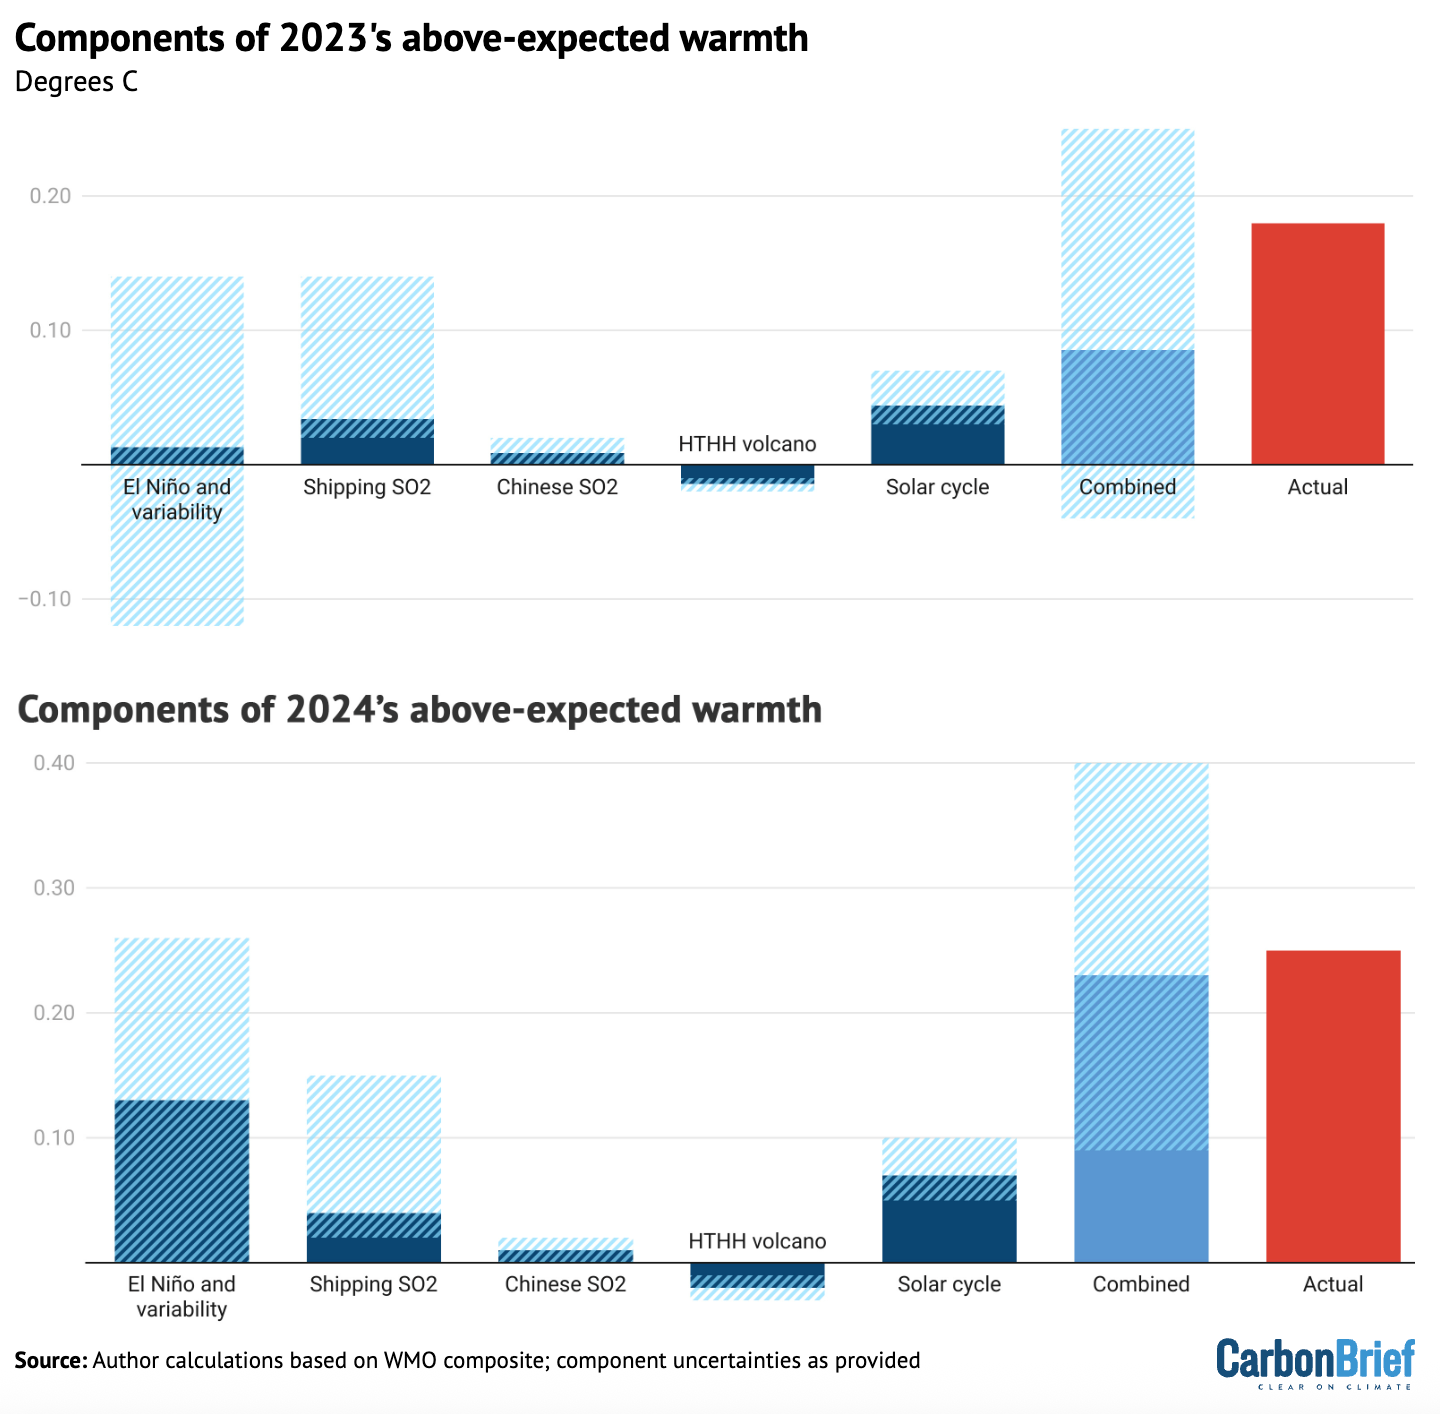
This is illustrated in the figure below, which provides an estimate of the impact of each of these different factors on 2023 and 2024 temperatures, along with their respective uncertainties.
The sum of all the factors is shown in the “combined” bar, while the actual warming compared to expectations is shown in red. The upper chart shows 2023, while the lower one shows 2024.
Attribution of 2023 and 2024 unusual warmth. Light blue bars show individual factors and their uncertainties, the dark blue bar shows the combined effects and combination of uncertainties and the red bar shows the actual warming compared with expectations. HTHH refers to the Hunga Tonga-Hunga Ha’apai volcano. Adapted from Figure 12 in WMO’s state of the global climate 2024 report.
The first bar includes both El Niño and natural year-to-year climate variability; the height of the bar reflects the best estimate of El Niño’s effects, while the uncertainty range encompasses year-to-year variability in global temperatures that may be – at least in part – unrelated to El Niño.
While a similar analysis has yet to be undertaken for 2025, the end of El Nino conditions and the development of a modest La Nina would have driven temperatures down, while the warming impact of shipping, Chinese aerosol declines would have slightly increased. The warming effect of the solar cycle would likely have remained flat or slightly declined as solar cycle 25 passed its peak.
Finally, a World Meteorological Organization (WMO) assessment of the Hunga Tonga-Hunga Ha’apai volcano found that “the record-high global surface temperatures in 2023-24 were not due to the Hunga eruption”.
The report suggested that the volcano had a small cooling effect (-0.03C) globally in 2023 and 2024. This might switch to a small warming effect (+0.03C) in 2025 and 2026 as the planet-cooling aerosols from the volcano fall back down to the surface but some of the stratospheric water vapour remains, it noted.
However, it added, these effects are “indistinguishable from background variability in the current climate”.
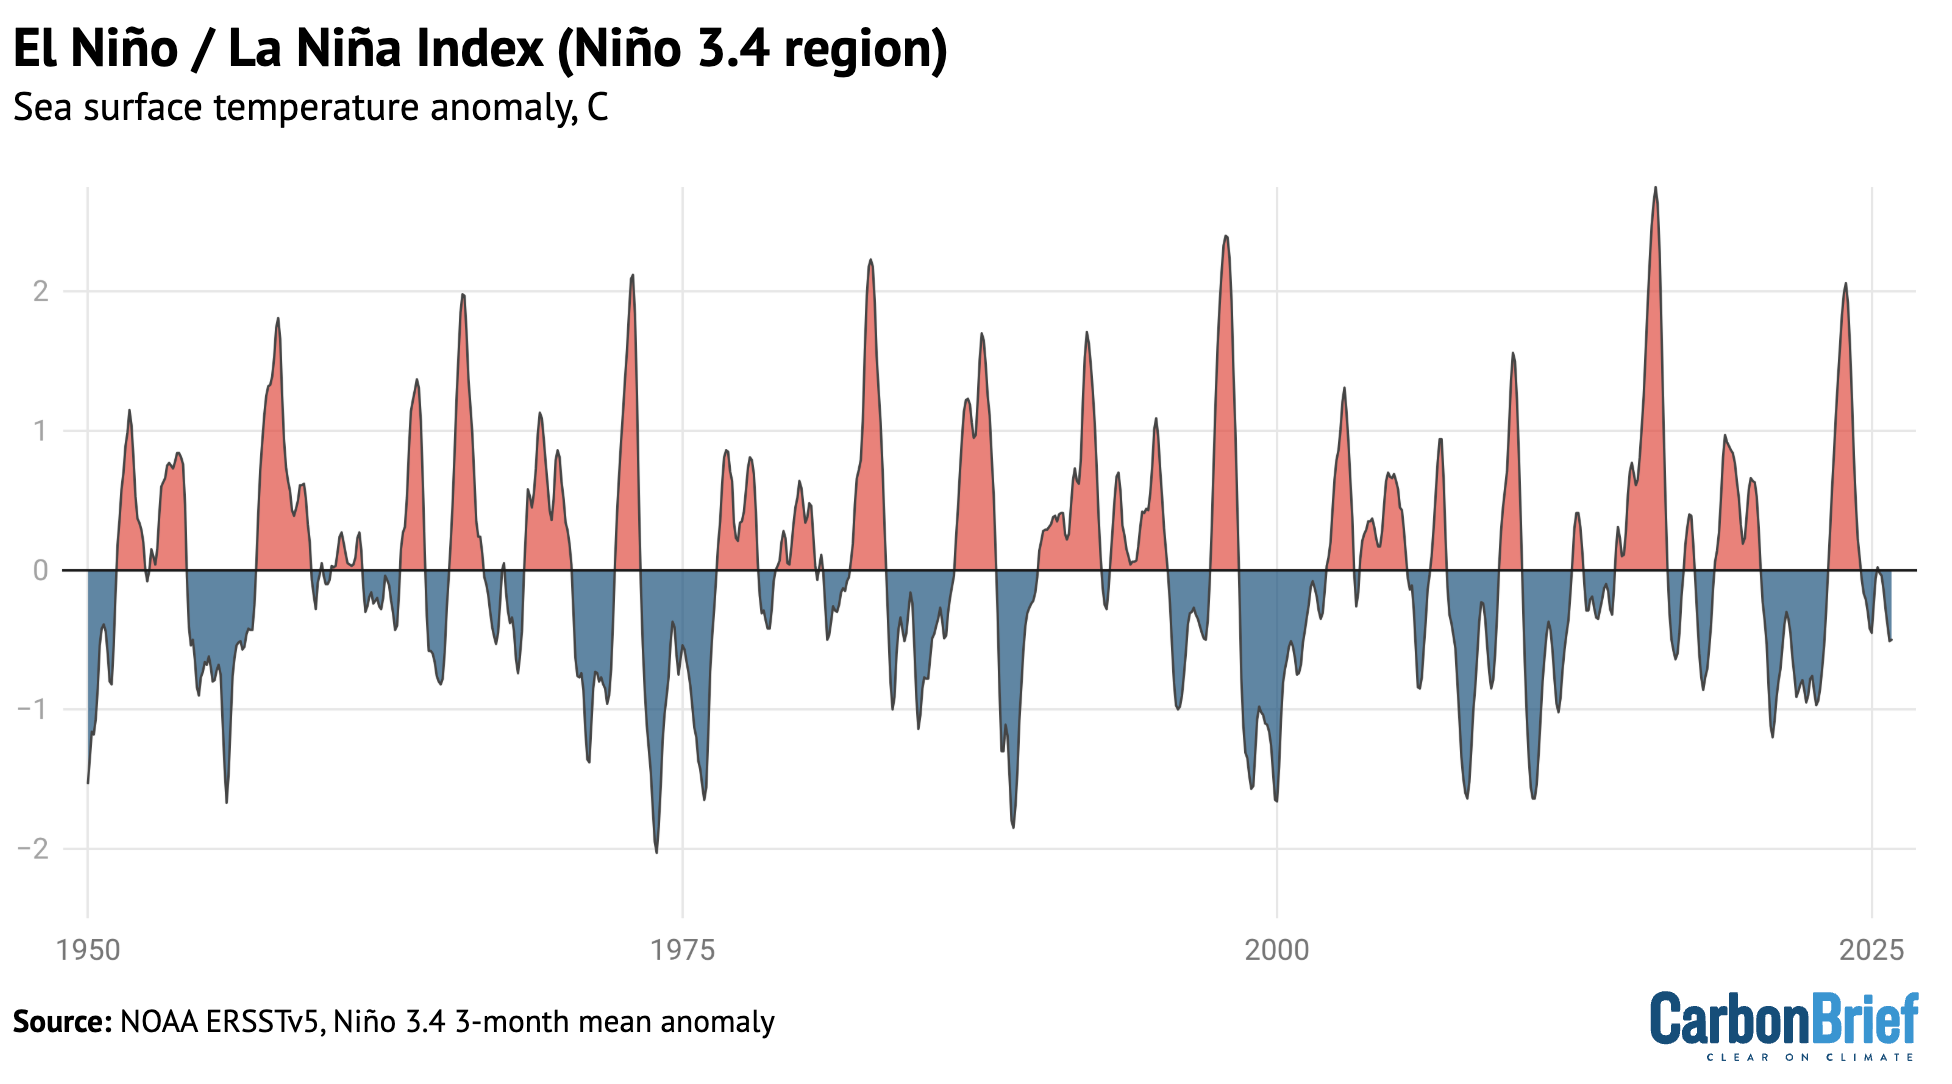
El Niño and La Niña are generally the largest drivers of year-to-year variability in global temperatures. The figure below shows the El Niño (red shading) and La Niña (blue) conditions over the past 40 years (collectively referred to as the El Niño-Southern Oscillation, or “ENSO”).
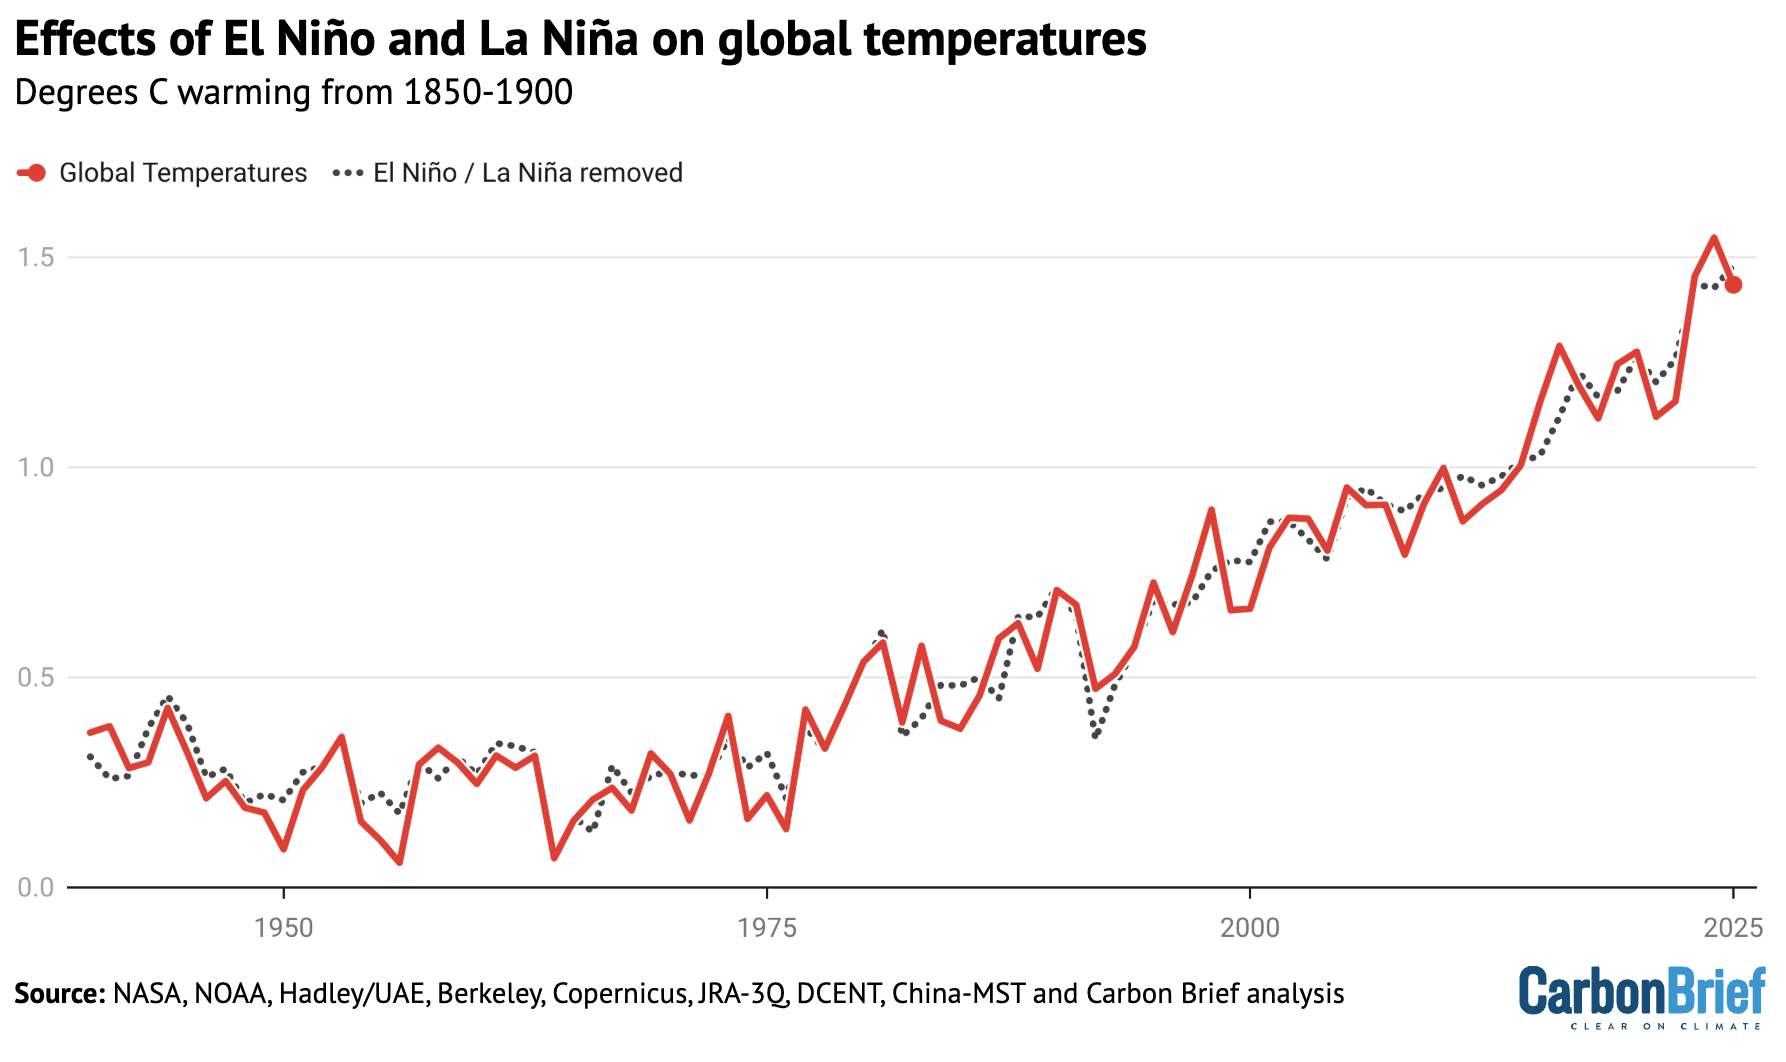
Carbon Brief has used the historical relationship between ENSO conditions and temperature to effectively remove the effects of El Niño and La Niña events from global temperatures, as shown in the figure below.
This analysis indicates that El Niño cooled global temperatures in 2025 around -0.05C, following a boost to global temperatures of around 0.12C in 2024, compared to the estimate of global temperatures with both El Niño and La Niña events removed.
Annual global average surface temperatures from the average of the eight datasets, as well as Carbon Brief’s estimate of global temperatures with the effect of El Niño and La Niña (ENSO) events removed using the Foster and Rahmstorf (2011) approach. Chart by Carbon Brief.
This suggests that the shift from El Nino to La Nina conditions can fully explain the decline in global temperatures between 2024 and 2025 and that 2025 would have likely been the warmest year in the observational record if it had not been for the effects of ENSO.
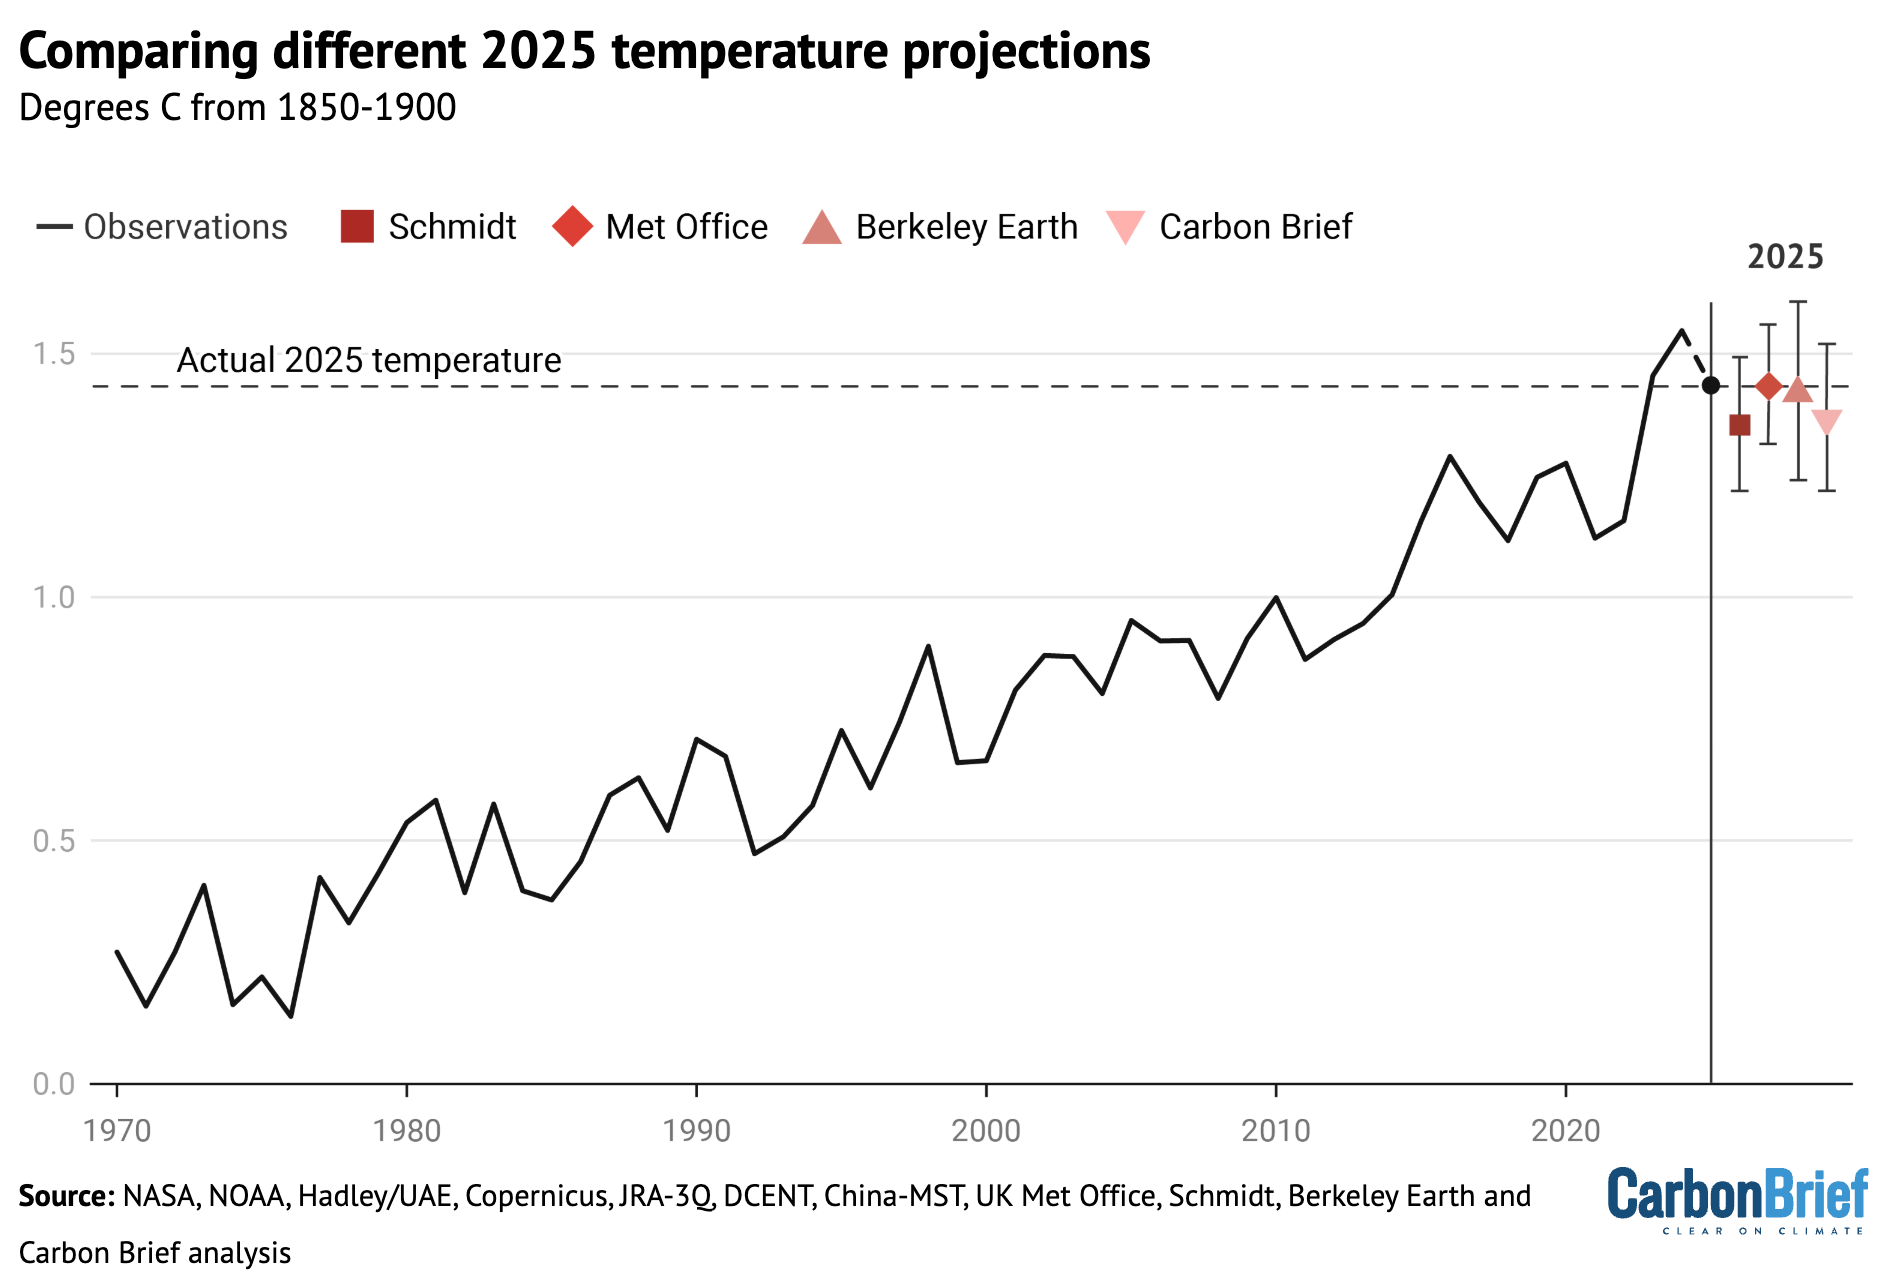
Scientists provided estimates of where they expected 2025 temperatures to end up at the start of the year.
The figure below shows estimates by four different groups that provided temperature predictions for the year prior to any data being collected – the Met Office, NASA’s Dr Gavin Schmidt, Berkeley Earth and Carbon Brief’s own estimate — compared to what actually transpired.
Temperature predictions for 2025 from UK Met Office, NASA’s Dr Gavin Schmidt, Berkeley Earth and Carbon Brief’s estimate relative to pre-industrial (1850-1900) temperatures and compared to the historical average of the eight observational datasets. Chart by Carbon Brief.
Unlike in 2023 –and, to a lesser extent, 2024 –when start-of-year predictions were notably low, 2025 fell reasonably in-line with what was expected. The Met Office estimate was nearly exactly on target, with Berkeley Earth’s being close as well. Carbon Brief and Schmidt’s estimates were a little on the low side, but actual temperatures were well within the estimated error bars.
Observations in-line with climate model projections
Climate models provide physics-based estimates of future warming given different assumptions about future emissions, greenhouse gas concentrations and other climate-influencing factors.
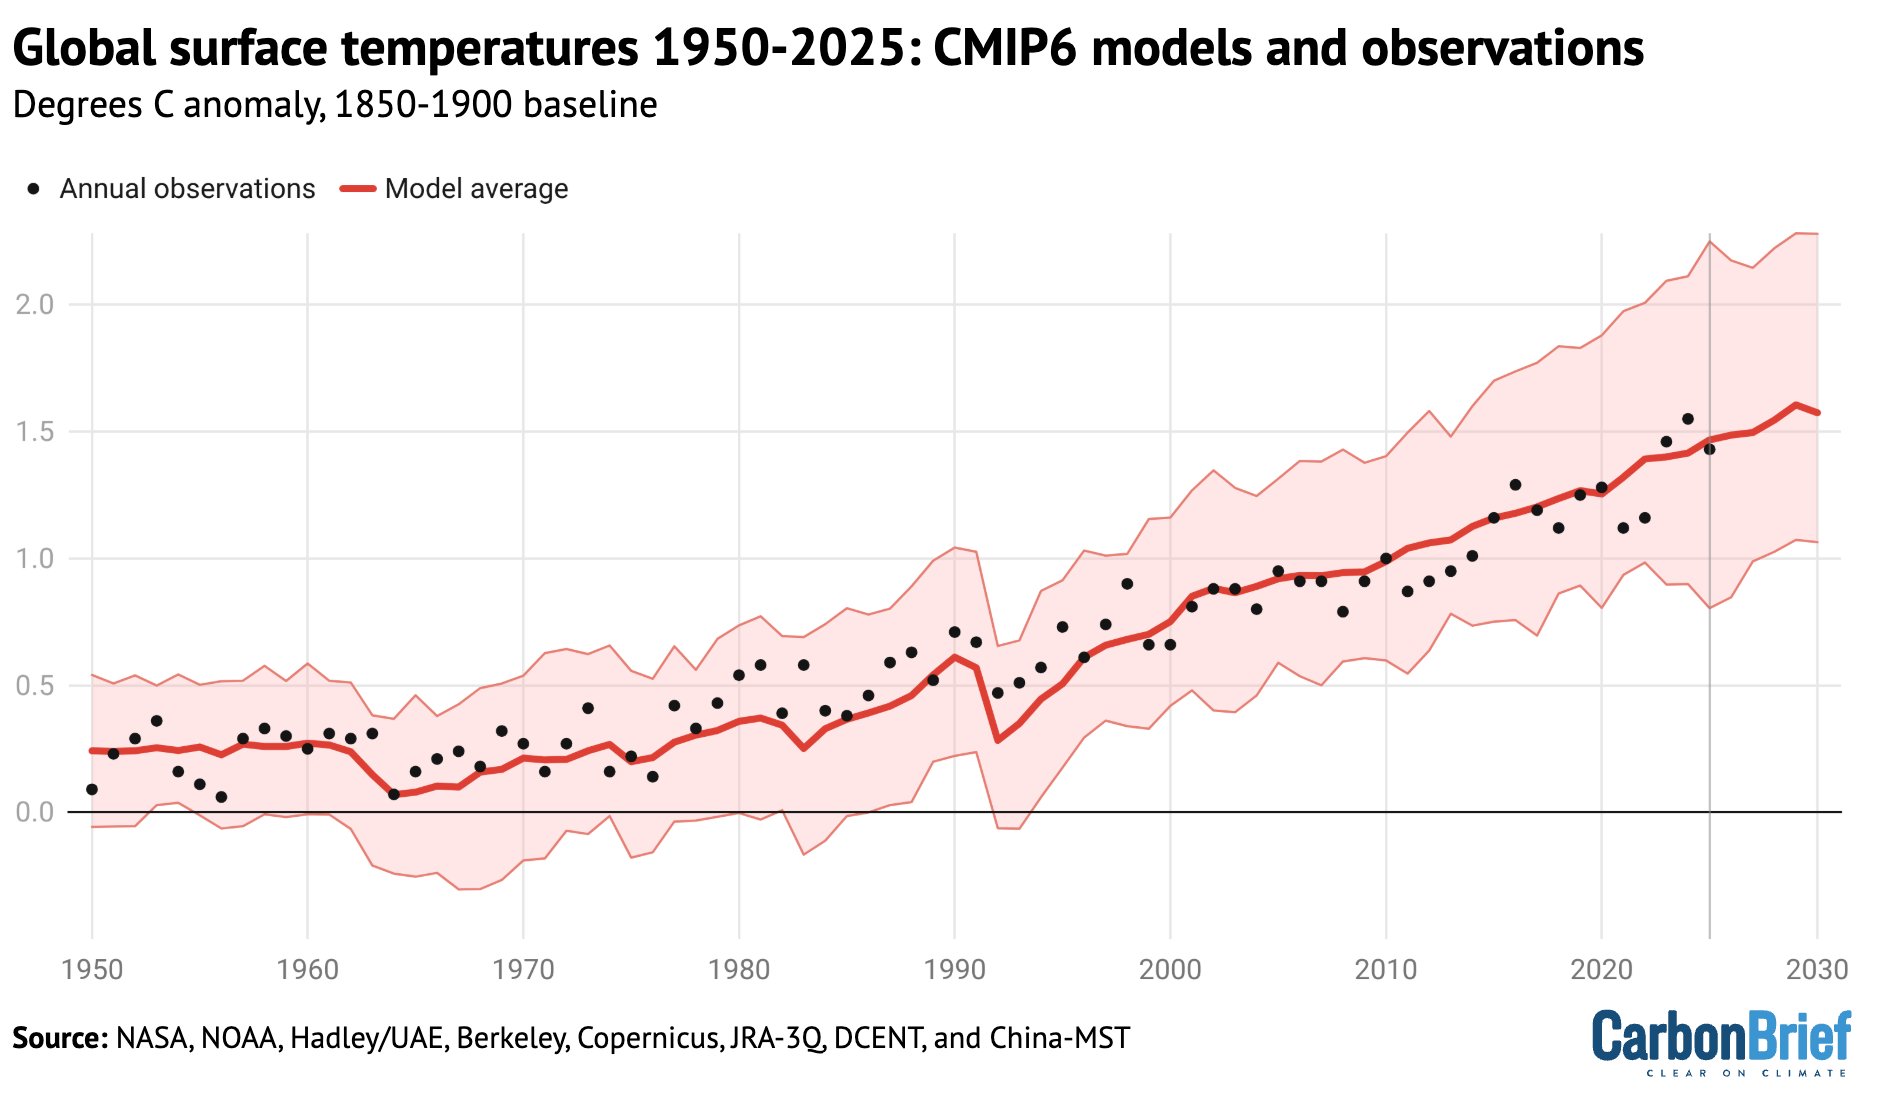
Here, Carbon Brief examines a collection of climate models – known as CMIP6 – used in the 2021 science report of the IPCC’s sixth assessment.
In CMIP6, model estimates of temperatures prior to 2015 are a “hindcast” using known past climate influences, while temperatures projected from 2015 onward are a “forecast” based on an estimate of how things might change.
The figure below shows how observations compare to the full ensemble of 37 CMIP6 models under the middle-of-the-road SSP2-4.5 emissions scenario for future projections. The red line represents the average of all the models and the red areas showing the 5th to 95th percentile range. The average of the eight observational temperature datasets are plotted as dots on top of the climate model data.
The chart illustrates how observations have generally been a bit below the model average over the past two decades, were slightly above model average in 2024 and are more or less dead on in 2025.
Annual global average surface temperatures from CMIP6 models and observations between 1950 and 2030 (through 2025 for observations). Models use the SSP2-4.5 scenario after 2015. Anomalies plotted with respect to a 1850-1900 baseline. Chart by Carbon Brief.
However, the ensemble of CMIP6 models differs from the main projection of future warming in the recent IPCC AR6 report. A subset of CMIP6 models have unrealistically high climate sensitivity and they reproduce historical observations poorly.
To account for this, rather than simply averaging all the models – as had been done in prior assessments – the IPCC employed an approach that effectively weights models by their performance. As a result, the models align better with the range of climate sensitivity derived from multiple different lines of evidence.
The chart below shows the assessed warming projections from the IPCC AR6 report in red, with historical observations since 1850 as black dots.
Annual global average surface temperatures from the average of eight datasets (black dots) along the 30-year LOWESS fit (red line), combined the AR6 assessed warming projection for SSP2-4.5 as published and without any baseline alignment. Chart by Carbon Brief.
The chart reveals that observed global surface temperatures (black dots) are further above the modeled central estimate 2023-25, but generally remain within the IPCC assessed range.
Climate models broadly expect an acceleration of warming in the current period in a scenario like SSP2-4.5 where emissions of CO2 and other greenhouse gases continue to modestly increase, but emissions of planet-cooling aerosols like sulphur dioxide are rapidly reduced.
Second-warmest atmospheric temperatures
In addition to surface measurements over the world’s land and oceans, satellite microwave sounding units have been providing estimates of temperatures at various layers of the atmosphere since 1979.
The lowest layer of the atmosphere that satellite microwave units provide temperature estimates for is the lower troposphere. This data reflects temperatures a few kilometres above the Earth’s surface. It reveals a pattern of warming in the lowest troposphere that is similar – though not identical – to surface temperature changes.
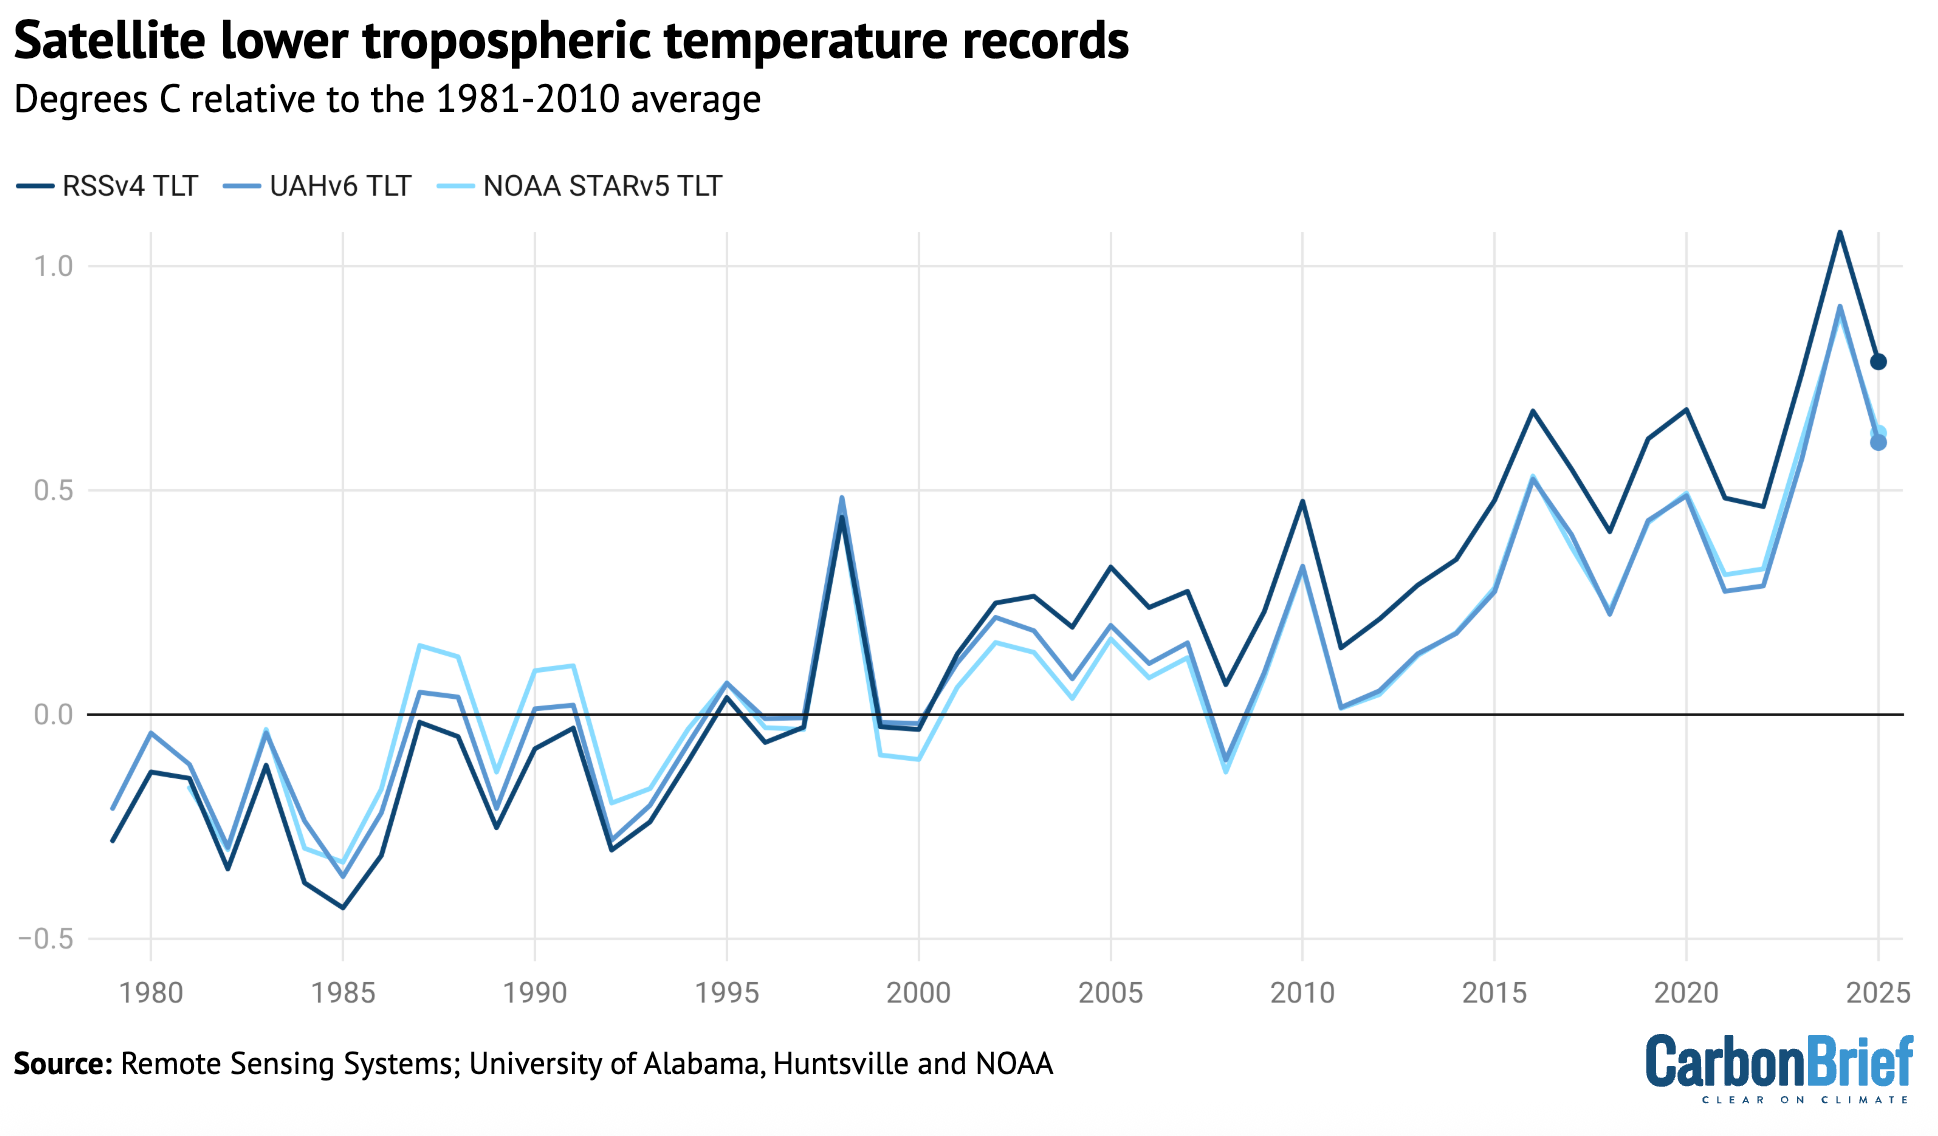
The records produced by Remote Sensing Systems (RSS), the University of Alabama, Huntsville (UAH) and NOAA show 2025 as the second warmest year on record in the lower troposphere, after 2024. The chart below shows the three records for the lower troposphere, using a more recent baseline period (1981-2010) given the absence of satellite data before 1979.
Global average lower-troposphere temperatures from RSS version 4 (dark blue), UAH version 6 (mid-blue) and NOAA STAR version 5 (light blue) for the period from 1979-2025, relative to a 1981-2010 baseline. Chart by Carbon Brief.
The lower troposphere tends to be influenced more strongly by El Niño and La Niña events than the surface. Therefore, satellite records show correspondingly larger warming or cooling spikes during these events. This explains why there was both a bigger increase between 2023 and 2024 and a bigger decline between 2024 and 2025 in the satellite record than in surface records.
The lower-tropospheric temperature records show large differences after the early 2000s. RSS shows an overall rate of warming quite similar to surface temperature records, while UAH and NOAA show considerably slower warming in recent years than has been observed on the surface.
Greenhouse gas concentrations reach new highs
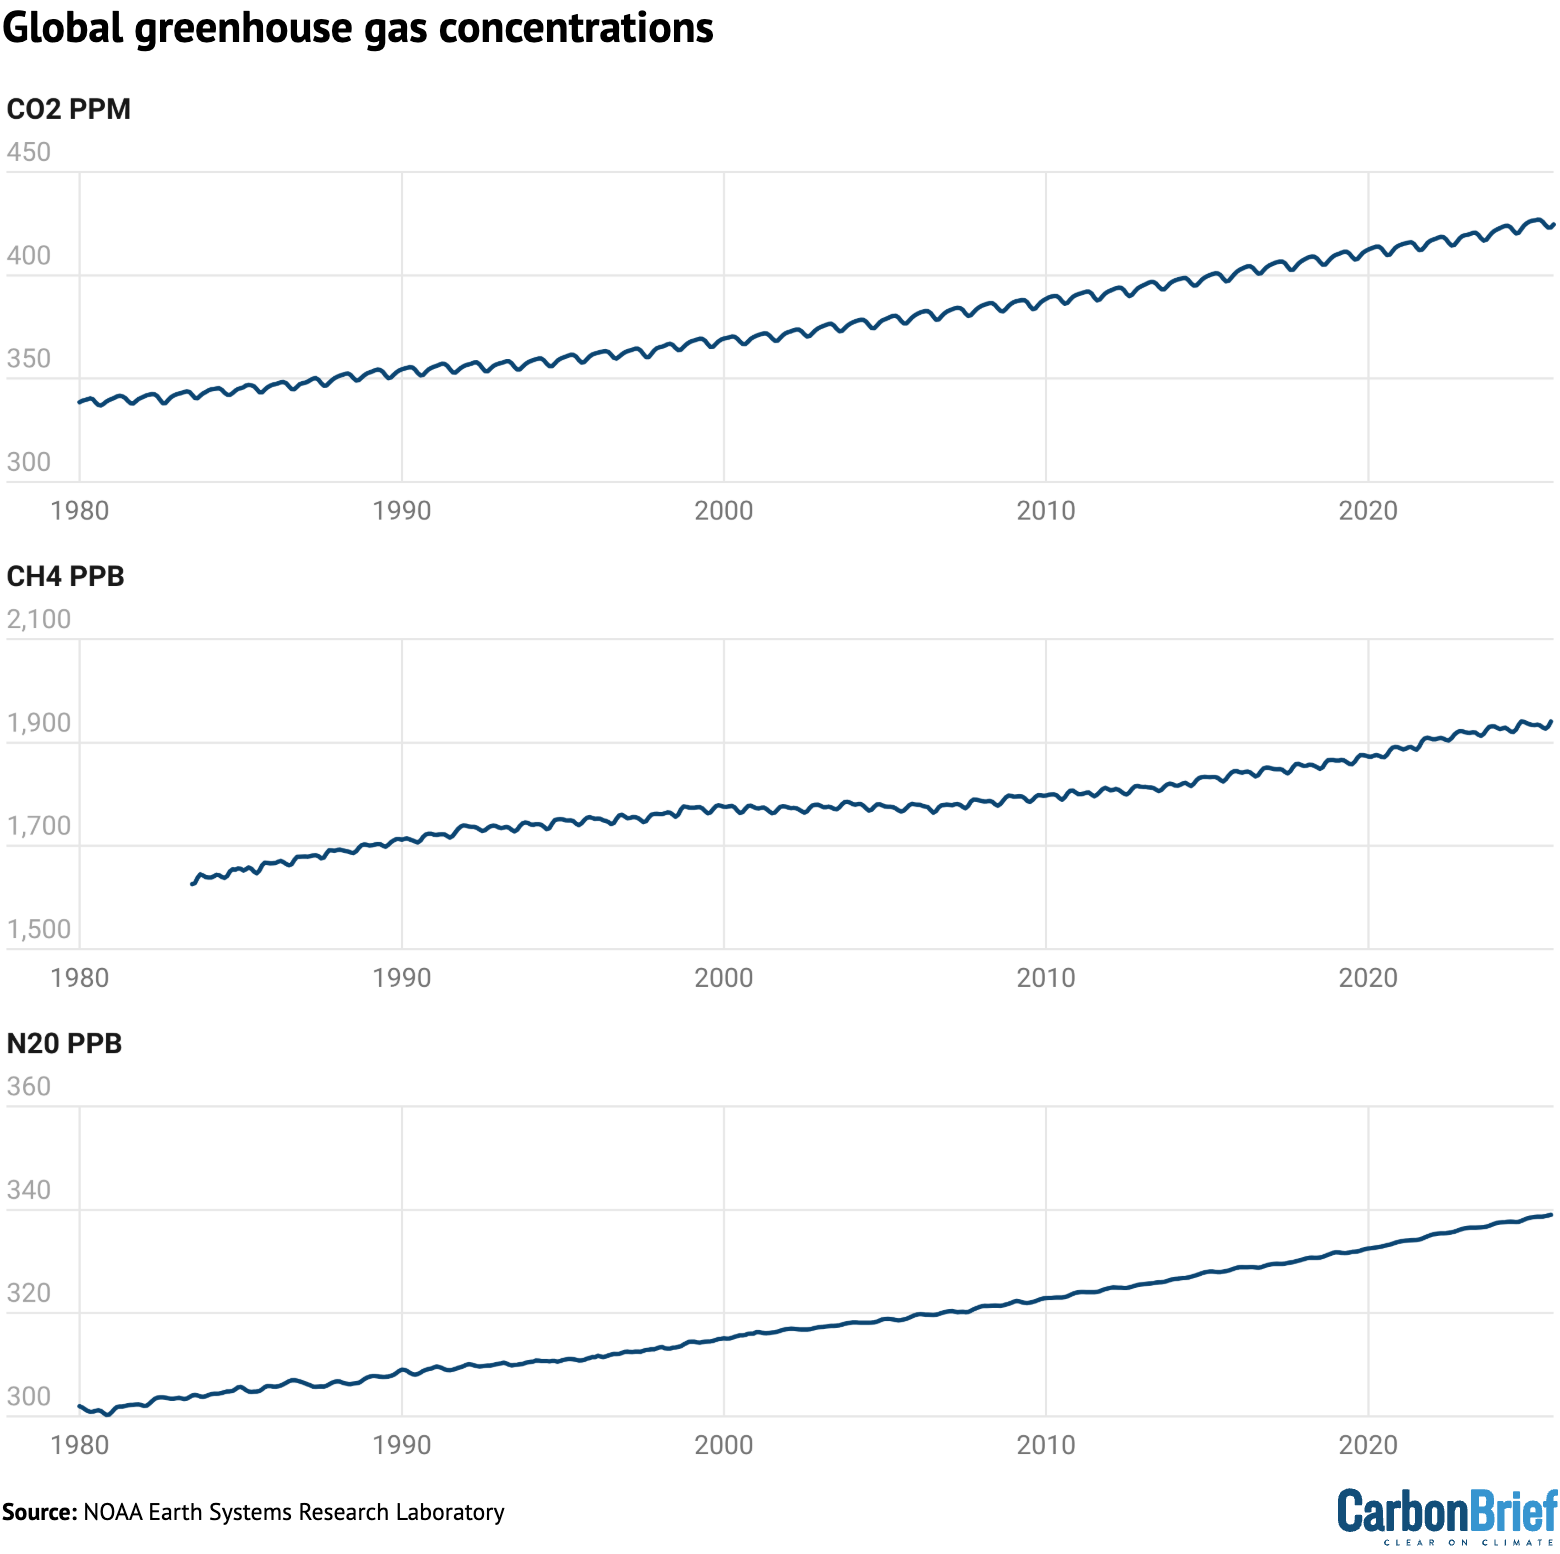
Greenhouse gas concentrations reached a new high in 2025, driven by human-caused emissions from fossil fuels, land use and agriculture.
Three greenhouse gases – CO2, methane (CH4) and nitrous oxide (N2O) – are responsible for the bulk of additional heat trapped by human activities. CO2 is by far the largest factor, accounting for roughly 42% of the increase in global surface temperatures since the pre-industrial era (1850-1900).
Methane accounts for 28%, while nitrous oxide accounts for around 5%. The remaining 25% comes from other factors including carbon monoxide, black carbon and halocarbons, such as chlorofluorocarbons (CFCs).
Human emissions of greenhouse gases have increased atmospheric concentrations of CO2, methane and nitrous oxide to their highest levels in at least a few million years – if not longer.
The figure below shows concentrations of these greenhouse gases – in parts per million (ppm) for CO2 and parts per billion (ppb) for methane and nitrous oxide – from the early 1980s through to October 2025 for CO2 and September 2025 for CH4 and N2O (the most recent data currently available).
Global concentrations of CO2, methane (CH4) and nitrous oxide (N2O). Based on data from NOAA’s Earth Systems Research Laboratory. Note that the y-axes do not start at zero. Chart by Carbon Brief.
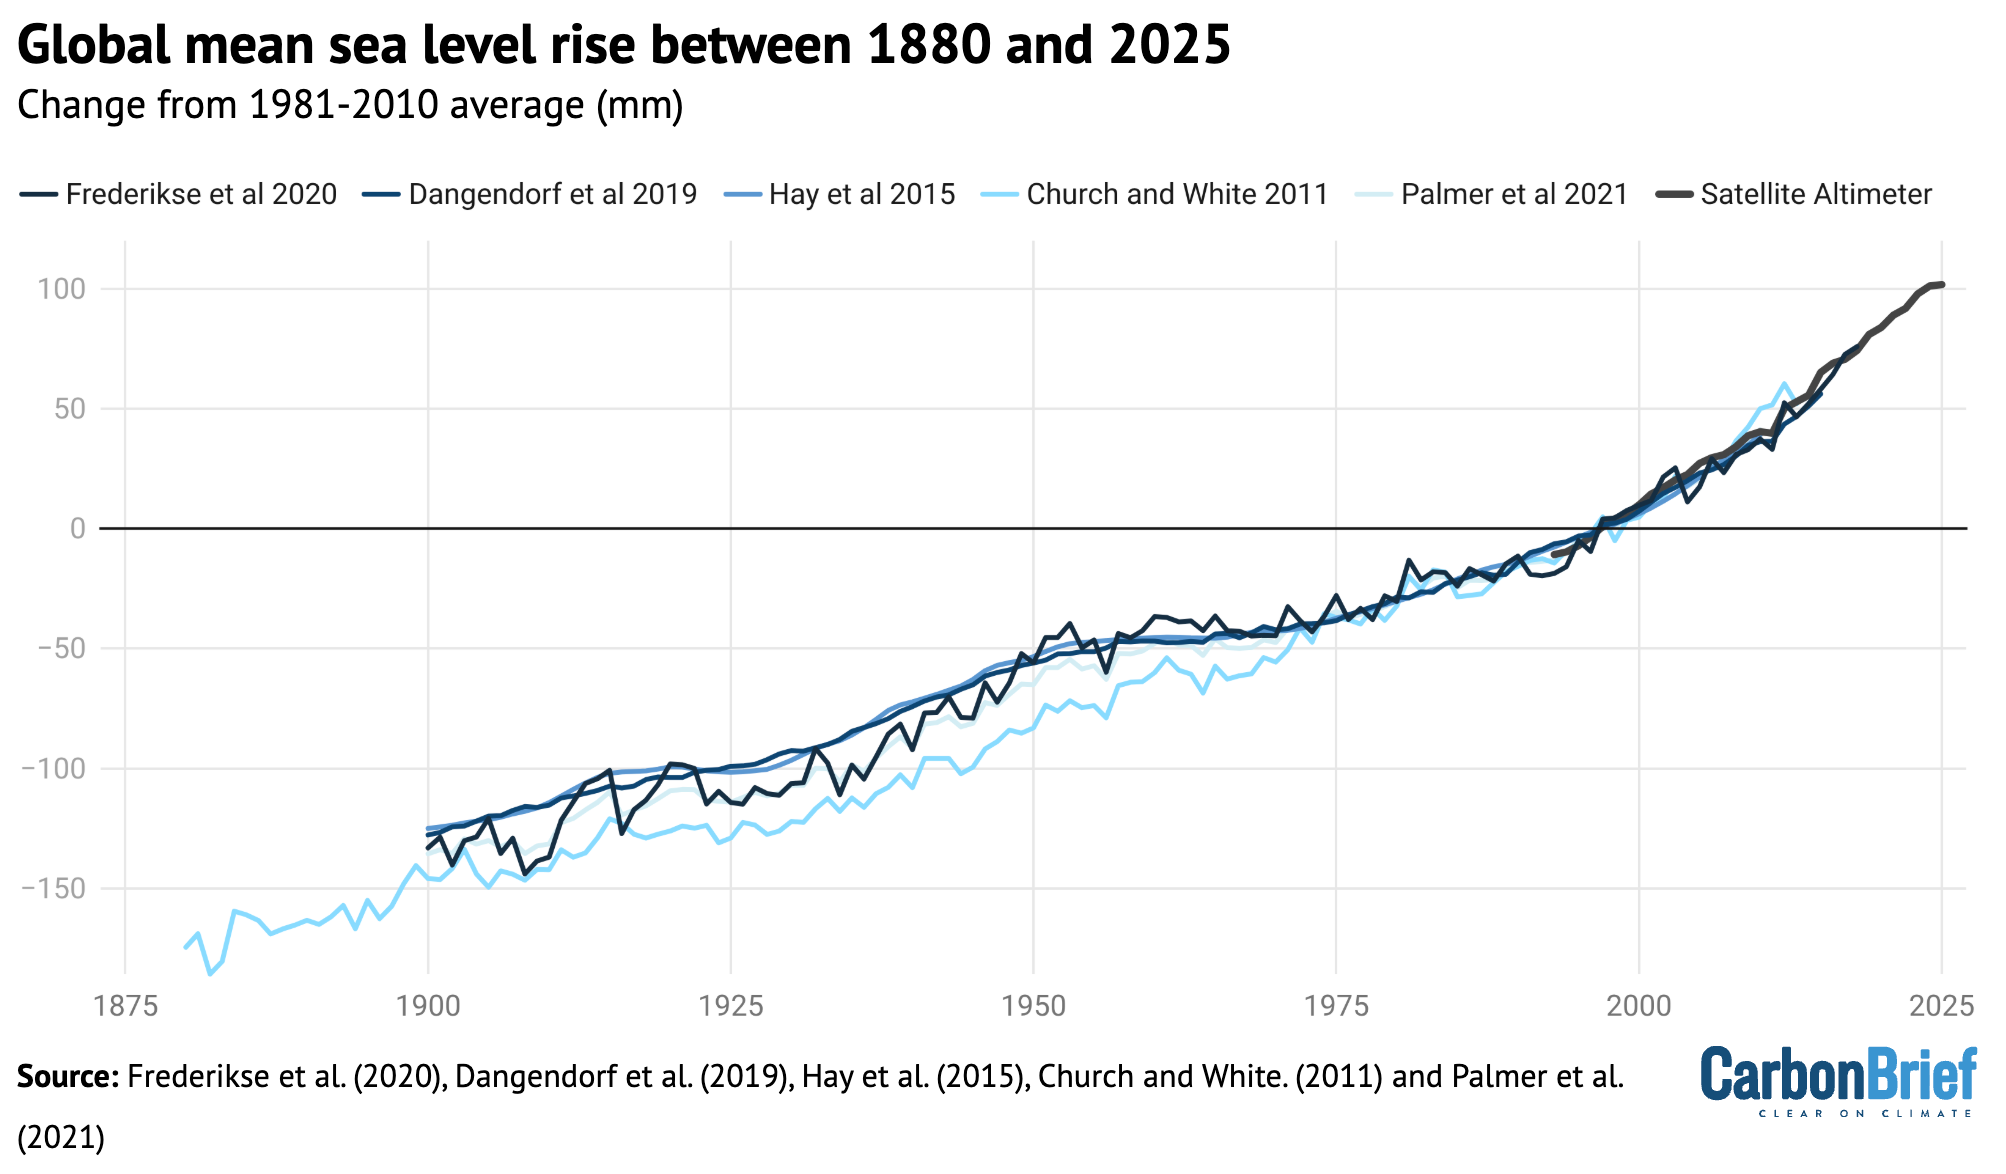
Sea level is rising rapidly
Modern-day sea levels have risen to a new high, due to a combination of melting land ice (such as glaciers and ice sheets), the thermal expansion of water as it warms and changes in land water storage.
In recent years, there have been larger contributions to sea level rise from melting ice sheets and glaciers, as warmer temperatures accelerate ice sheet losses in Greenland and Antarctica.
Since the early 1990s, the increase in global sea level has been estimated using altimeter data from satellites. Earlier global sea levels have been reconstructed from a network of global tide gauge measurements. This allows researchers to estimate how sea level has changed since the late 1800s.
The chart below shows five different modern sea level rise datasets (blue lines), along with satellite altimeter measurements as assessed by AVISO (in black) after 1993. (As sea level rise data has not yet been released for the whole year, the 2025 value is estimated based on data through to November.)
Global average sea level rise reconstructed from tide gauge data between 1880 and 2025 from Frederikse et al. (2020), Dangendorf et al. (2019), Hay et al. (2015), Church and White (2011), and Palmer et al. (2021). Satellite altimeter data from 1993 (black) to present is taken from AVISO. Chart by Carbon Brief.
Sea levels have risen by over 0.2 metres (200mm) since 1900. While sea level rise estimates mostly agree in recent decades, larger divergences are evident before 1980. There is also evidence of accelerating sea level rise over the post-1993 period when high-quality satellite altimetry data is available.
(To understand more on how climate change is accelerating sea level rise, read Carbon Brief’s explainer.)
Shrinking glaciers and ice sheets
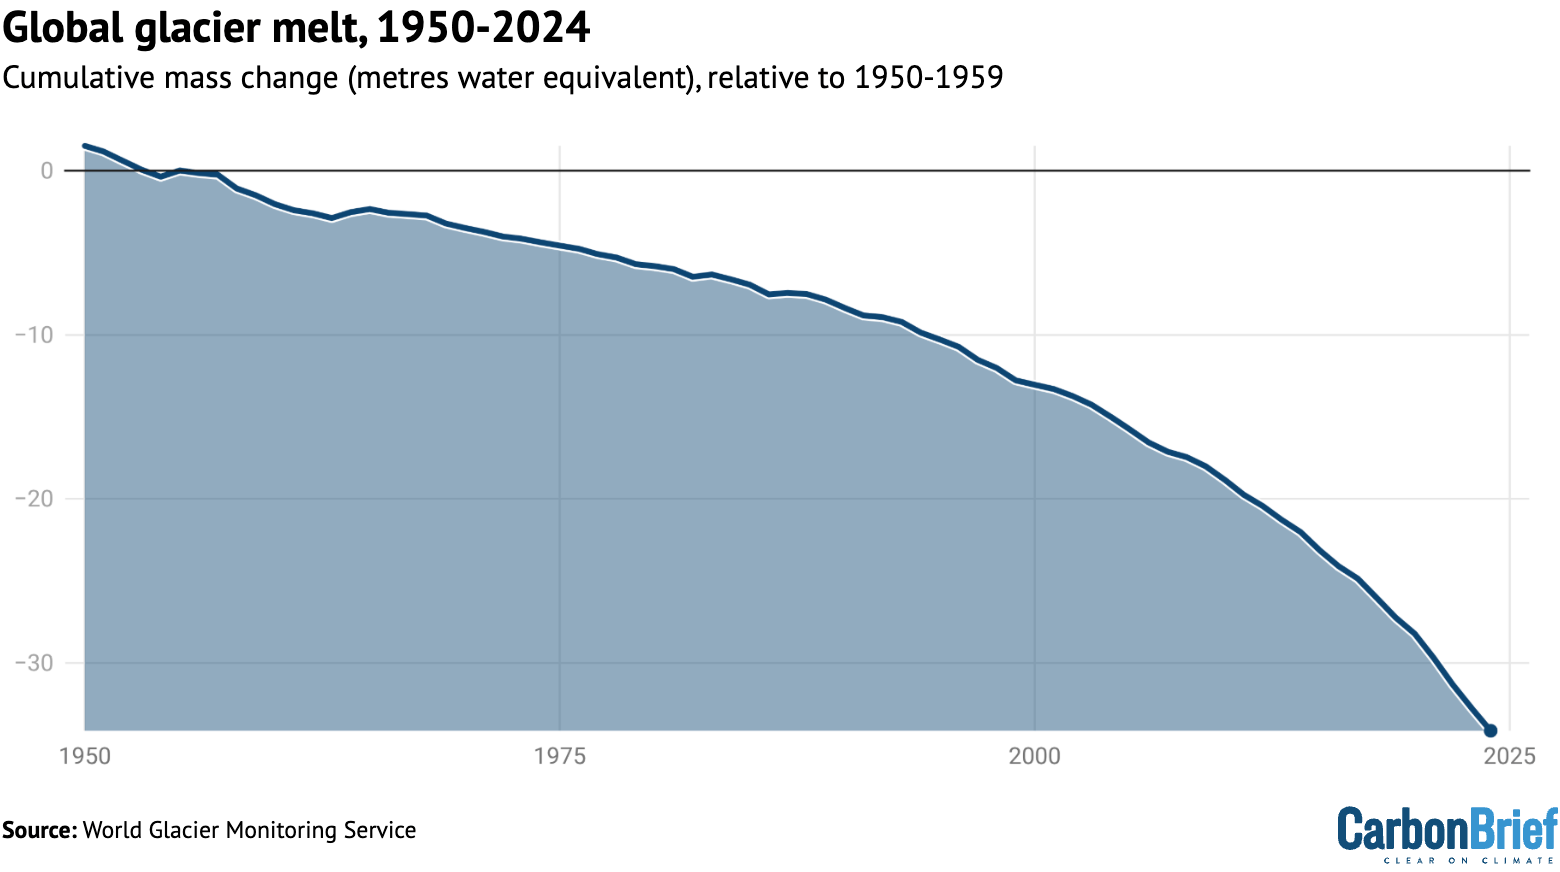
A significant portion of global sea level rise is being driven by melting glaciers on land.
Scientists measure the mass of glaciers around the world using a variety of remote-sensing techniques, as well as through GRACE measurements of the Earth’s gravitational field. The balance between snow falling on a glacier and ice loss through melting and the breaking off – or “calving” – of icebergs determines if glaciers grow or shrink over time.
The World Glacier Monitoring Service is an international consortium that tracks more than 130 different glaciers in 19 different regions around the world. The figure below shows the change in global average glacier mass from 1950 through to the end of 2024. (2025 values are not yet available.) Note that glacier melt is reported in metres of water equivalent, which is a measure of how much mass has been lost on average.
Global average glacier melt over the 1950-2024 period from the World Glacier Monitoring Service, in metres of water equivalent. Carbon Brief.
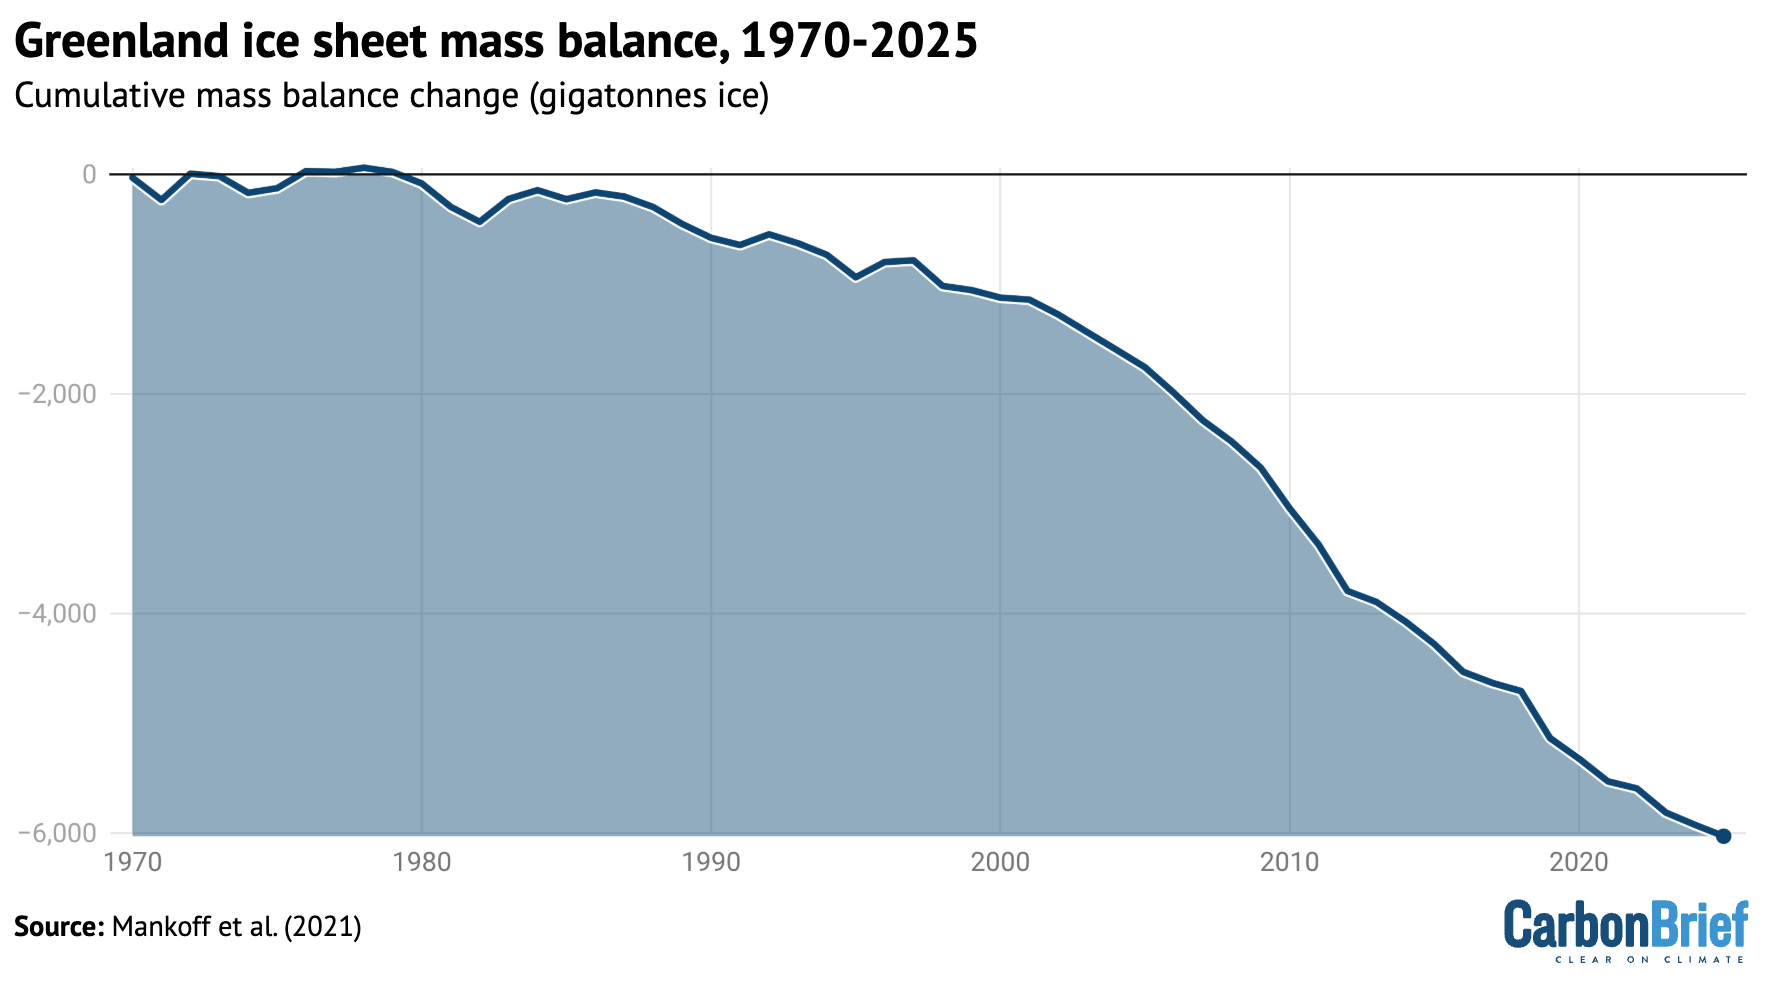
Greenland ice sheets have become a larger contributor to sea level rise in recent years due to accelerating loss of mass. The year 2025 was the 29th in a row where Greenland lost ice overall, with 105bn tonnes of ice lost over the 12 months from September 2024 to August 2025. Greenland last saw an annual net gain of ice in 1996.
The figure below shows the cumulative mass balance change – that is, the net ice loss – from Greenland between 1970 and 2025. The authors find that Greenland has lost around 6tn tonnes of ice over the past 50 years – more than 700 tonnes lost per person for every person on the planet.
Cumulative ice loss from Greenland in billion metric tonnes (gigatonnes) between 1970 and 2025 from Mankoff et al 2021. Chart by Carbon Brief.
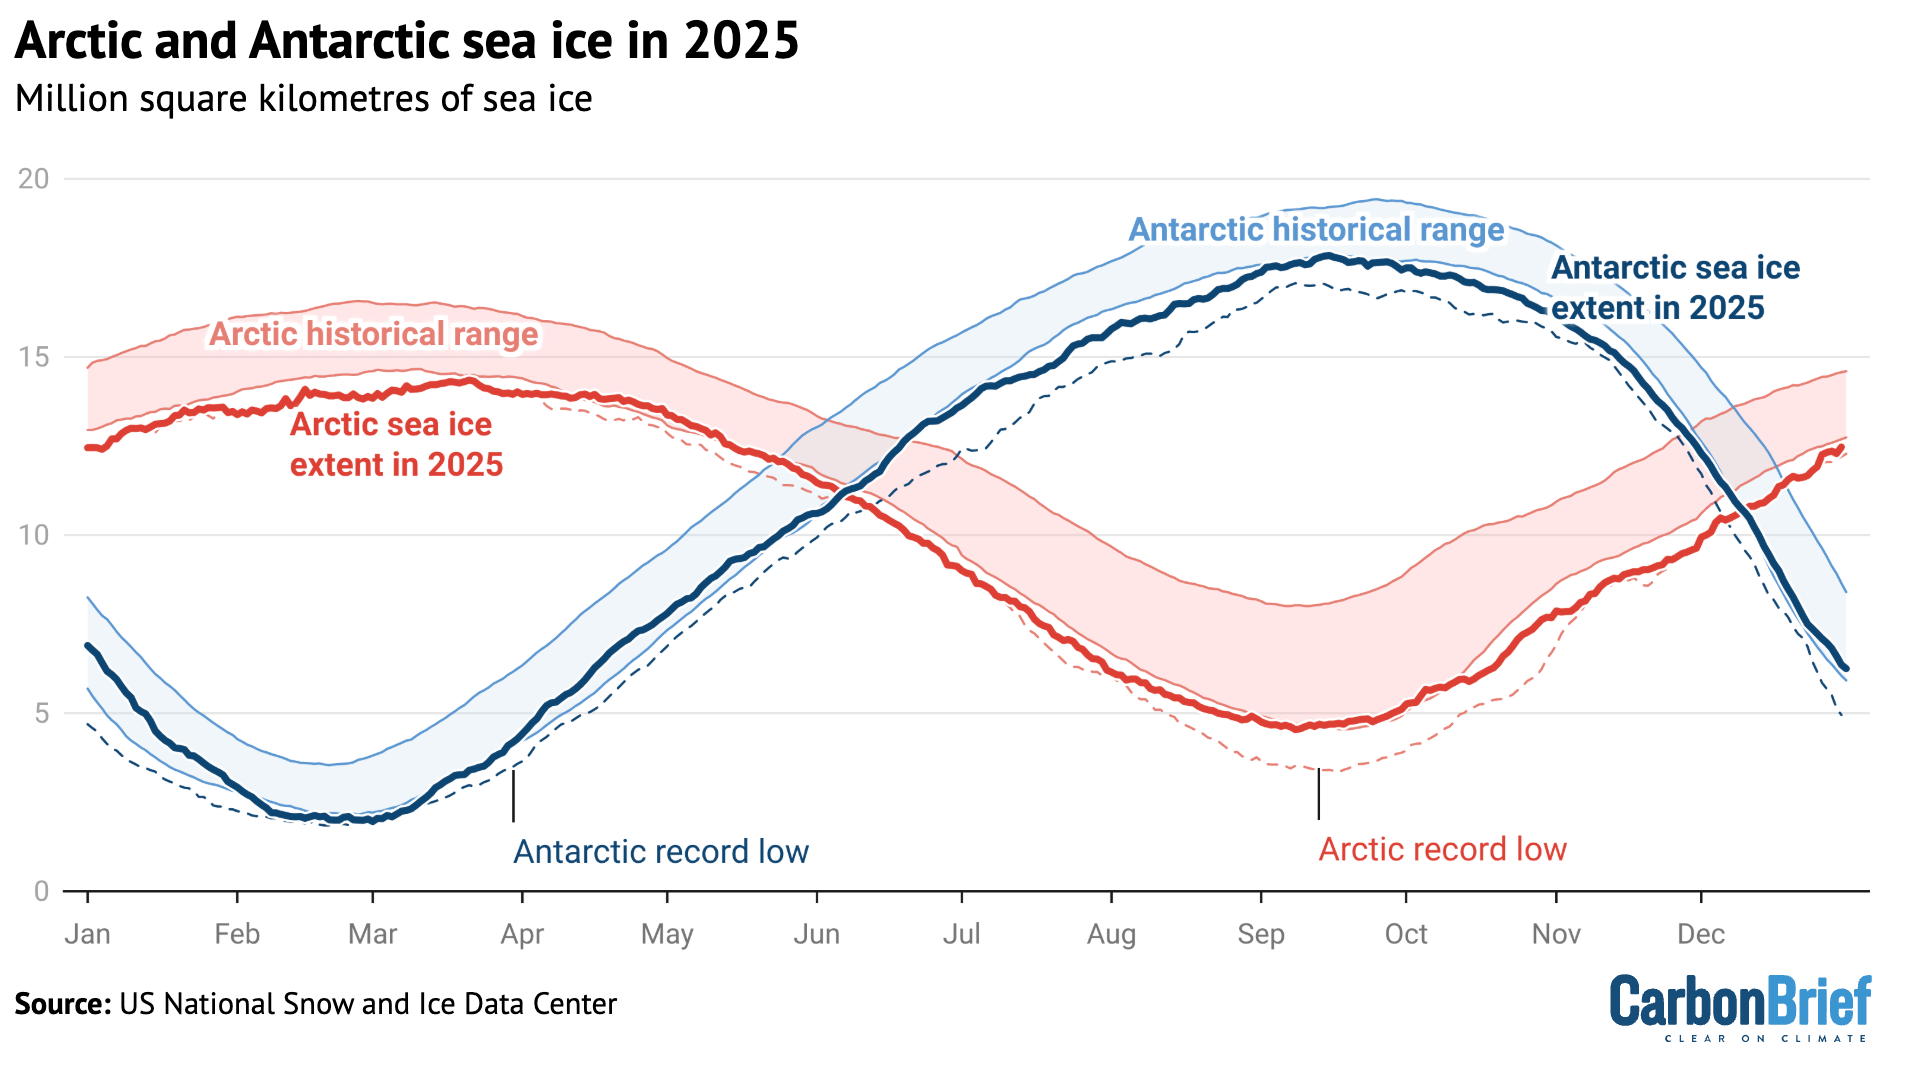
Lowest winter Arctic sea ice extent
Arctic sea ice saw its lowest winter peak on record as well as its 10th-lowest summer minimum extent, while Antarctic sea ice saw its third-lowest minimum extent.
Both the Arctic and Antarctic were at the low end of the historical (1979-2010) range for most of 2025, with new daily lows recorded for Arctic sea ice extent in January, February, March, June and December.
The figure below shows both Arctic (red line) and Antarctic (blue line) sea ice extent for each day of the year, along with how it compares to the historical range (corresponding shading).
Arctic and Antarctic daily sea ice extent from the US National Snow and Ice Data Center. The bold lines show daily 2025 values, the shaded area indicates the two standard deviation range in historical values between 1979 and 2010. The dotted black lines show the record lows for each pole. Chart by Carbon Brief.
Looking ahead to 2026
There is reason for caution when estimating likely temperatures for 2026.
In 2023, temperatures were significantly higher than predictions made at the start of the year, while 2024 temperatures were towards the high end of annual predictions. Temperatures in 2025 were more in-line with predictions, albeit still on the higher side for three out of the four predictions included above.
There are currently weak La Niña conditions currently present in the tropical Pacific, which are expected to extend through February. This would somewhat suppress temperatures in the first half of the year. However, the latest forecasts suggest a growing likelihood of El Niño conditions developing by June, which may lead to warmer temperatures in late 2026 – and potentially much warmer temperatures in 2027.
Carbon Brief predicts that global average surface temperatures in 2026 are likely to be between the second and fourth warmest on record, similar to 2023 and 2025, at around 1.4C above pre-industrial levels.
The figure below shows the four different 2026 predictions compared to the average of eight different temperature records explored in this article. (These have been “normalised” to show 2026 warming relative to the 2023-25 average to allow a clear comparison, given that each of the predictions was originally presented for a different temperature record.)
Carbon Brief’s prediction of likely 2026 temperatures is based on a statistical model using the average temperature of the past year, the latest monthly temperature and projections of ENSO conditions over the first three months of 2026.
Temperature projections for 2026 from the Met Office, NASA’s Dr Gavin Schmidt, Berkeley Earth and Carbon Brief, relative to pre-industrial (1850-1900) temperatures and compared to the historical average of eight different surface temperature datasets. Chart by Carbon Brief.
The Met Office, Dr Schmidt, Berkeley Earth and Carbon Brief estimates all have 2026 ending up as somewhere between the second- and fourth-warmest year on record, with the best estimate as being more or less tied with 2023 and 2025.
There is a very small chance that 2026 could end up beating 2024 as the warmest year on record, or end up below 2016 as the fifth or sixth warmest year.
However, with the growing likelihood of El Niño conditions developing in the second half of 2026, it is increasingly likely that 2027 will challenge 2024 for the title of the warmest year on record. The rate of warming has notably accelerated over the past 15 years and the period of exceptionally warm years that started in 2023 shows no signs of abating.
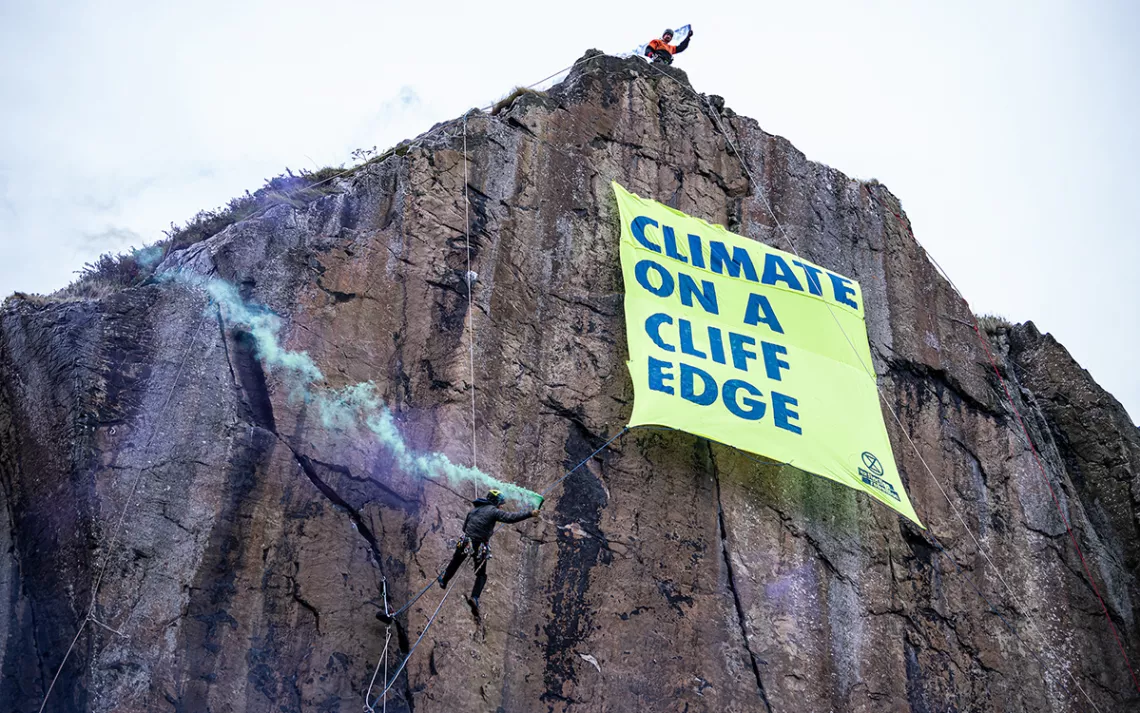
Experienced climbers scale a rock face near the historic Dumbarton castle in Glasgow, releasing a banner that reads “Climate on a Cliff Edge.” One activist, dressed as a globe, symbolically looms near the edge, while another plays the bagpipes on the shores below. | Photo courtesy of Extinction Rebellion and Mark Richards
Donald Trump urges you to be a Climate Science denier like him. He says that he makes millions and millions for destroying the planet, Burn, Baby, Burn and Flood, Baby, Flood.Nigel Farage urges you to ignore facts and reality and be a climate science denier like him and his Deputy Richard Tice. He says that Reform UK has received £Millions and £Millions from the fossil fuel industry to promote climate denial and destroy the planet.
US President Donald Trump, seen through a viewfinder, speaks at the Detroit Economic Club, in Detroit, January 13, 2026
With the illegitimate partition of Palestine, and inflicting ongoing terror on Palestinians, Israel and the US continue to smash down the basic principles of democracy
…
With Trump briefing his army that the future war and enemy is internal, ICE must surely be taking lessons from the IDF as to how one controls and intimidates a local population. The road checks, walls, settler violence and attacks, shootings, mass arrests and taking prisoners are a template that is being transferred to the US.
Regarding the local population as the enemy, defining them as terrorist is a well-worn tactic. In 1954, Israel passed A Prevention of Infiltration Law. Its effect was to criminalise those Palestinians who had been made refugees during the Nakba if they sought to return to their homes and land. Pass a law to make citizens aliens or define drug dealers and protesters as terrorists — then the normal rule of law does not apply. Indeed, there are no rules, anyone or anything can be defined as illegal. Just label it terrorist.
It is easy to take the parallels too far. In this neoliberal global war, the US does not need lessons in violence and aggression. It, too, is born on the back of settler colonialism and genocide, has a culture of guns and violence. But the strength of Israel as a 20th-century exemplar of what can be done without recrimination is evident.
This is not some historical precedent from before civilisation and enlightenment when everyone did abhorrent things. After the horrors of the second world war, “never again” was not just about the Holocaust, it was meant to bring about settling issues between states without recourse to war. Setting red lines of international law not to be crossed.
But Israel has crossed them time and again; relegitimised genocide, made it an acceptable tactic to kill tens of thousands of women and children deliberately, starve a population and create a famine, flatten a country and commit ecocide while destroying its health, education and water systems. No wonder Trump and Netanyahu get on most of the time — they are creating a new world order based on fascist means, morals and tactics.
It is not necessary to do historic comparisons. It is not the salutes they make nor the language they use — it is the ideology they share. Authoritarian, opposing equality, individual and collective rights while celebrating violence, embracing paramilitarism and seeking to expand territory using threats of armed conflict to underpin economic bullying. All classic traits of fascism in the making.
Elon Musk urges you to be a Fascist like him, says that you can ignore facts and reality then.The original Fascists Mussolini and HitlerOrcas discuss how Trump was re-elected and him being an obviously insane, xenophobic Fascist.
Nurses share harrowing accounts of a ‘broken system’
NURSES have shared harrowing accounts of a “broken system” of corridor care that “tortures” patients, with people left in chairs for days and one patient choking to death, unnoticed.
Publishing new findings on the practice today, the Royal College of Nursing (RCN) warned that collapsing NHS care standards are pushing staff morale “past the point of no return.”
The report comes a year after a previous damning investigation by the union into corridor care.
RCN contacted thousands of nurses who contributed to last year’s report to assess whether corridor care was still being used and its impact.
Responses from 436 nurses showed the practice remains widespread.
Nurses described having to hold up white sheets to protect patient dignity while performing intimate procedures.
At one hospital, an elderly patient was forced to eat in a corridor beside someone who was vomiting.
A nurse working in the NHS in south-west England said patients felt “deeply embarrassed, objectified, judged, uncared for” and like “a burden on a broken system.”
They are often “wishing they had never bothered to come in and would rather have taken the risk of dying at home than go through the torture,” the nurse said.
“Because that’s what we subject them to, a type of torture.”
Venezuelan workers—one holding a sign reading, “We are nobody’s backyard”—march in support of kidnapped President Nicolás Maduro in the capital Caracas on January 14, 2026. (Photo by Ivan Mc Gregor/Anadolu via Getty Images)
“The empire can do whatever it wants, but we are here to tell you that we are free, independent, and sovereign,” said one demonstrator.
Demonstrations demanding the United States release Venezuelan President Nicolás Maduro and his wife continued Wednesday as thousands more people took to the streets of Caracas in a show of support for the abducted leftist leader.
Public workers led a march through Caracas, during which demonstrators chanted slogans—including “Free Maduro!”—while vowing to keep protesting until the socialist president and his wife, First Combatant Cilia Flores, return home.
“Unity is not under discussion at this time,” Capital District Head of Government Nahum Fernández said during Wednesday’s rally. “The person who conspires against unity conspires against Venezuela.”
“The Venezuelan people are going to be in the streets and they’re going to have to hand Maduro over to the Venezuelans,” Fernández added.
Labor leader Anais Herrera demanded the US release Maduro “because he is our president and we want him back, we are in the streets and we will not rest.”
“The president prepared us for this and that is why we are in combat, in the streets with the Venezuelan working class,” she said.
Maduro and Flores were kidnapped by US special forces soldiers during a January 3 invasion backed by airstrikes and an armada of naval warships deployed along with thousands of troops off the Venezuelan coast. The US operation killed more than 100 people, including Venezuelan troops and civilians and over 30 Cuban soldiers and police officers.
The administration of US President Donald Trump has indicted Maduro for alleged conspiracy to commit narco-terrorism, conspiracy to import cocaine into the United States, conspiracy to possess machine guns and destructive devices, and possession of such weapons. Maduro has pleaded not guilty to all charges, and has called himself a “prisoner of war.”
Venezuelan Vice President Delcy Rodríguez—who is serving as the US-backed acting president—said Wednesday that she had a long, courteous phone call with Trump, who expressed satisfaction with her move to release hundreds of prisoners held for political or national security offenses.
“This opportunity is for Venezuela and for the people of Venezuela to be able to see reflected a new moment where coexistence, where living together, where recognition of the other allows building and erecting a new spirituality,” Rodríguez said.
Trump took to his Truth Social network Wednesday to praise the “very good call” with Rodríguez.
“We are making tremendous progress, as we help Venezuela stabilize and recover,” the president wrote. “Many topics were discussed, including Oil, Minerals, Trade and, of course, National Security. This partnership between the United States of America and Venezuela will be a spectacular one FOR ALL.”
Amid widespread international condemnation of his aggression, Trump has openly declared his intention to control and exploit Venezuela’s vast oil resources, dubiously claiming that the country owes the US for losses incurred by oil companies due to past petroleum nationalization.
Trump is scheduled to meet Thursday afternoon with Venezuelan opposition leader and recent Nobel Peace Prize recipient María Corina Machado at the White House. To the chagrin of right-wing Venezuelans and much of his base, Trump has said that Machado “doesn’t have the support” to be the country’s next president.
On the streets of Caracas, one protester said Wednesday, “We say to Donald Trump, that miserable invader… [that] Maduro has already proven that he is innocent.”
“Nicolás is not a drug trafficker,” she added. “I don’t know why they haven’t returned him yet.”
Another demonstrator at the march said, “The empire can do whatever it wants, but we are here to tell you that we are free, independent, and sovereign.”
“You can meet with whomever you want,” the man said in a message meant for Trump, “but you must meet with who represents our government, and you must release Nicolás Maduro—our president—and Cilia Flores.”
Elon Musk urges you to be a Fascist like him, says that you can ignore facts and reality then.Donald Fuhrump says that Amerikkka doesn’t bother with crimes or charges anymore, not being 100% Amerikkkan and opposing his real estate intentions is enough.Orcas discuss how Trump was re-elected and him being an obviously insane, xenophobic Fascist.