Antarctic sea ice winter peak in 2025 is third smallest on record
Original article by Svetlana Onye and Ayesha Tandon republished from Carbon Brief under a CC license.
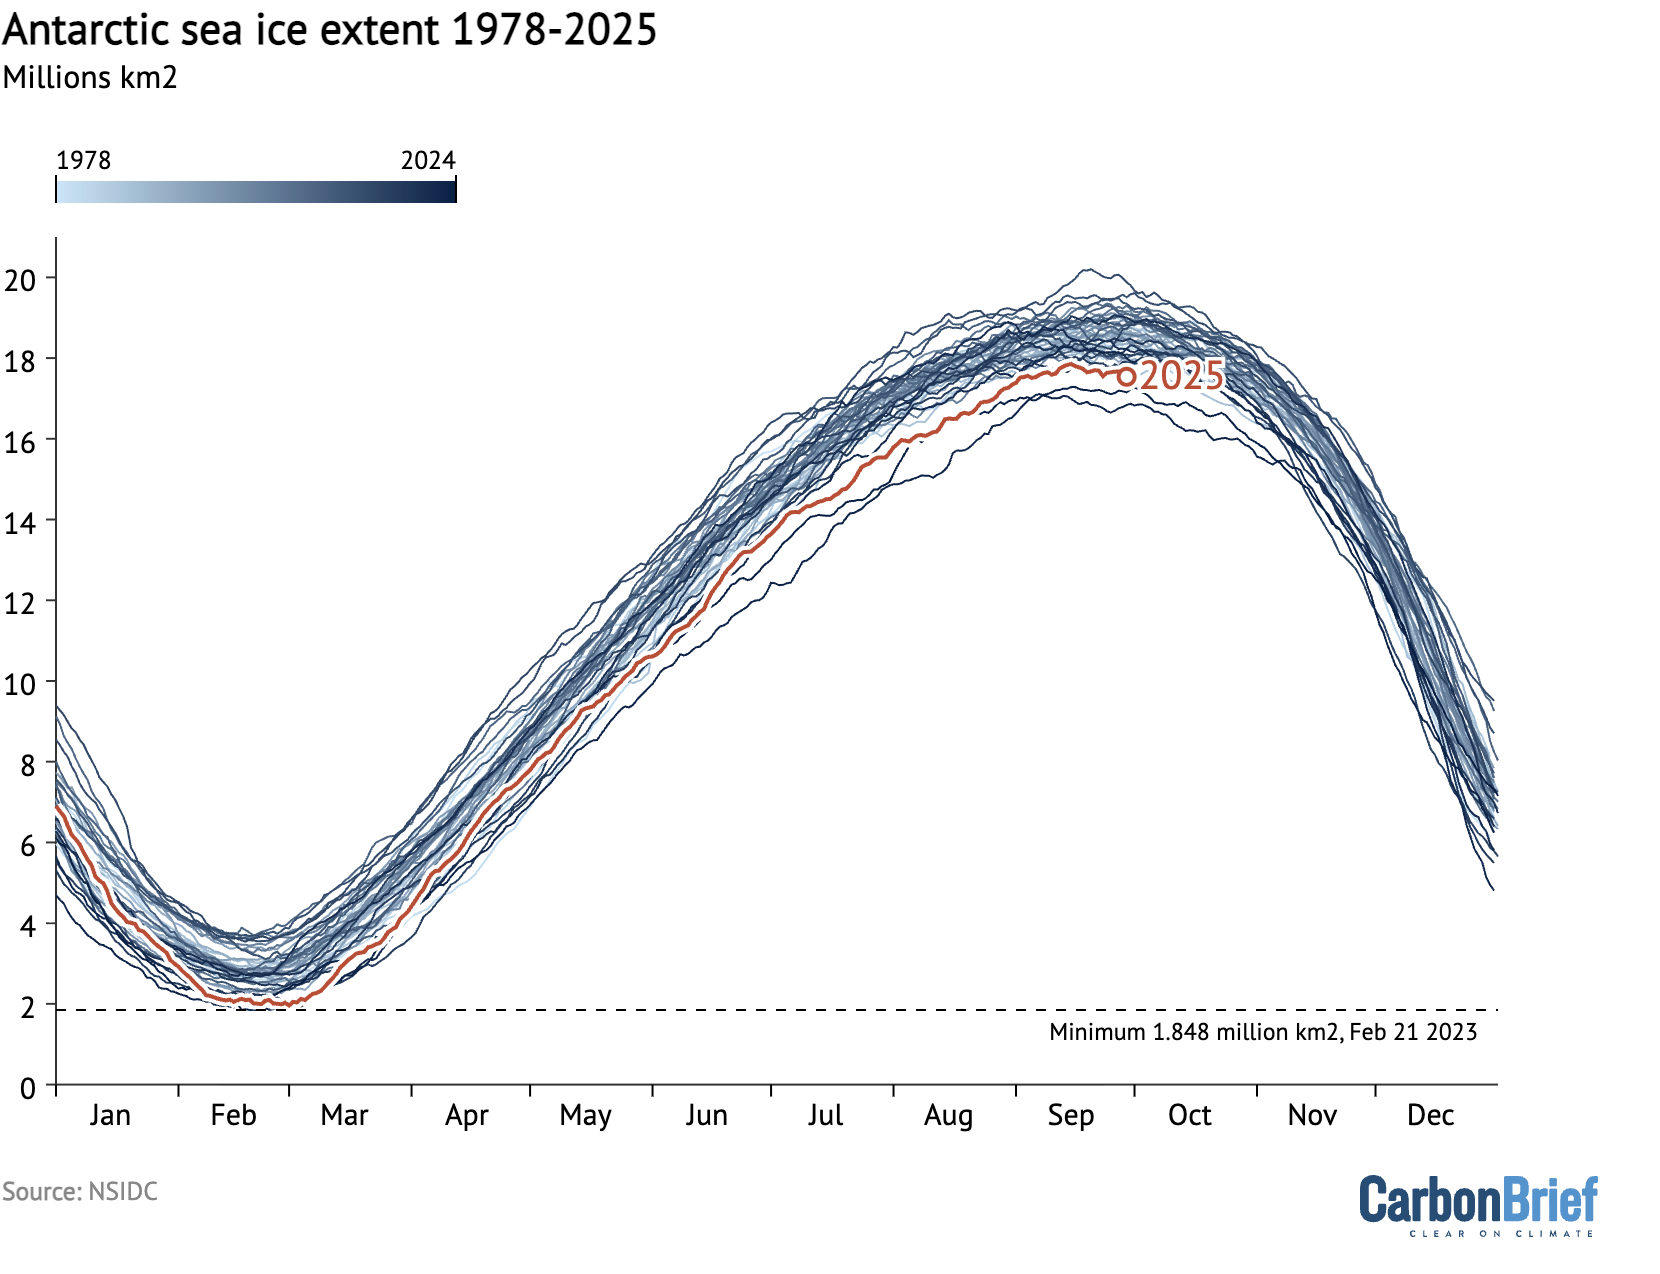
Antarctic sea ice has recorded its third-smallest winter peak extent since satellite records began 47 years ago, new data reveals.
Provisional data from the US National Snow and Ice Data Center (NSIDC) shows that Antarctic sea ice reached a winter maximum of 17.81m square kilometres (km2) on 17 September.
This is 900,000km2 below the 1981-2010 average maximum extent – the historical baseline against which more recent sea ice extent is typically compared.
According to one expert, the “lengthening trend of lower Antarctic sea ice poses real concerns regarding stability and melting of the ice sheet”.
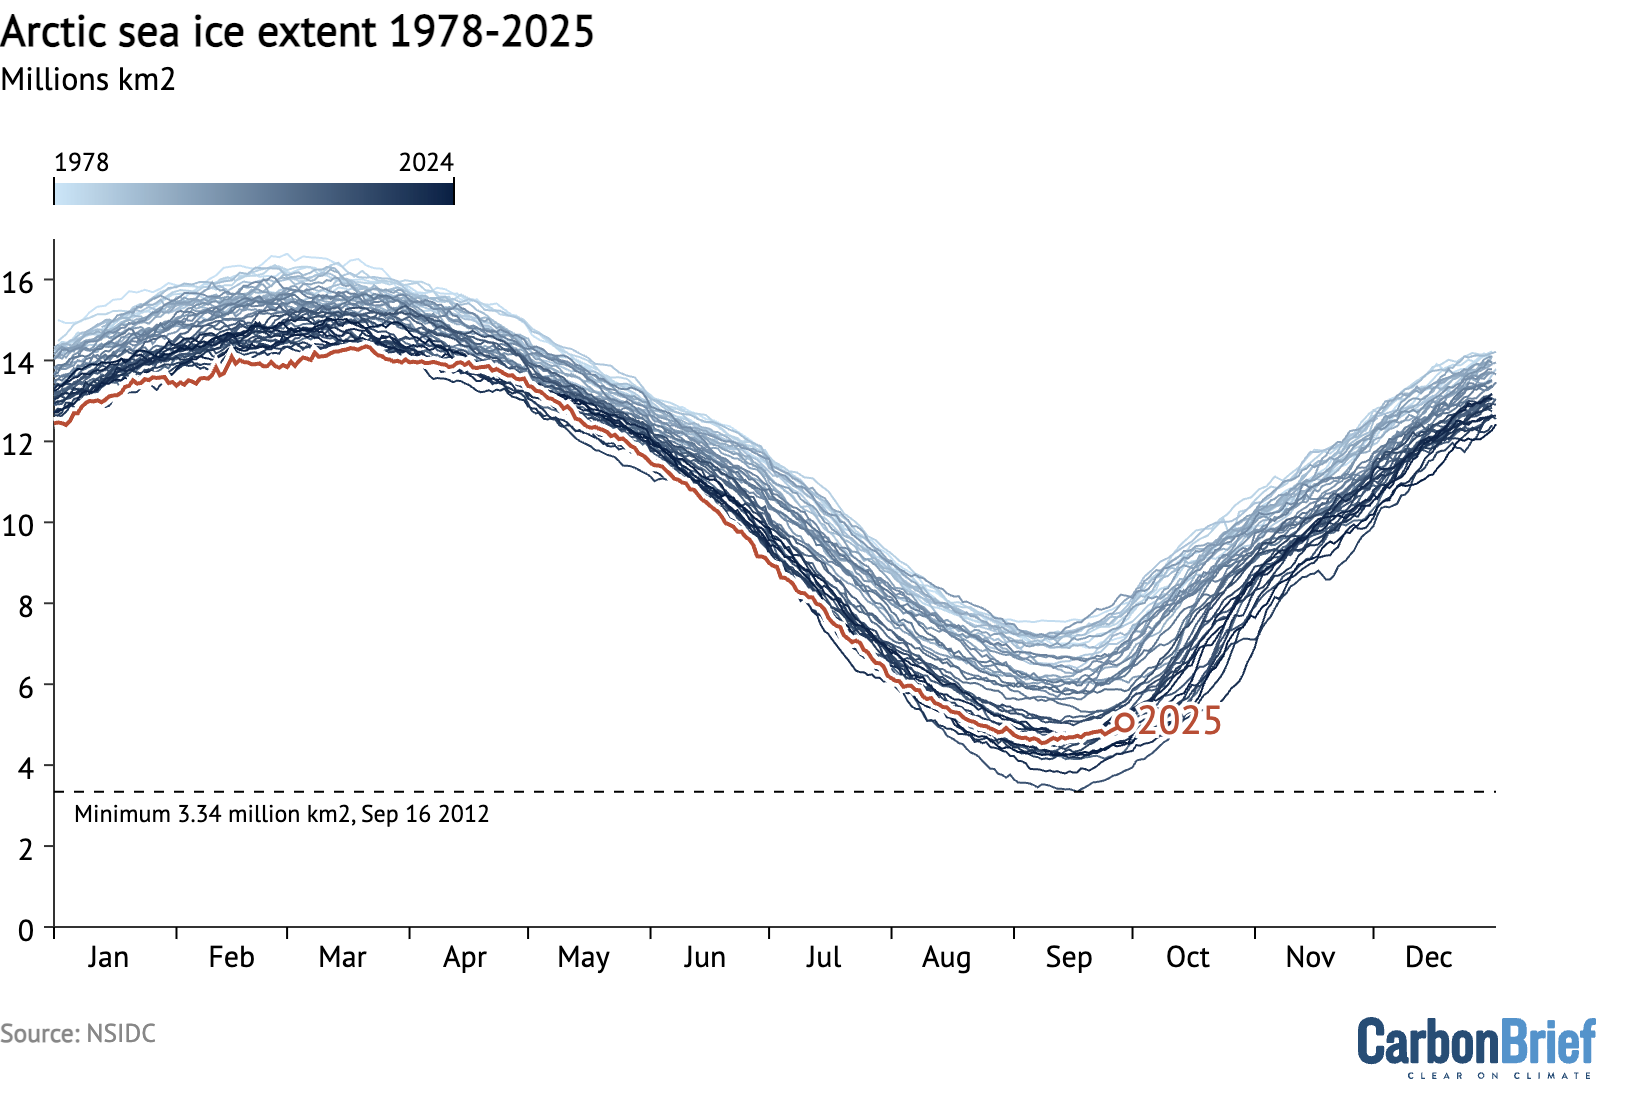
Meanwhile, at the Earth’s other pole, Arctic sea ice reached its annual minimum on 10 September, ranking as the joint-10th lowest in the satellite record.
At 1.6m km2, the 2025 minimum shares the spot with 2008 and 2010. The NSIDC notes that all 19 of the lowest sea ice extents in the record have occurred in the past 19 years.
Antarctic peak
For decades, scientists have been using satellite data to track the annual cycle of sea ice growth and melt at the world’s poles. This is a key way to monitor the “health” of sea ice in both the Arctic and Antarctic.
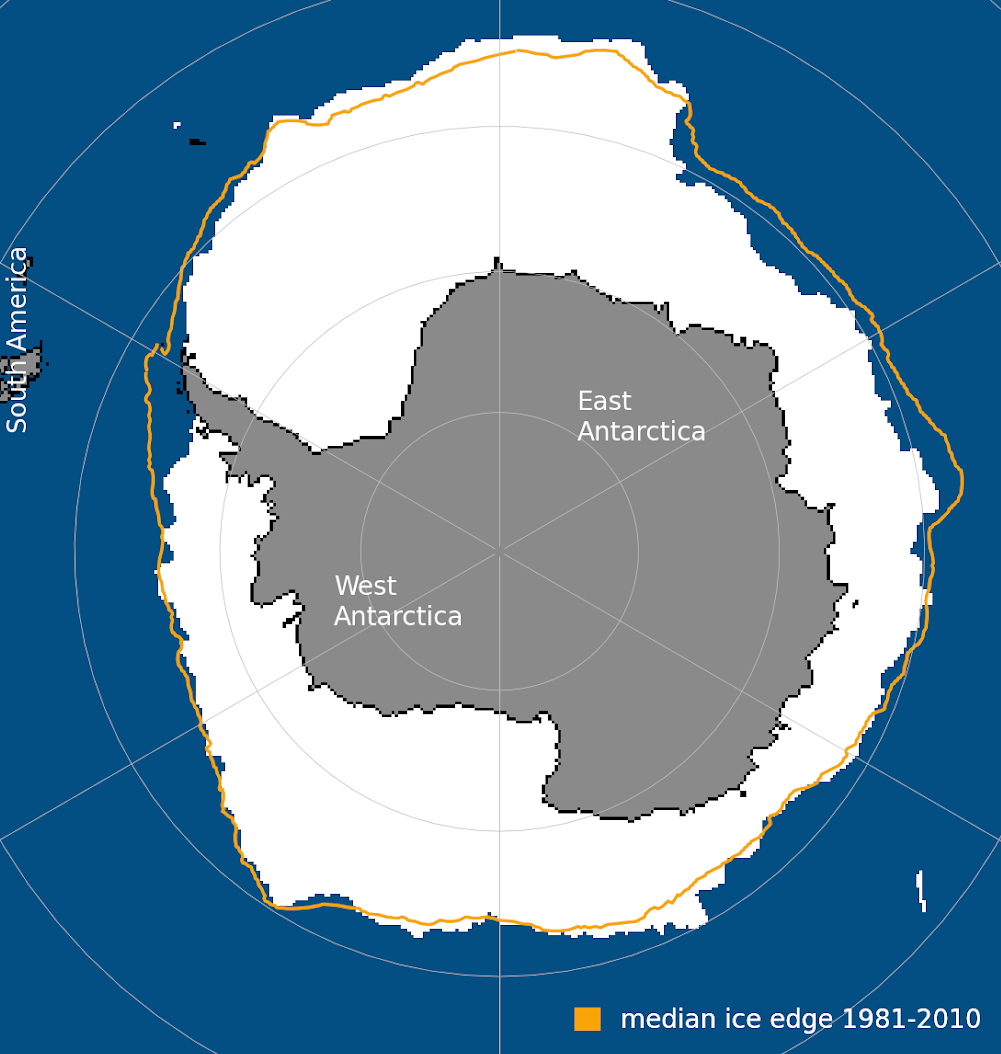
The map below shows Antarctic sea ice on the day of its maximum extent for the year on 17 September 2025, where the yellow line shows the 1981-2010 average.
The NSIDC says that sea ice extent was “markedly below average” in the Indian Ocean and the Bellingshausen Sea, but “slightly above average” over the Ross Sea.
In an NSIDC press release announcing the Antarctic maximum, Dr Ted Scambos, a senior research scientist at the Cooperative Institute for Research In Environmental Sciences, said:
“The lengthening trend of lower Antarctic sea ice poses real concerns regarding stability and melting of the ice sheet. However, it may also be leading to greater snowfall over the continent, which would slow the progression of sea level rise.”
Antarctic sea ice growth
In its typical annual cycle, Antarctic sea ice grows during winter towards its annual maximum extent in September or October. It then melts throughout the spring and summer towards its March minimum.
Earlier this year, Antarctic sea ice recorded its second-smallest summer minimum on record.
At 1.98m m2, this was the fourth consecutive year that Antarctic sea ice had fallen below 2m km2, the NSIDC noted.
In its monthly sea ice updates, the NSIDC reported that sea ice then grew at a “near-average pace”. During this period, sea ice “expanded rapidly” in the last areas to lose ice, including the Ross Sea and eastern Weddell Sea, it said.
The NSIDC explained that sea ice rebounded quickly in the Ross Sea area because ice extent had retreated “slowly” there the month before – meaning that the upper ocean layer did not have time to accumulate heat which would slow the winter freeze.
In April, “the situation in the Antarctic remained fickle”, the NSIDC said. At the beginning of the month, sea ice extent neared “record-low” daily extents, but as the month progressed ice cover expanded “fairly quickly”, it said.
May had “below average growth” in Antarctic sea ice and saw the fifth lowest record for Antarctic sea extent.
As June began, the the Bellingshausen Sea and eastern Queen Maud Lord regions were “far behind” in ice re-growth, it said, adding that the Bellingshausen Sea was almost entirely ice-free as temperatures were 6-8C above average.
In June, Antarctic sea ice was 1.28m km2 below the 1981-2010 baseline, with “particularly low” sea ice extent in the Bellingshausen Sea and the Indian Ocean sector, according to the NSIDC. This was the third-lowest sea ice extent ever recorded for the month of June, it said.
Throughout July, Antarctic sea ice extent grew at a “slower-than-average” rate, according to the NSIDC. By the end of the month, Antarctic sea ice extent was 1.3m km2 below the baseline, it noted.
Arctic melt season
In the Arctic, sea ice cover typically reaches its high point in March, before dropping to its September minimum at the end of the northern-hemisphere summer.
The 2025 Arctic sea ice winter peak was the smallest since satellite records began. The peak, recorded on 22 March, was 1.31m km2 below the average maximum for the 1981-2010 historical baseline.
In March, Arctic sea ice extent averaged 14.14m km2 – the lowest in the satellite record, according to the NSIDC. It noted that, at the time, average air temperature was above the historical baseline across much of the Arctic region.
Arctic sea ice extent then “changed very little” throughout April, remaining “nearly constant” until the final days of the month, the NSIDC reported.
It added that the final days of April saw Arctic sea ice extent drop due to ice retreat along the coast of the Barents Sea.
According to data, the main reason why the April total extent remained largely flat was due to an increase of sea ice in the northeastern Barents Seas that “offset” losses elsewhere.
Below-average air temperatures over the northern Norwegian and Barents Seas was the most “notable feature” of April 2025, the NSIDC said.
May was marked by a decline in Arctic sea ice extent at a faster-than-average pace, the NSIDC noted, resulting in the seventh-lowest May extent on record.
It added that ice loss in May was “primarily” in the Barents Sea, Bering Sea and the Sea of Okhotsk.
In June, Arctic sea ice extent averaged 10.48m km2 – the second-lowest average on record for the month, the NSIDC said. It noted that sea ice hit record-low levels over 20 June and 26 June and tracked at “near-record” low levels through the month. The Barents and Kara Seas were both “nearly ice-free” by the end June.
Hudson Bay ice extent was also “considerably below average” throughout June and northern parts of Baffin Bay were nearly ice-free, it said.
By the end of July, daily sea ice extent in the Arctic had fallen to 7.66m km2 – the third lowest in the satellite record, the NSIDC reported. It noted that, for most of the month, Arctic sea ice extent tracked close to levels recorded for 2012 – the year in which Arctic sea ice extent reached its lowest-ever September minimum.
Throughout August, the NSIDC reported that sea ice “rapidly melted and compacted” north of Alaska in the Beaufort Sea, with sea ice extent averaging at 5.41m km2 – the seventh lowest on record.
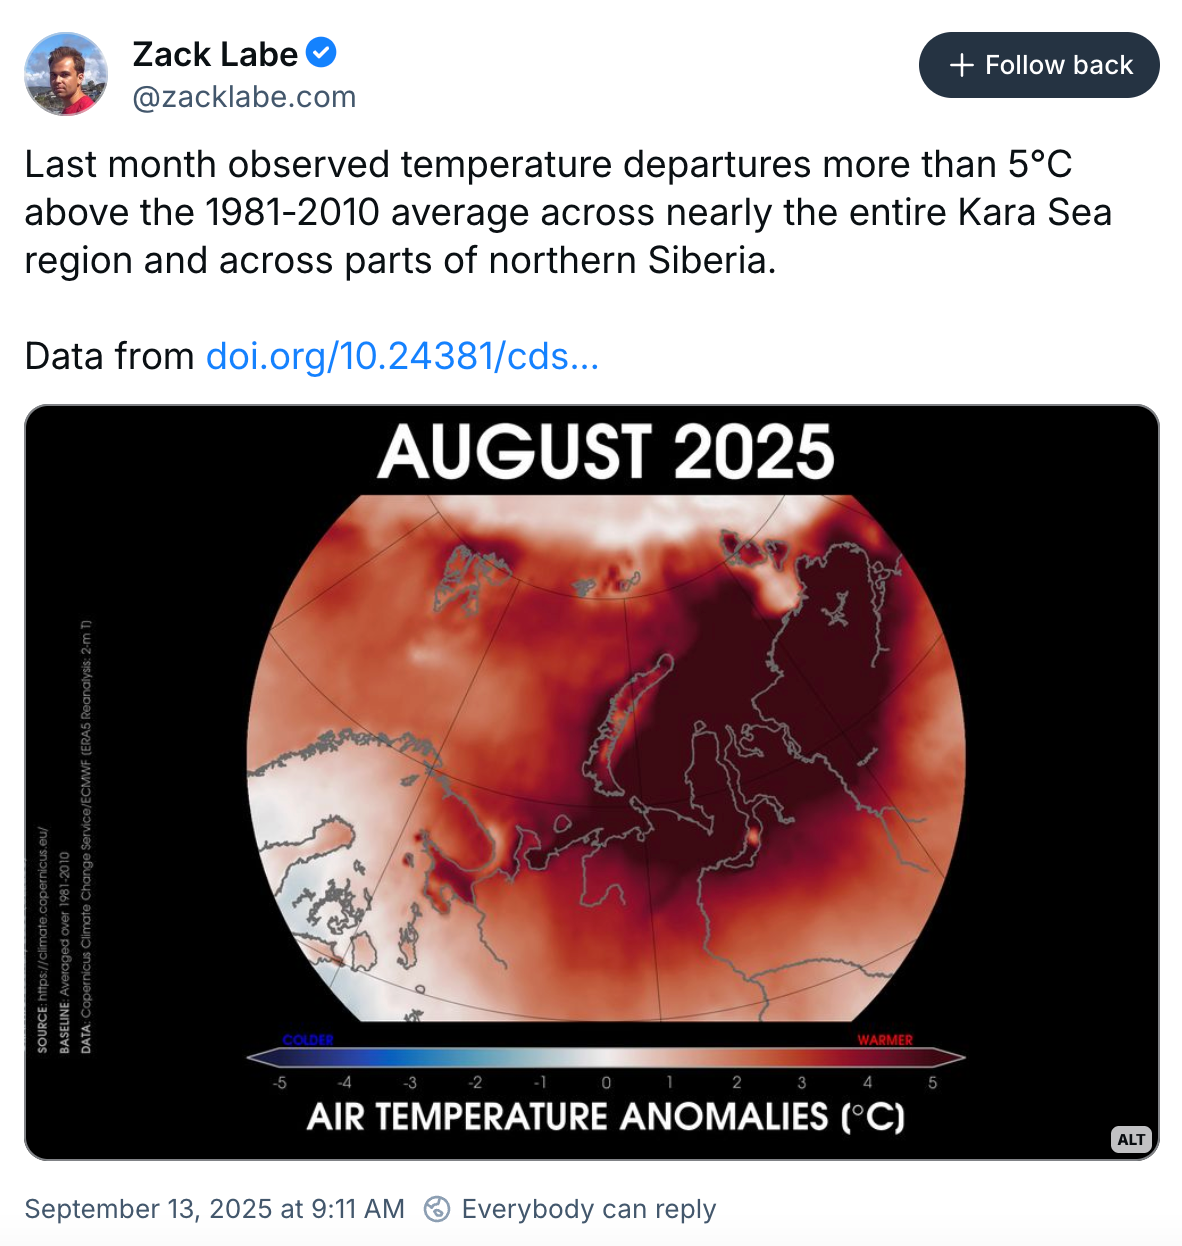
Dr Zack Labe – a climate scientist at Climate Central – tells Carbon Brief that northern Siberia saw August air temperatures more than 5C above the 1981-2010 average, resulting in “a striking amount of open water along the Atlantic side of the Arctic that would normally be ice-covered”.
At an annual minimum of 1.6m km2, this year’s Arctic minimum is “pretty unremarkable”, Labe tells Carbon Brief, and “adds to the evidence of a clear slowdown in the rate of summer Arctic sea ice loss”.
However, Labe stresses that this is “not surprising” – referencing a recent study which “clearly shows how internal variability can temporarily drive periods of slower melt in a warming climate, as well as periods of rapid melt, such as in the early 2000s”. (For more on this research, read Carbon Brief’s guest post).
He adds:
“It is only a matter of time before summertime melt accelerates again. This is not a good news story, especially since in many other months we still see a clear downward trend…
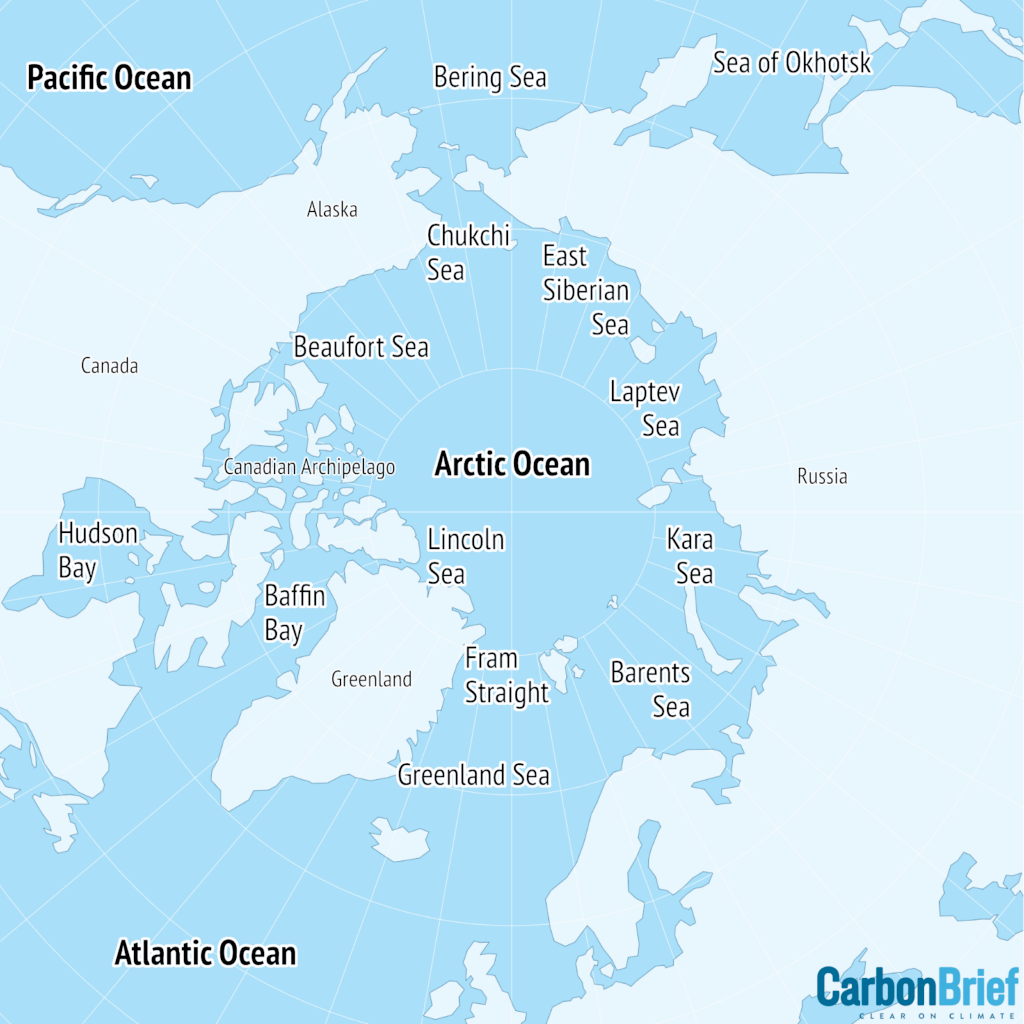
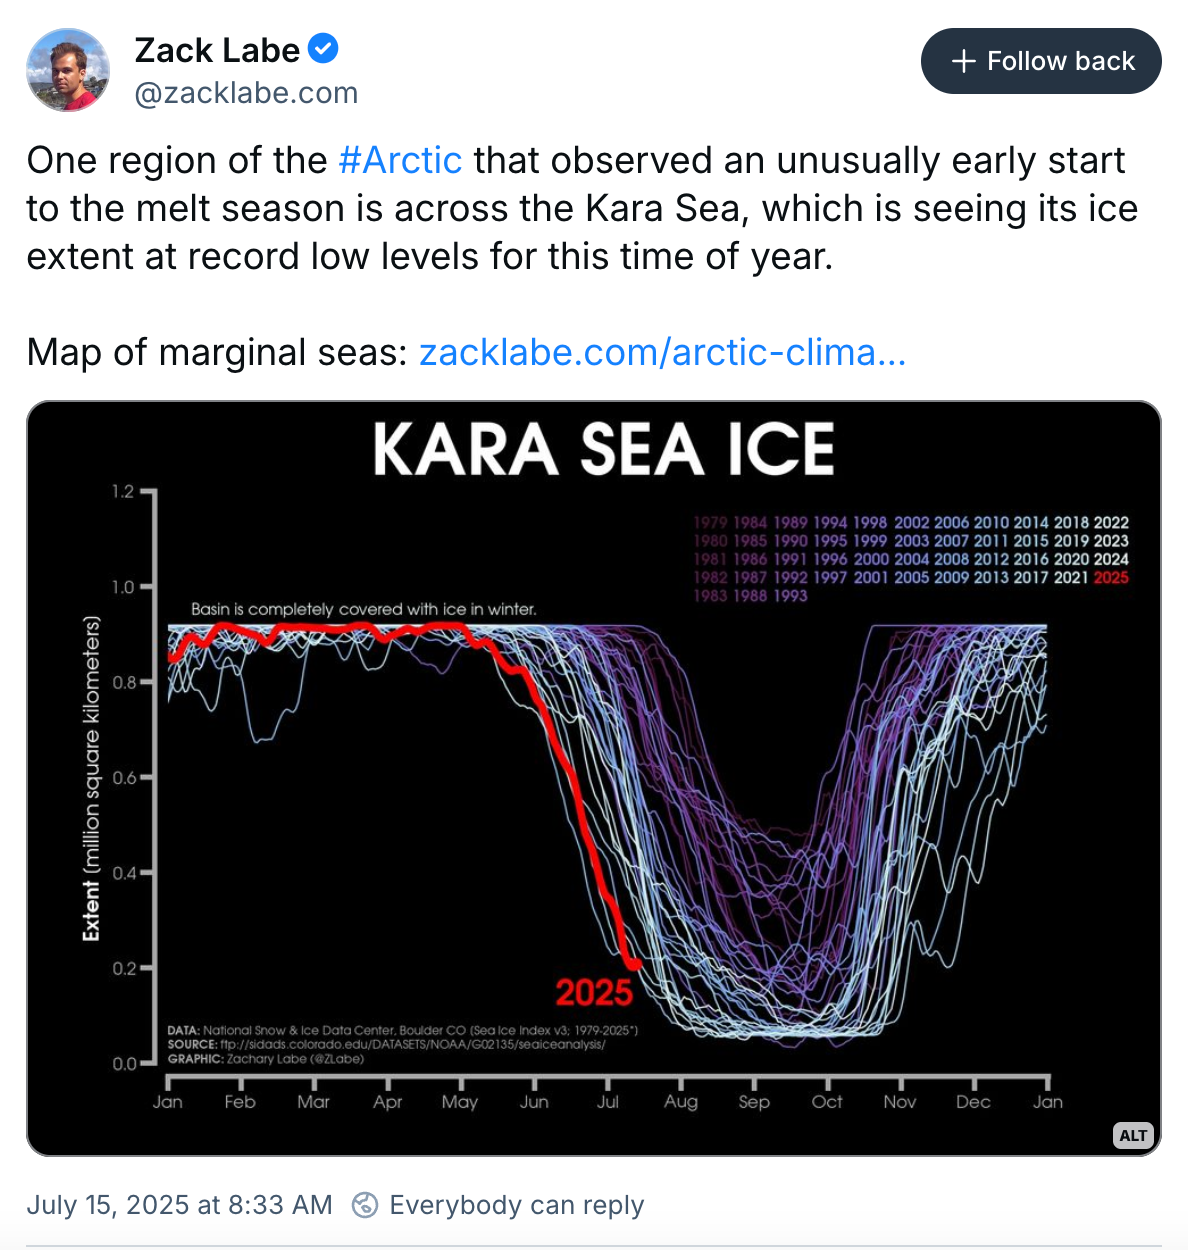
“While the past decade of summers may give the appearance of a slowdown, regional extremes such as in the Kara Sea this year underscore that the Arctic is already radically different from past decades. The driver is clear – human-caused climate change.”
Satellite switch
For decades, NSIDC has tracked sea ice using data from weather satellites run by the US Navy. However, earlier this year, Mongabay reported that NSIDC scientists “noticed holes in the data they were receiving”.
The article explains:
“When scientists inquired with the Department of Defense (DoD), they were told not all data were being downloaded and access to the data had been deprioritised. Soon after, the DoD said it would stop sharing…data altogether, citing military cybersecurity risks in the old systems.”
NSIDC scientist Walt Meier told Science that while the US satellites “are up there and functioning…we’re not getting all the data anymore, at least regularly”.
The DoD then set a cut-off date to “cease distribution data from the Defense Meteorological Satellite Programme” on 31 July.
In June, the NSIDC announced that it would “explore switching to a different sensor” aboard a Japanese satellite that was launched in 2012.
The only other option available to NSIDC was a “series of Chinese weather satellites, which the country is already using to produce its own record of sea ice”, Science noted. It added that a new US DoD weather satellite, launched last year, is “also capable of collecting similar data, but its data have not yet been made public”.
The switch was completed by the July cut-off date and NSIDC reprocessed all data for 2025 to use the new data source to ensure “consistency through the year”.
Guest post: How atmospheric rivers are bringing rain to West Antarctica
Antarctic sea ice maximum in 2024 is ‘second lowest’ on record
Antarctic sea ice ‘behaving strangely’ as Arctic reaches ‘below-average’ winter peak
Original article by Svetlana Onye and Ayesha Tandon republished from Carbon Brief under a CC license.