Two-thirds of global warming since 1990 caused by world’s ‘wealthiest 10%’
Original article by Ayesha Tandon republished from Carbon Brief under a CC license.
The “wealthiest 10%” of people on the planet are “responsible” for 65% of the 0.61C increase in global average temperatures over 1990-2020, according to new research.
The study, published in Nature Climate Change, uses a field of climate science called “attribution” to determine the contribution of the world’s “wealthiest population groups” to climate change through the greenhouse gases they emit.
The authors also calculate the contribution of these high-income groups to the increasing frequency of heatwaves and droughts.
For example, the study finds the wealthiest 10% of people – defined as those who earn at least €42,980 (£36,605) per year – contributed seven times more to the rise in monthly heat extremes around the world than the global average.
In another finding, the Amazon rainforest faced a threefold increase in the likelihood of droughts over the period studied, most of which was driven by the wealthiest 10% of the world’s population.
The authors also explore country-level emissions, finding that the wealthiest 10% in the US produced the emissions that caused a doubling in heat extremes across “vulnerable regions” globally.
One scientist not involved in the study tells Carbon Brief that efforts to attribute global warming to individual income groups is an “important step towards targeted policies” and could support climate litigation.
Emissions inequality
Humans emit more than 40bn tonnes of CO2 into the atmosphere every year. Developed countries are responsible for the majority of global emissions, as a result of the typically more carbon-intensive lifestyles of their residents.
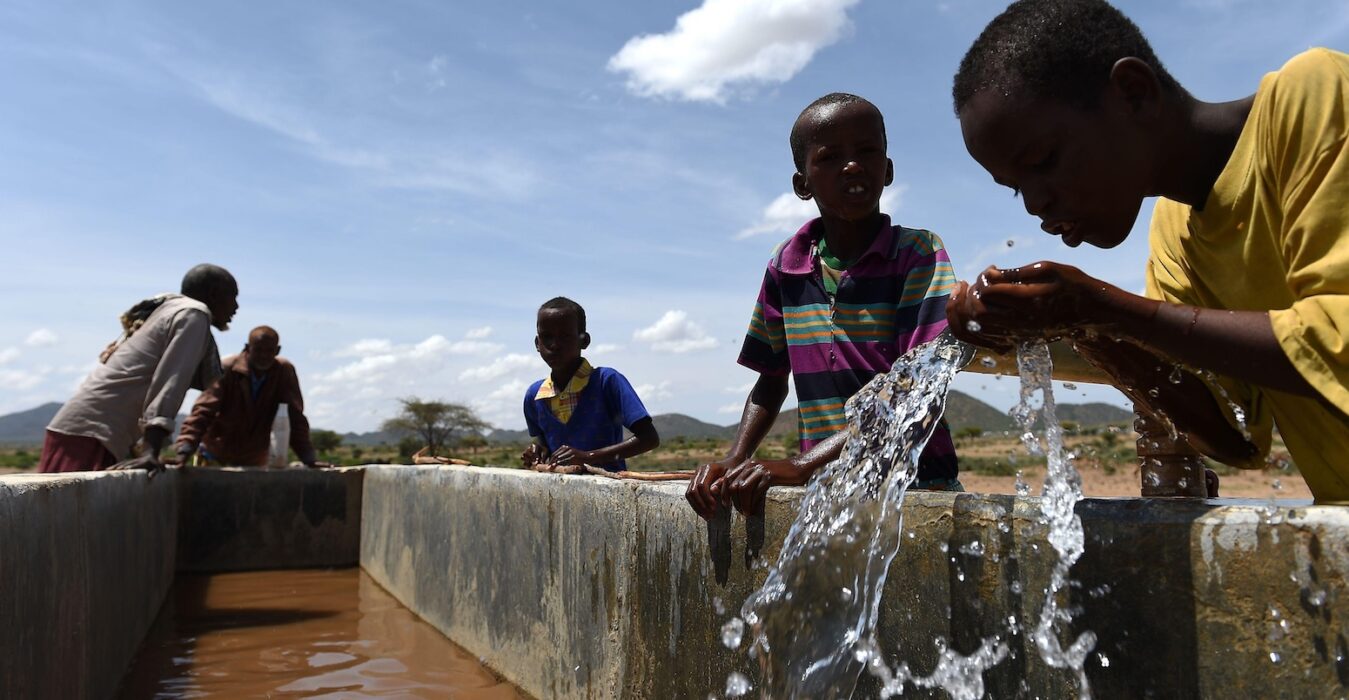
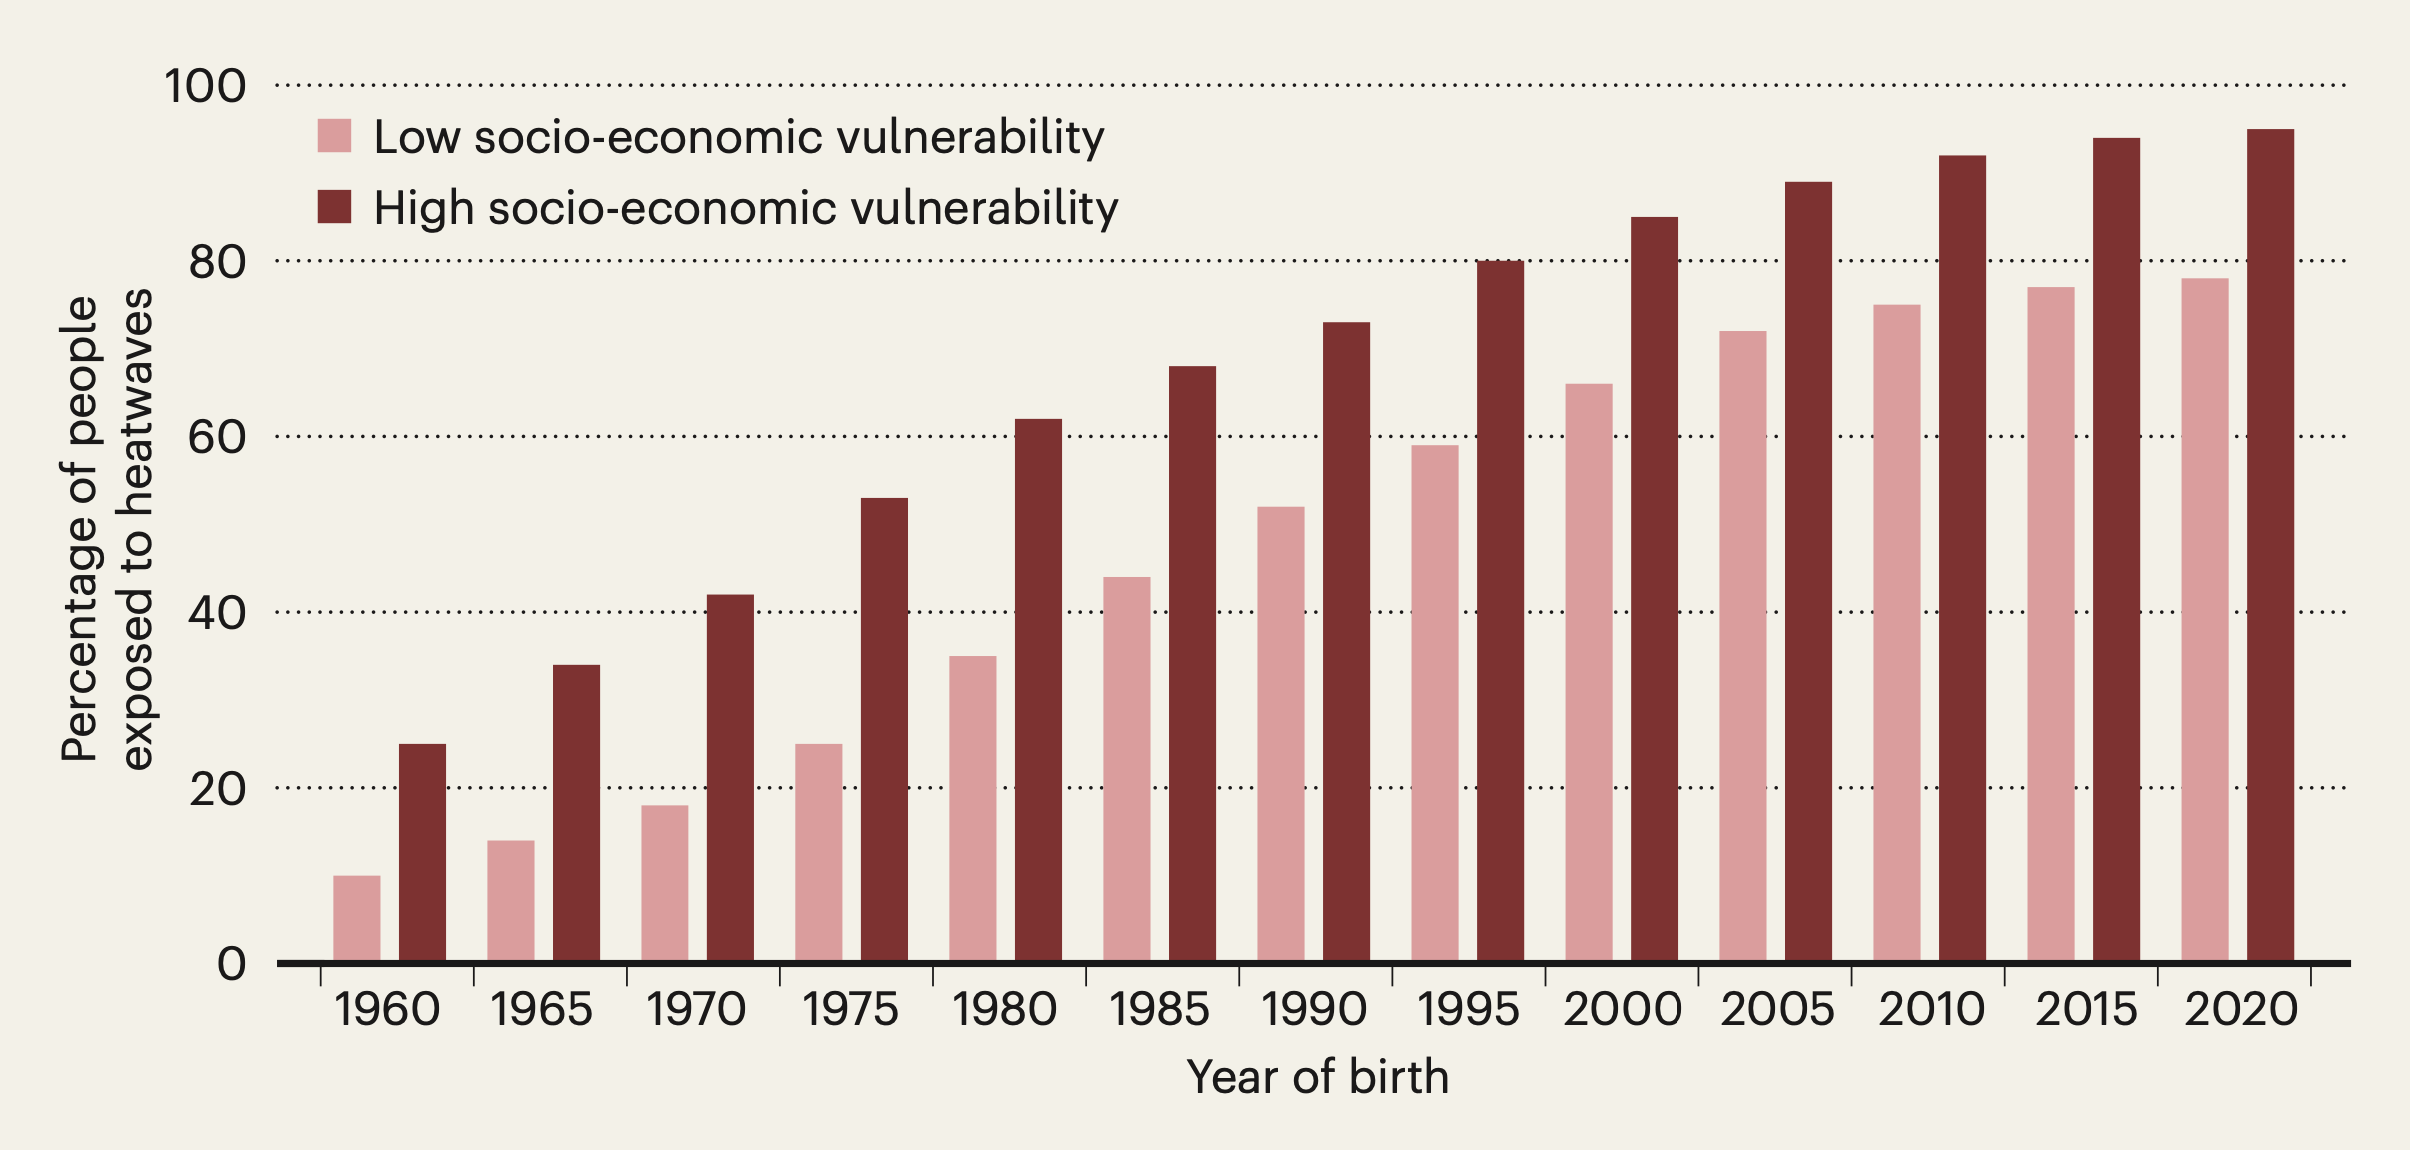
Meanwhile, the most severe impacts of climate change are disproportionately felt by the poorest and most vulnerable people.
The new study uses an income and wealth inequality dataset from the World Inequality Database to track inequality over 1990-2019, showing how much the world’s wealthiest 10%, 1% and 0.1% of society have contributed to warming over 1990-2020. (For details on the method, see the modelling inequalities section below.)
The world’s wealthiest 10% all earn more than €42,980 (£36,605) per year, according to the database. Meanwhile, the world’s wealthiest 0.1% earn more than €537,770 (£458,011) per year.
Of the 0.61C increase in global average temperatures over 1990-2020, the authors estimate that 65% was due to the emissions of the wealthiest 10% of people on the planet. For the wealthiest 0.1%, the estimate is 8%.
The graph below shows how much global temperatures would have risen over 1990-2020 if everyone in the world emitted as much as the world’s poorest 50% (purple), middle 40% (green), richest 10% (orange), richest 1% (blue) and richest 0.1% (pink) people. The grey bar shows how much global temperatures actually rose.
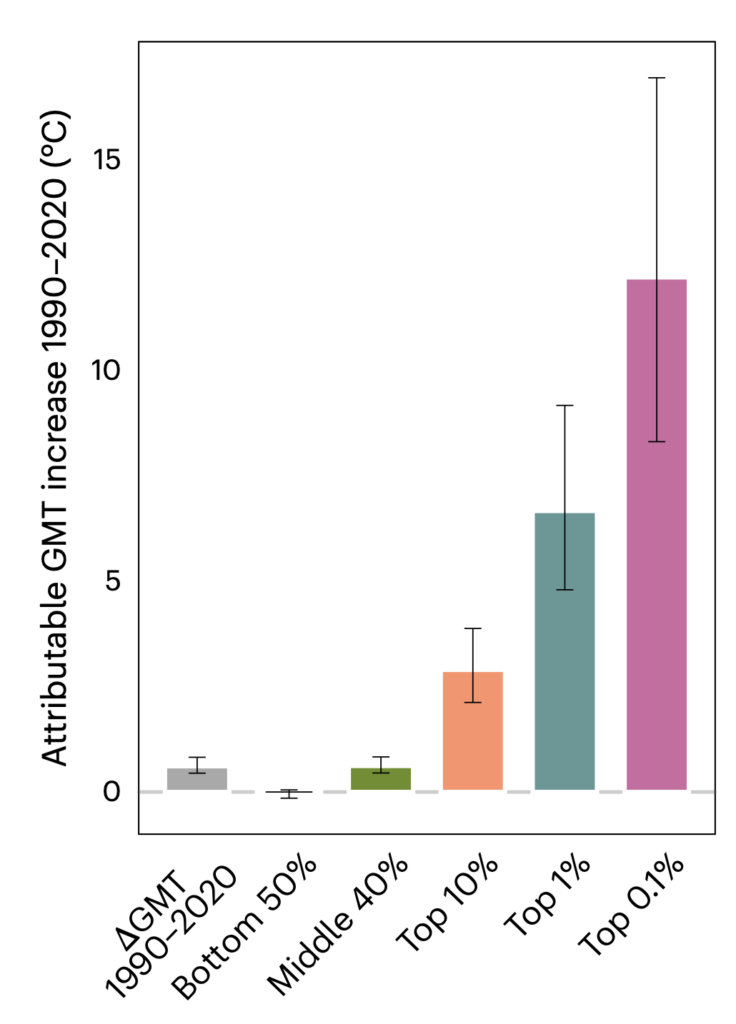
How global temperatures would have risen if everyone in the world emitted the world produced the same amount of emissions, on average, as individuals in the bottom 50% (purple), middle 40% (green), top 10% (orange), top 1% (blue) and top 0.1% (pink) of the world’s emitters. Source: Schöngart et al (2025).
The authors find that if the whole world had emitted as much as the wealthiest 10% of people over 1990-2020, global average temperatures would have risen by 2.9C, instead of 0.61C. If the global population had emissions as large as the wealthiest 0.1%, temperatures would have risen by 12.2C.
Meanwhile, the study calculates that if the whole world had emissions as low as the poorest 50%, global temperatures would have remained close to 1990 levels.
Hot and dry extremes
As greenhouse gas emissions cause the climate to warm, extreme weather events such as heatwaves and droughts are becoming more intense, frequent and long-lasting.
The authors use attribution – a field of climate science that aims to identify the “fingerprint” of global warming on these events – to determine the contribution of the emissions of the world’s wealthiest people to the increasing frequency of heatwaves and droughts.
The authors assess “extremely hot” and “extremely dry” months, defined as the most extreme 1% of months in a pre-industrial climate during the hottest month of the year regionally. (In a pre-industrial climate, only one of each extreme would be expected every 100 years on average.)
The graphs below show the number of additional heatwaves (left) and droughts (right) that have occurred since 1990 due to climate change in different regions of the world.
The full bar shows the total number of additional heatwaves due to human-cased climate change in each region. The green bar shows additional occurrences due to the wealthiest 1%. The green and orange bars combined show the wealthiest 10%.
The numbers in green and orange show how much the wealthiest 1% and 10% of the planet contributed to the extreme, compared to the global average. (For example, an orange number of 7.0 means that the wealthiest 10% of people contributed seven times more to the extreme event than the global average.)
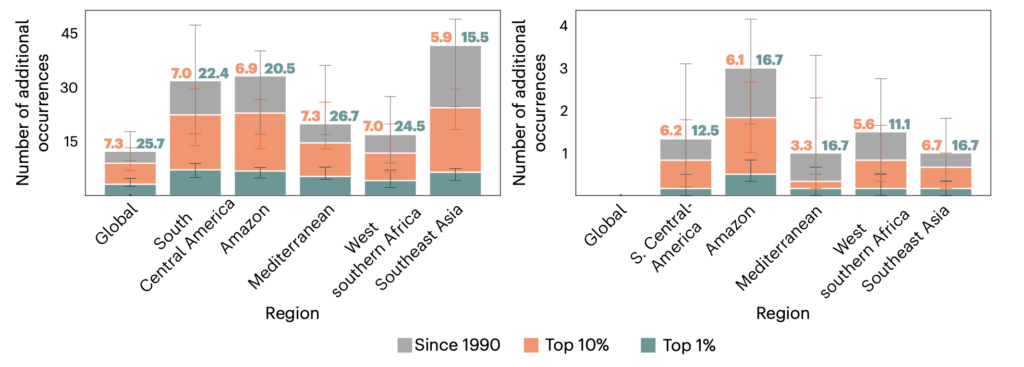
The study finds that an average of 11.5 additional heat events observed in August – the month where the rise in heat extremes is, on average, most pronounced – are attributable to the wealthiest 10%.
It also calculates that emissions from this group resulted in, on average, an additional 2.3 droughts in the Amazon in October – the month with the strongest attributable drying trend in the region.
Highest emitters
The authors also assess the contributions of the wealthiest people to climate extremes on a country level, identifying the US, the EU, China and India as the world’s four highest emitting regions.
The graphic below shows the increase in frequency of one-in-100 year peak summer heat extremes in selected regions attributable to the wealthiest 10% of people (left) and 1% of people (right) in China (red), the US (pink), the EU (peach) and India (blue).
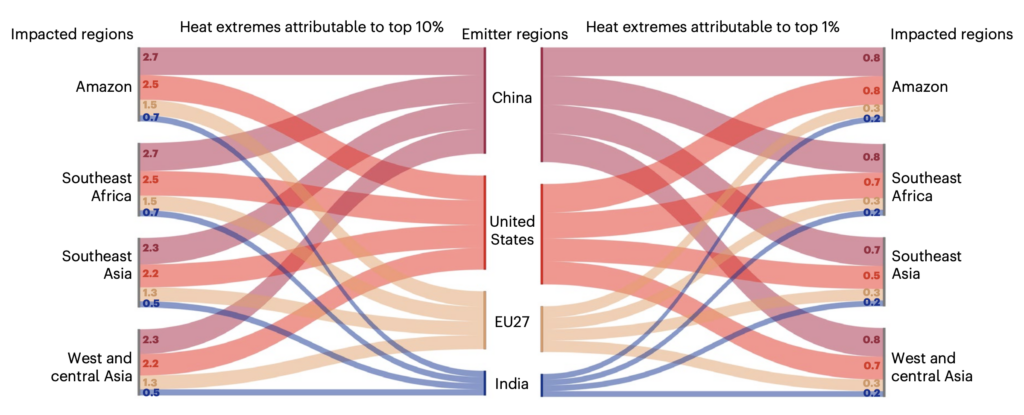
Emissions from the wealthiest 10% in the US resulted in an average of 1.3 extra heat events globally, the authors find. However, this increase is distributed unevenly across the globe.
For example, the authors find this income group was responsible for the emissions that contributed to 2.7 additional heat events in “heat-affected areas” such as the Amazon and south-east Africa.
Emissions from the wealthiest 10% of people in the EU resulted in an additional 1.5 heatwaves in both the Amazon and south-east Africa.
Meanwhile, the Amazon faces 2.1 more heat extremes in 2020 than in 1990 due to the emissions of the richest 1% in the US, China, EU and India.
While inequalities between one country or region and another are well documented, it should also be noted that “inequalities within developing countries are increasing”, Dr Carl Schleussner, study author and leader of the integrated climate impacts research group at the International Institute for Applied Systems Analysis (IIASA), tells Carbon Brief.
For example, he notes that the paper shows “very high levels” of emissions from “the Chinese middle and upper classes”.
However, he says that many existing global frameworks to address climate change “treat countries as a whole” and fail to “differentiate” between income groups within countries.
Schleussner argues that the study highlights the need for “progressive policies” for climate action, which involve “tackling particularly high emitters” in all countries.
Dr Sarah Schöngart, a researcher at ETH Zurich and lead author of the study, tells Carbon Brief that studies such as this could provide important evidence in loss and damage litigation.
Prof Jakob Zscheischler, an Earth system scientist at the Helmholtz Centre for Environmental Research who was not involved in the study, also highlights the ways the findings could be used in climate-change lawsuits. He tells Carbon Brief:
“Quantifying the contribution of individual income groups to global warming and changes in climate extremes is an important step towards targeted policies and further supports climate litigation. Supporting climate injustice with concrete numbers will hopefully help the most vulnerable and least responsible strengthen their case.”
Modelling inequalities
The study uses a range of methods to attribute changes in heat and drought to the emissions of particular wealth groups. To model global greenhouse gas emissions by wealth group, the paper uses a “wealth-based carbon inequality assessment” from a 2022 study.
(See Carbon Brief’s coverage of the 2022 study.)
The study uses income and wealth inequality dataset from the World Inequality Database to track inequality over 1990-2019. It combines economic data with information on per-capita carbon footprints – calculated using “input-output” methodologies combined with data from the “distributional national accounts” project.”
The model considers three factors. The first is private consumption – made up of emissions from the direct use of fossil fuels and emissions embedded into goods and services. The second includes emissions from government spending in that person’s country – such as government administration, public roads or defence. The final component of a person’s carbon footprint is from their investments.
The authors then created a series of “counterfactual” emissions pathways, which imagine the world without the emissions of the wealthiest 10%, 1% and 0.1% of society, respectively. The emissions pathways include CO2, methane and nitrous oxide emissions, expressed as CO2-equivalent.
Lead author Schöngart tells Carbon Brief that including methane in the models is important, because it has “really high potency and near-term warming”. However, she notes that the team needed to make some assumptions about methane emissions – for example, assuming that each income group emits the same relative amount of methane compared to other greenhouse gas emissions.
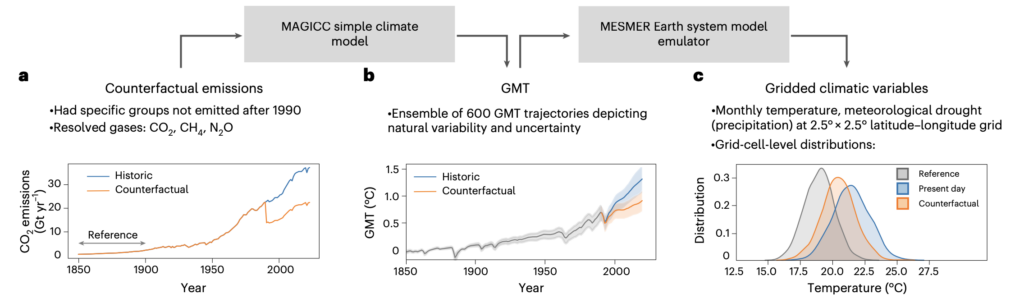
Using a “simple” climate model called MAGICC, the authors model global average temperatures under these counterfactual emissions pathways. This allows them to calculate how much the planet would have warmed over 1990-2020 without the emissions of the 10%, 1% and 0.1% of society, respectively.
The authors use the global average temperature trends to produce temperature and rainfall data for every land-based grid square on Earth via a climate model emulator called MESMER.
Schöngart tells Carbon Brief that an emulator is “an approximation of an Earth system model” which “allows us to generate incredible amounts of data”, while using less computing power and taking less time to run.
The study authors then use attribution methods to identify how the emissions from the world’s wealthiest members of society have affected the frequency of heatwaves and droughts, by comparing the world as it is to a “counterfactual” world without human-caused climate change.
The graphic below shows these steps.
Earth system scientist Zscheischler praises the methods in the study. He tells Carbon Brief that “the main innovation of work lies in its novel combination of relatively simple emulators that capture the most important relationships between emissions and global warming and changes in extremes”.
He adds that emulators have been evaluated in other studies and are “trustworthy for this type of delicate analysis”.
Prof Wim Thiery – an associate professor at Vrije Universiteit Brussel, who was not involved in the study – also commends the use of emulators. He tells Carbon Brief that “producing the information presented in this study with a suite of full-blown Earth system models is impossible from a computational cost and human effort perspective”.
Original article by Ayesha Tandon republished from Carbon Brief under a CC license.