Original article by Lauri Myllyvirta republished from Carbon Brief under a CC license.

For the first time, the growth in China’s clean power generation has caused the nation’s carbon dioxide (CO2) emissions to fall despite rapid power demand growth.
The new analysis for Carbon Brief shows that China’s emissions were down 1.6% year-on-year in the first quarter of 2025 and by 1% in the latest 12 months.
Electricity supply from new wind, solar and nuclear capacity was enough to cut coal-power output even as demand surged, whereas previous falls were due to weak growth.
The analysis, based on official figures and commercial data, shows that China’s CO2 emissions have now been stable, or falling, for more than a year.
However, they remain only 1% below the latest peak, implying that any short-term jump could cause China’s CO2 emissions to rise to a new record.
Other key findings include:
- Growth in clean power generation has now overtaken the current and long-term average growth in electricity demand, pushing down fossil fuel use.
- Power-sector emissions fell 2% year-on-year in the 12 months to March 2025.
- If this pattern is sustained, then it would herald a peak and sustained decline in China’s power-sector emissions.
- The trade “war” initiated by US president Donald Trump has prompted renewed efforts to shift China’s economy towards domestic consumption, rather than exports.
- A new pricing policy for renewables has caused a rush to install before it takes effect.
- There is a growing gap that would need to be bridged if China is to meet the 2030 emissions targets it pledged under the Paris Agreement.
If sustained, the drop in power-sector CO2 as a result of clean-energy growth could presage the sort of structural decline in emissions anticipated in previous analysis for Carbon Brief.
The trend of falling power-sector emissions is likely to continue in 2025.
However, the outlook beyond that depends strongly on the clean energy and emissions targets set in China’s next five-year plan, due to be published next year, as well as the economic policy response to the Trump administration’s hostile trade policy.
China’s emissions decline due to clean power
Over the past decade, China’s CO2 emissions from fossil fuels and cement have risen by nearly a fifth, but there have been ups and downs along the way.
The shallow decline in 2015 and 2016 was due to a slump that followed a round of stimulus measures, while zero-Covid controls caused a sharper fall in 2022. Overall, however, emissions have continued to increase, pausing only during periods of economic stress.
More recently, there have been signs that China’s CO2 emissions could be close to reaching a peak and plateau, or even a period of structural decline.
The latest data, for the first quarter of 2025, shows that China’s CO2 emissions have now been stable or falling for more than a year, as shown in the figure below.
However, with emissions remaining just 1% below the recent peak, it remains possible that they could jump once again to a new record high.
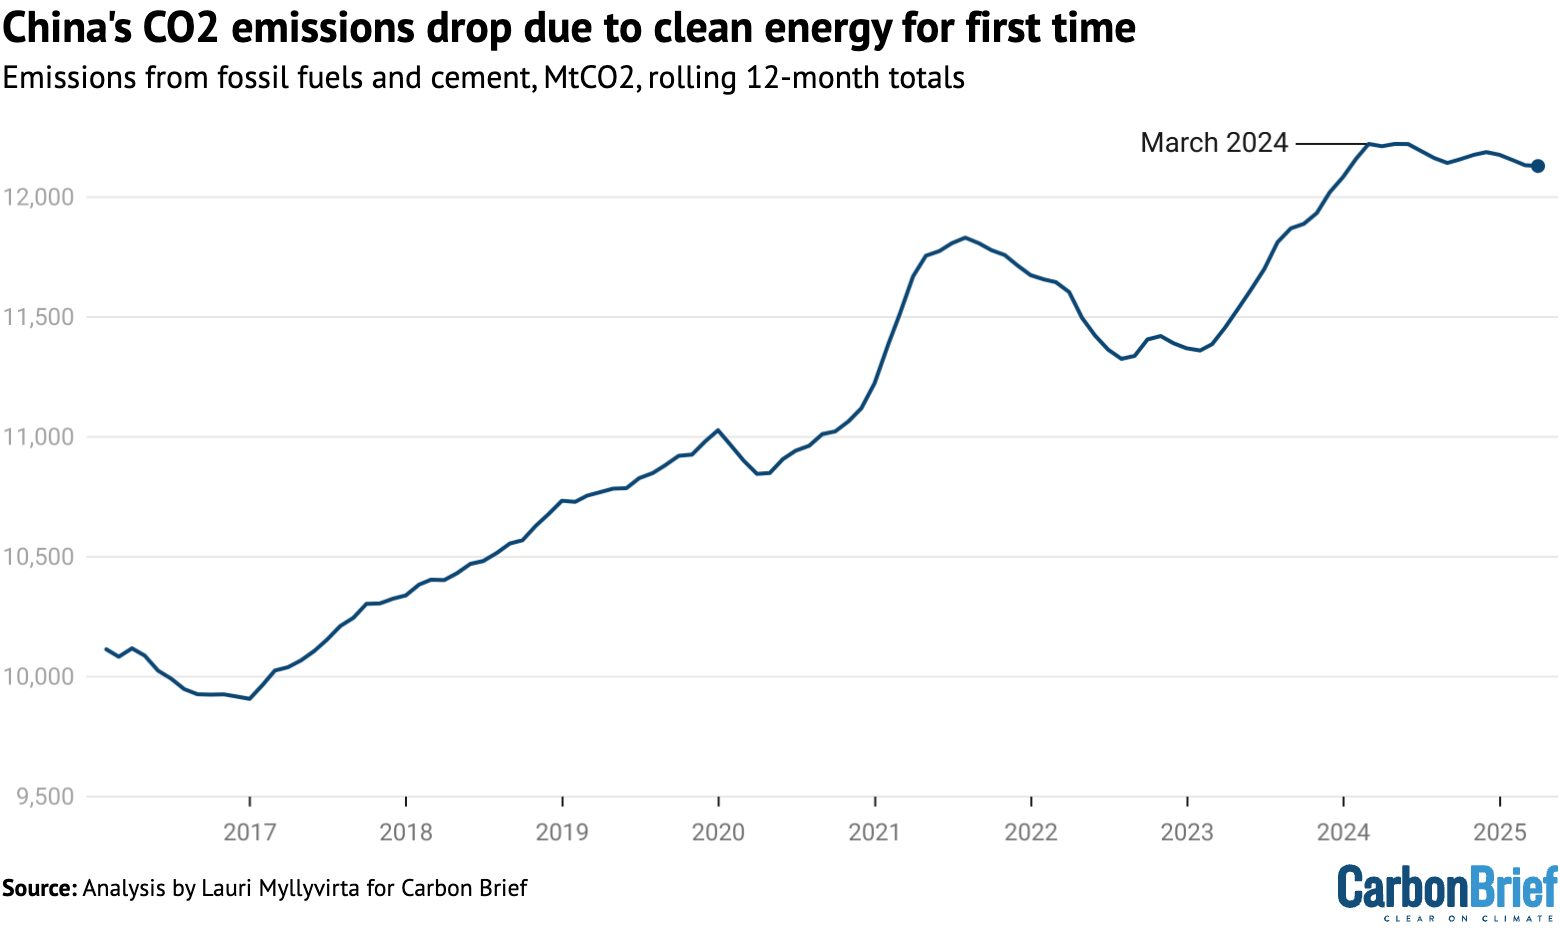
Therefore, the future path of China’s CO2 emissions hangs in the balance, depending on trends within each sector of its economy, as well as China’s response to Trump’s tariffs.
These sectoral trends are explored further in the sections below, along with signals on what could be coming next from Chinese policymakers as they consider the country’s international climate pledge for 2035 and the five-year plan for 2026-2030.
Power-sector emissions fall while other sectors rebound
The reduction in China’s first-quarter CO2 emissions in 2025 was due to a 5.8% drop in the power sector. While power demand grew by 2.5% overall, there was a 4.7% drop in thermal power generation – mainly coal and gas.
Increases in solar, wind and nuclear power generation, driven by investments in new generating capacity, more than covered the growth in demand. The increase in hydropower, which is more related to seasonal variation, helped push down fossil power generation.
Power-sector emissions fell by more than total generation from fossil fuels, as the share of biomass and gas increased, while average coal power plant efficiency improved.
Specifically, the average amount of coal needed to generate each unit of electricity at coal-fired power plants fell by 0.9% year-on-year.
The first-quarter reduction in CO2 emissions from coal use in the power sector is shown at the bottom of the figure below, below CO2 changes in other sectors.

Outside of the power sector, emissions increased 3.5%, with the largest rises in the use of coal in the metals and chemicals industries.
The coal-to-chemicals industry is undergoing rapid expansion, driven by concerns about dependence on imported oil and gas. During the first quarter of 2025, it was also benefiting from more favourable economics due to lower coal prices and relatively high oil prices.
Crude steel production increased 0.6% year-on-year, metal products output by 6% and non-ferrous metals production by 2%. All of these increases were mainly due to a jump in March. Metals demand was boosted by the bump in exports ahead of the tariffs, but high output has continued well into April.
Real-estate construction “starts” fell by 24% and sales of new properties by 3%, indicating that the demand for cement, steel and glass from the construction sector continues to decline.
In contrast, economic output in vehicle and machinery production increased by 12% and 13%, respectively, signalling increased demand for metals.
Cement production fell by 1.4%, a slower rate of decrease than in previous years, likely due to an earlier start to weather-dependent construction activity thanks to warm weather.
Gas consumption increased by an estimated 6% in the power sector, due to a 14% increase in gas-fired power generation capacity, even as the average utilisation of the plants fell. However, gas consumption fell in other sectors, outweighing the increase for power.
Oil products consumption increased slightly, as shown by the bar at the top in the figure above. Warmer weather meant that weather-dependent construction and agricultural activity rose earlier in the year than usual.
However, structural factors, particularly vehicle electrification and the shift to liquified natural gas (LNG) in the freight sector, point to continued declines in oil demand.
Have China’s emissions peaked?
Following the 1.6% decline in the first quarter of 2025, China’s emissions have now been stable or falling for more than a year, starting from the beginning of March 2024.
However, emissions in the 12 months to the end of March 2025 were down only 1% from their recent peak, implying that any short-term jump could lead to a new record high.
After the sharp reduction in the first quarter, emissions from power generation are now down year-on-year for the most recent 12 months.
This has happened four times before over the past four decades – in 2009, 2012, 2015 and 2022. However, the current drop is the first time that the main driver is growth in clean power generation.
The falls in 2009 and 2012 were related to the global financial crisis and the Euro area crisis, while the drop in 2015 was driven by the construction and industrial sector slump that followed the 2008-12 stimulus program.
These economic shocks resulted in the sharp reduction in electricity demand shown in the figure below. The drop in 2022 was a combination of slow power demand growth due to strict “zero-Covid” measures and relatively strong clean-power additions.
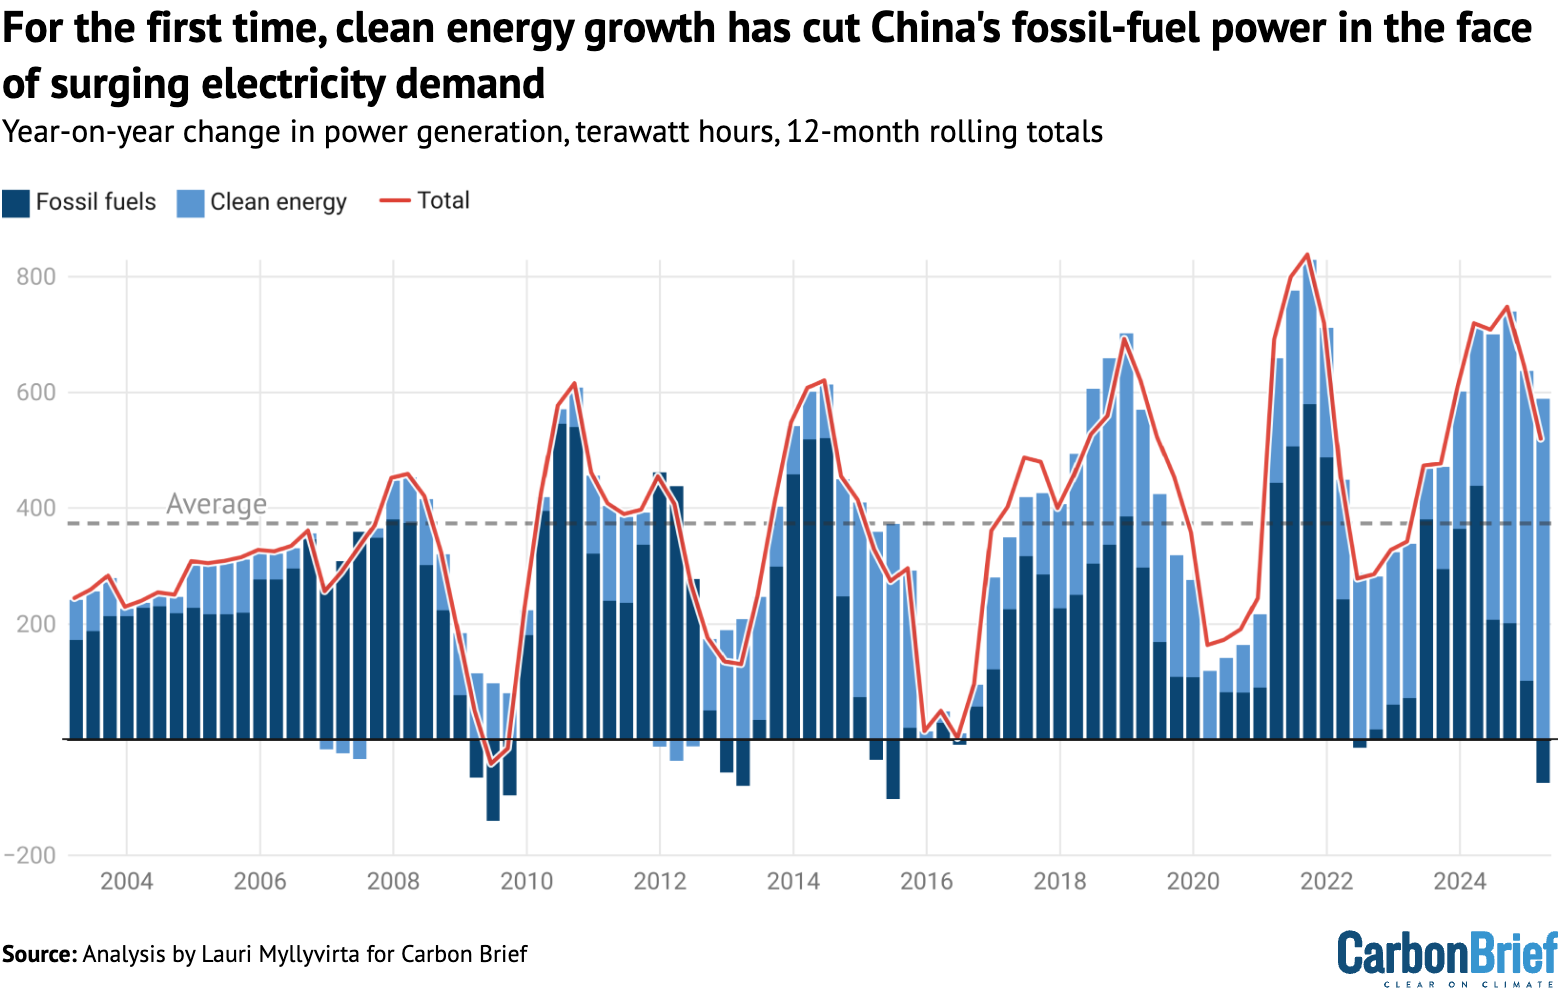
Importantly, the growth in clean power generation in the first quarter of 2025 was not only larger than the rise in demand overall, it was also higher than the average increase in demand over the past 15 years, marked by the dashed line in the figure above.
Moreover, hydropower has been stable year-on-year in the past six months, implying that the clean-energy growth has been driven by increases in solar, wind and nuclear power capacity, not year-to-year variation in hydropower output.
Looking beyond electricity generation, all sectors registered a fall in emissions over the most recent four months from December 2024 to March 2025, except for coal-to-chemicals.
In order for China’s emissions overall to peak and then start declining, CO2 cuts in declining sectors will need to outweigh continued growth elsewhere.
For example, process emissions from cement production peaked in 2021 and have declined by 27% since then, as shown in the top left chart in the figure below.
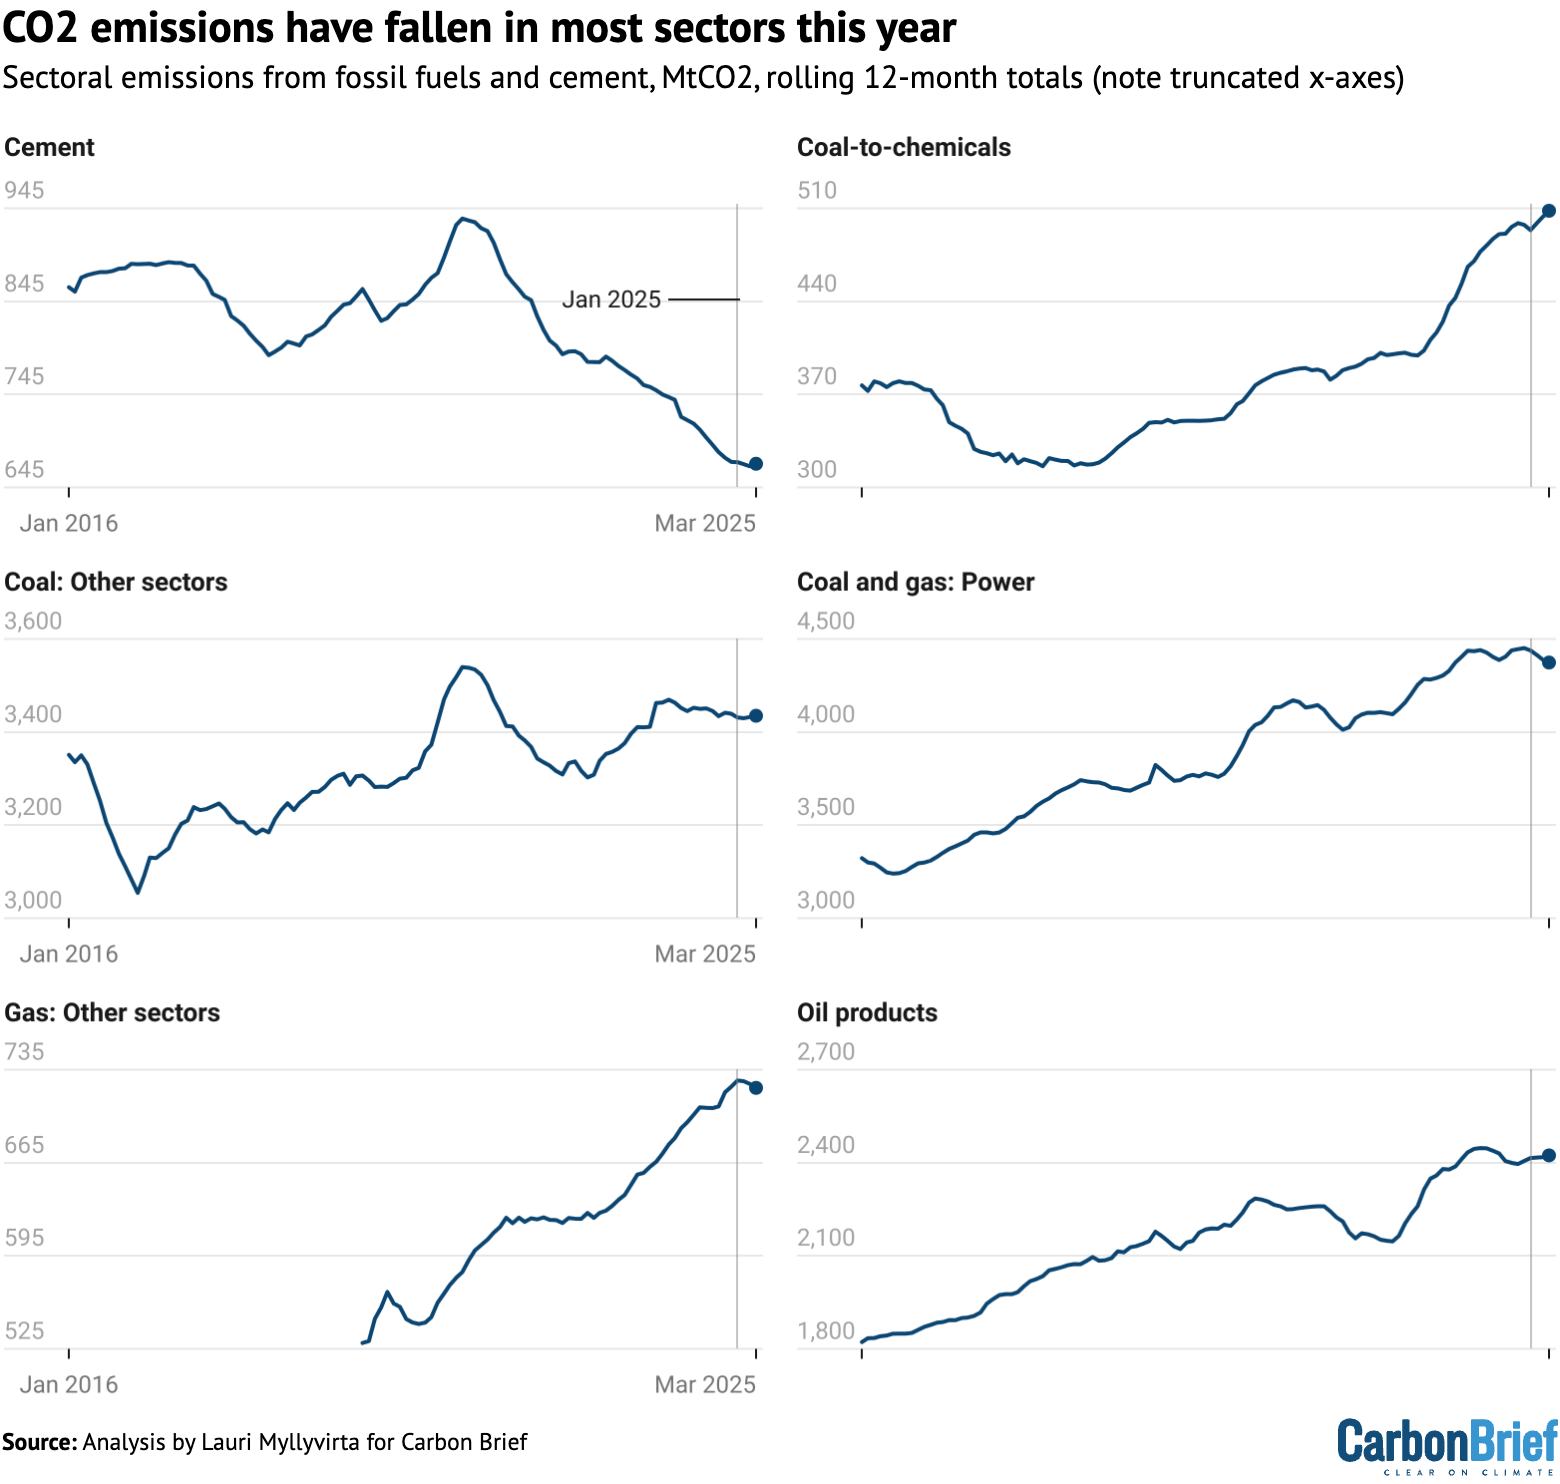
Coal use outside the power and chemicals sectors peaked at the same time as cement, but has been rebounding since then and is now close to previous peak levels.
The China Coal Association expects coal use in the steel and building materials industries to fall, while coal consumption in the chemical industry is projected to continue growing.
Hopes of future growth in demand for coal are pinned on the chemical sector, described as a shift from using coal primarily as a fuel to a role as both a fuel and a raw material.
The association also believes that coal-fired power generation will resume growth – at least in the short term – but it recently revised down its projections for 2025 compared with the outlook at the end of 2024.
The tariff “war” may have affected expectations. One analysis suggests a 0.5 to 1 percentage point reduction in China’s GDP growth rate due to the tariffs could result in a similar reduction in demand for thermal coal – mainly used at power stations.
Oil product consumption has been declining since the post-Covid rebound ended in March 2024, falling 2% from its peak. The long-term trend is expected to be downwards, due to the electrification of transportation, despite rising demand for chemicals and aviation.
Gas use has been falling for a few months, but the trend is likely still increasing.
The table below lists the 12-month periods with the highest emissions for each sector, as well as the reduction since the latest peak in each case.
| Sector | Date of highest emissions | Reduction since peak |
|---|---|---|
| Cement | April 2021 | -28.2% |
| Coal and gas: Power | November 2024 | -1.7% |
| Coal-to-chemicals | March 2025 | Still increasing |
| Coal: Other sectors | April 2021 | -3.0% |
| Gas: Other sectors | December 2024 | -0.8% |
| Oil products | April 2024 | -1.0% |
| Total CO2 | February 2024 | -0.8% |
For all of the sectors other than cement production, it is too early to declare a definitive peak in emissions. Still, there are signs that other sectoral peaks could be past their peak, too.
Indeed, for oil products consumption and steel production, industry projections indicate that the future trend is likely to be falling.
For the power sector, clean-energy additions at or above current levels would likely lead to a structural peak, as clean-energy growth would more than cover electricity demand growth.
Together, these sectors cover more than 80% of China’s total emissions. If all of them enter a structural decline, then total emissions are very likely to do so too.
China pushes domestic demand in response to US tariffs
The economic and emissions outlook for this year and beyond will be affected by the Trump administration’s unprecedented trade tariffs – and China’s counter-measures.
The initial impact was a drop in emissions due to lower factory output in export-oriented coastal provinces and possible knock-on impacts on investment and consumer spending.
Conversely, the temporary easing of tariffs for 90 days will lead to a rush of orders from the US to make up for the short-lived slowdown in trade and to stockpile goods before the relief ends.
China’s reactions to the tariffs focused on counteracting the economic impacts with stimulus.
An anonymous comment piece in People’s Daily, the main Communist party affiliated newspaper, says the country should “strive to make consumption the main driving force and ballast stone of economic growth”, leveraging China’s large domestic market.
(The piece has the byline “People’s Daily commentator”, which implies that it is written by someone with authority.)
The article says that this will involve increasing consumer income, while easing financial and social burdens to boost purchasing power and willingness to consume.
While the temporary easing of tariffs will reduce the urgency of these measures, the US tariff rate on China, at 40%, remains much higher than it was before Trump’s presidency – and China’s leaders will likely want to prepare against the risk of renewed tariff hikes.
The focus will be creating domestic markets for the products China exports to the US. The long-held aim of rebalancing China’s economy towards consumption could finally become reality as a result. A successful rebalancing could mean less energy-intensive growth.
China’s response also includes redoubling its focus on “new quality productive forces”, a concept that emphasises new technology.
The concept includes the clean-energy industry, which has become such an important economic driver in China that it would be hard to leave out of stimulus plans.
A new list of low-carbon demonstration projects, published by the National Development and Reform Commission, provides a look at China’s priorities for clean-energy investment. Green hydrogen, energy storage, “virtual power plants” and industrial decarbonisation based on hydrogen are new growth areas.
In terms of the emissions implications of China’s response to Trump’s tariffs, the big question is whether stimulus focused at these favoured sectors – including the new low-carbon focus areas and other clean-energy industries – is deemed sufficient.
Some traditional recipients of stimulus spending, such as shipbuilding and public infrastructure, have already posted strong growth in the first quarter of this year as a result of stimulus measures announced in 2024.
New wind and solar pricing policy increases uncertainty
An additional source of uncertainty for China’s emissions comes in the form of its new electricity pricing policy for renewable energy, which enters into force in June.
The new policy removes price guarantees pegged to coal-power prices, with new wind and solar projects supposed to secure direct contracts with electricity buyers. This is likely to lead to lower prices being paid to new wind and solar projects.
However, it offers more favourable pricing – via “contracts for difference” – to the amount of new capacity needed to meet central government energy targets.
The immediate effect of the policy will likely be a rush of projects rushing to complete installation before the June deadline, so as to secure guaranteed prices.
This rush was already apparent in the latest data: 23 gigawatts (GW) of solar and 13GW of wind was added in March alone, up 80% and 110% from previous records for the month.
Furthermore, this year’s installations are likely to be very strong, even topping last year’s record, as a lot of centralised solar power and wind-power projects are racing to complete before the end of the 14th five-year plan period.
The China Wind Energy Association expects a new record of 105-115GW installed this year across onshore and offshore wind projects – up from the record-breaking 80GW last year – based on very active bidding last year. It also expects volumes to stay at that level even in 2026 and to then grow further towards 2030.
The China Electricity Council predicts an even larger wind-power capacity addition of 120GW in 2025. Another analyst projects a 20% drop in wind-power capacity additions in 2026, but after an even steeper increase in 2025 to 120-130GW of capacity added. So he also expects 2026 installations to be far above the current record year of 2024.
For solar, the China Photovoltaic Industry Association forecasts a drop in installations of 8-23% this year, from the staggering record of 278GW last year. Even the low end of this projection would see installations stay at 2023 levels in 2025 and then recover from there. The China Electricity Council’s projection for solar additions in 2025 matches the low end of the industry association’s forecast.
The figure below, based on these various projections, shows that additional electricity generation from new clean power capacity is expected to remain above last year’s record-breaking levels in both 2025 and 2026.
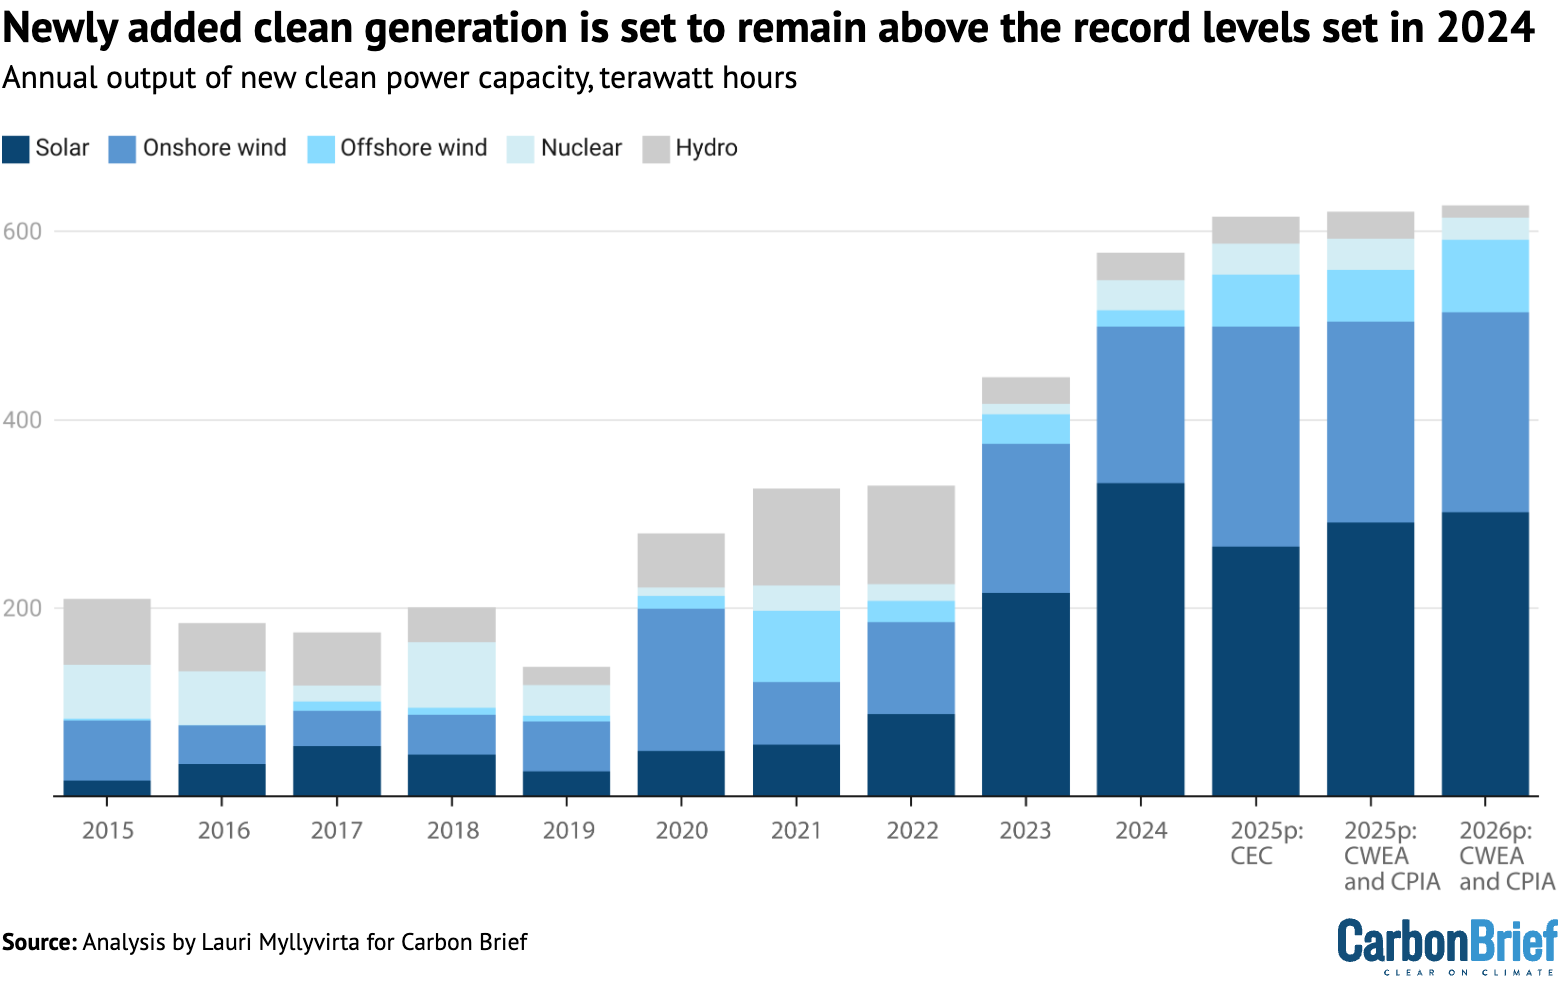
The projections shown in the figure above illustrate that the energy industry expects to be able to navigate the new renewable pricing policy and to maintain a high level of wind and solar additions over the next two years.
The policy has, however, created a lot more uncertainty. The stop-go cycle of a flood of installations in the first half of this year and then a slowdown in the second half – likely especially in the distributed solar segment – is likely to be a tough time for the industry.
The uncertainty relates above all to two things. First is the local implementation of the policy, as provincial governments have a lot of leeway here. Given the economic significance of clean energy for many provinces, they can be expected to seek to implement the policy in a way that minimises disruptions to the industry.
The other source of uncertainty is central government targets. The pricing policy ties the availability of more favorable pricing to central government energy targets, after clean-energy growth outpaced those targets by a wide margin in the past few years.
This emphasises the importance of the targets set for the next five year plan. The National Energy Administration (NEA) is targeting “more than 200GW” per year of clean-energy capacity added, which is far lower than the 360GW added last year.
The effect of the pricing policy also depends on market conditions, of course, with a risk of oversupply of coal-fired power due to the ongoing rapid addition of new coal-fired power plants.
China’s nuclear construction also keeps accelerating, with another 10GW of reactor projects approved in April, on top of 10GW approved in each of the previous two years. These projects will contribute to clean power supply towards 2030 as they are completed.
China faces widening gap to Paris pledge
The uncertainty around wind and solar expansion also has implications for China’s international climate pledges under the Paris Agreement.
After exceptionally slow progress in 2020-23, China is significantly off track for its 2030 commitment to reduce carbon intensity – the emissions per unit of economic output. It is almost certain to miss its 2025 target. Carbon intensity fell by 3.4% in 2024, falling short of the rate of improvement needed to meet the 2025 and 2030 targets.
The government work plan for 2025 did not set a carbon intensity target. It only included a target for reducing the intensity per unit of GDP for energy supply from fossil fuels by 3%, excluding use for raw materials.
This provides an indirect indication of the targeted improvement in carbon intensity. In 2024, carbon intensity fell by 3.4%, while fossil energy intensity fell by 3.8%. If the ratio is similar in 2025, then carbon intensity would need to fall by around 2.5% at a minimum, allowing CO2 emissions to increase by more than 2%, if the target for 5% GDP growth is also met.
The absence of a carbon intensity target and the lack of emphasis on reducing carbon intensity also signals that meeting the target is not seen as a priority at the moment.
The government work plan emphasised the “dual-carbon” goals of peaking CO2 emissions before 2030 and achieving carbon neutrality before 2060.
However, these goals allow CO2 emissions to continue to increase until the end of the decade, implying the potential for a significant absolute emission increase from 2024 levels by 2030. The “dual-carbon” goals, even if met, therefore do not guarantee the delivery of China’s current key international climate commitment, the 2030 carbon-intensity target.
Even if emissions fell this year, improvements to carbon intensity would need to accelerate sharply in the next five years to meet China’s 2030 Paris commitment.
If China remains committed to its 2030 pledge, then this acceleration would need to be reflected in the targets set in the country’s next five-year plan.
Outlook for 2025 and beyond
The past 12 months mark a potentially significant turning point for China’s CO2 emissions, with clean-energy growth for the first time outpacing demand growth and displacing fossil fuel use in the power sector.
Record-breaking clean energy additions expected in 2025, despite new pricing policy uncertainties, suggest that the trend will continue this year.
The longer-term trajectory depends heavily on the targets set in the upcoming five-year plan and on the economic policy response to US tariffs and other economic headwinds.
In the short term, the US tariffs will dampen energy demand growth and emissions. Economic policy designed to offset the impacts of Trump’s tariffs will likely boost the clean-energy sector further and might lead to a shift towards domestic consumption as an economic driver, implying lower energy consumption growth relative to GDP.
On the other hand, previous rounds of economic stimulus in China have led to sharp increases in emissions. If China is to deliver stimulus that targets consumption and new technology, rather than emissions-intensive construction and heavy industry, then it will require a significant break with earlier patterns.
Whether power-sector emissions have peaked will be determined by a race between growth in clean energy supply and total power demand growth.
The new renewable electricity pricing policy, which ties the volume of “contracts for difference” given out to new solar and wind projects to national clean energy targets, further increases the importance of target-setting in China’s upcoming 2035 climate targets under the Paris Agreement and in the next 15th five-year plan, covering 2026-2030.
Sector-by-sector analysis suggests that, in addition to the power sector, emissions have likely also peaked in the building materials and steel sectors, as well as oil products consumption.
These sectors together represent over 80% of China’s fossil fuel-related CO2 emissions. However, there are uncertainties and potential for short-term rebound in all of these sectors.
The sector with remaining potential for substantial emissions growth is coal-to-chemicals. The drop in oil prices after US tariff announcements will undermine the profitability of this sector and likely lead to lower utilisation of plants, even as more capacity is added. China’s counter-tariffs on imports of petrochemical products from the US could have benefited the industry – but these have reportedly been waived.
All of this suggests that there is potential for China’s emissions to continue to fall and for the country to achieve substantial absolute emissions reductions over the next five years.
However, policy choices working in the opposite direction could just as easily see emissions increase further towards 2030.
About the data
Data for the analysis was compiled from the National Bureau of Statistics of China, National Energy Administration of China, China Electricity Council and China Customs official data releases, and from WIND Information, an industry data provider.
Wind and solar output, and thermal power breakdown by fuel, was calculated by multiplying power generating capacity at the end of each month by monthly utilisation, using data reported by China Electricity Council through Wind Financial Terminal.
Total generation from thermal power and generation from hydropower and nuclear power was taken from National Bureau of Statistics monthly releases.
Monthly utilisation data was not available for biomass, so the annual average of 52% for 2023 was applied. Power sector coal consumption was estimated based on power generation from coal and the average heat rate of coal-fired power plants during each month, to avoid the issue with official coal consumption numbers affecting recent data.
When data was available from multiple sources, different sources were cross-referenced and official sources used when possible, adjusting total consumption to match the consumption growth and changes in the energy mix reported by the National Bureau of Statistics.
CO2 emissions estimates are based on National Bureau of Statistics default calorific values of fuels and emissions factors from China’s latest national greenhouse gas emissions inventory, for the year 2018. Cement CO2 emissions factor is based on annual estimates up to 2024.
For oil consumption, apparent consumption is calculated from refinery throughput, with net exports of oil products subtracted.
Original article by Lauri Myllyvirta republished from Carbon Brief under a CC license.